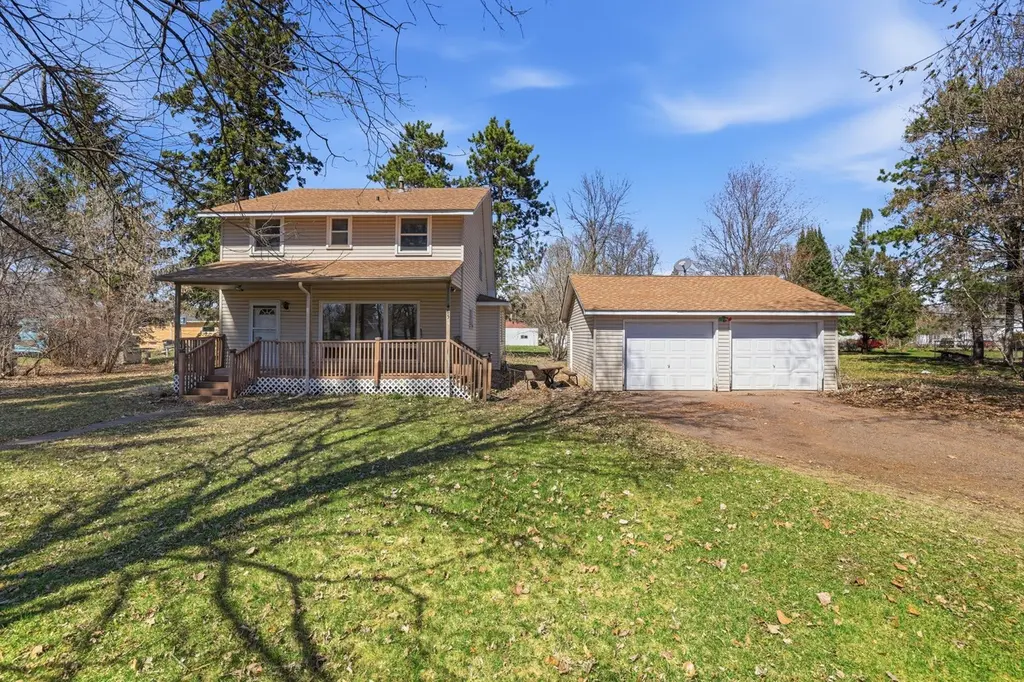
465 W 2nd St · Rush City, MN
Flood risk 4/10 · Minor
- FEMA flood zone
- X (unshaded)
- Chance of flooding over 30 yrs
- 0.2%
- Est. flood insurance / yr
- $507 – $1,088
Fire risk 1/10 · Minimal
- Est. fire insurance / yr
- $888 – $1,650
Heat risk 2/10 · Minimal
- Hot days now (above 98°F)
- 7 days/yr
- Hot days in 30 yrs
- 13 days/yr
Wind risk 1/10 · Minimal
- Chance of severe wind over 30 yrs
- —
Air-quality risk 2/10 · Minimal
- Unhealthy air days now
- 1 days/yr
- Unhealthy air days in 30 yrs
- 1 days/yr
Risk factors via First Street. Map © Google.
Why this score? — see what drove the B grade
The composite is a weighted blend of 9 inputs, each scored 0–100. Each bar is that input's sub-score; the figure is the points it added to the 100-point composite (weight × sub-score).
- Cash flow +30.0/30.0
- 1% rule +10.0/10.0
- DSCR +10.0/10.0
- ARV discount +7.5/15.0
- Schools +3.7/10.0
- Livability +3.5/5.0
- Rent growth +2.5/5.0
- Condition / age +2.5/5.0
- Appreciation +1.3/10.0
$200,000
🖨 Deal sheet 📄 Offer letter ✓ Due diligence
Listing remarks
Charming opportunity with room to grow! This 4-bedroom, 2-bath home sits on a generously sized lot that includes both the main parcel and an additional parcel—offering extra space, flexibility, and future possibilities. A spacious front porch welcomes you in and provides the perfect spot to relax and unwind. Inside, you’ll find a functional layout with great bones and plenty of potential to make it your own. The laundry room offers the option to be converted into an additional bedroom, home office, or flex space to suit your needs. A newer roof adds peace of mind, while the rest of the home is ready for your personal touch and updates. With a little work, this property could tru
Key facts
- 0.6 acre lot
- 2 garage spots
- Built 1903
Property features AI
Exterior
- Parking: Detached or attached 2-car garage (2 garage spaces, approximately 550 sq ft)
- Utilities: City water (connected); City sewer (connected); Natural gas
- Home design: Residential property; One-and-one-half story; Above-grade finished area reported; additional below-ground area; Has additional parcel(s)
- Construction: Stone foundation; Roof older than 8 years
- Exterior features: Vinyl exterior; Front porch; Lot approximately 0.602 acres (150x175)
Interior
- Kitchen: Cooktop; Dishwasher; Refrigerator; Kitchen on main level (17x13)
- Bedrooms: 4 bedrooms (three on the upper level, one upper-level bedroom noted as 'Bedroom 4'); One bedroom listed as 'Bar/Wet Bar Room' on the upper level
- Bathrooms: Main floor 3/4 bath; Upper level full bath
- Heating & cooling: Boiler heating; Window air conditioning units
- Interior features: Front porch; Storage space in basement; Porch; Washer/Dryer hookup
- Laundry & utility: Main level laundry (11x11); Washer/Dryer hookup
Neighborhood map
What this means for you Summary
Snapshot
- This is a 4-bed/2.0-bath single-family listed at $200k.
Deal economics
- At list price, monthly cash flow is $1k ($17k/yr) — positive.
- The deal already cash-flows at list — no discount required.
- Meets the 1% rule at list price ($3k rent vs $200k).
- Recommended offer: $194k (3.0% below list) — sets the bar for market timing.
Location & tenants
- Location reads 69/100 on livability (#355 in MN) — a middle-class / working-renter tenant base. Strengths: cost of living A+, housing A+, crime A; Watch: employment C-, amenities F, commute F.
- Rush City Public School District (rural): math 37% / reading 47% proficiency, ranked #195 of 301 in MN (top 65%) — families likely to look elsewhere, expect single-tenant / working-renter base with shorter leases.
- Market conditions: 49 active listings in the ZIP; 362 units permitted in Chisago County in 2024 (121 in 5+ unit buildings).
Forward outlook
- Local home prices are declining (-3.0%/yr); year-one equity from $1k of loan paydown is wiped out by about $6k of value loss. Plan a longer hold.
- Chisago County population projected at -11% by 2050 — secular population decline; favor cash flow + early exit over multi-decade hold.
- At projected returns (-3.0% appreciation + 3.0% rent growth), your $56k cash investment doubles in ~4 years — after that, you're playing with house money.
Negotiation context
- It's been on market 44 days — a 3% lower offer ($194k) is reasonable based on typical stale-listing flexibility.
- 4 sale attempts since 31y ago with the ask held roughly flat each time — persistent listings suggest the price (not the market) is what's stuck; bring a comps-based counter.
- Current owner paid $75k; list at $200k implies a 167% gain — meaningful room to come down on a strong offer.
Risks & watch-outs
- Watch-outs: built in 1903 — expect roof / HVAC / electrical / plumbing capex.
Questions for the listing agent
- It's been on market 44 days. Have you received any prior offers? Is the seller open to a 3% concession, seller financing, or rate buy-down credit?
- Built in 1903 — when were the roof, HVAC, electrical panel, plumbing, and water heater last replaced?
- Is there a deadline driving the sale (1031 exchange, divorce, estate, relocation)? That informs how much negotiation room exists.
- What's the average days-on-market for RENTAL listings here right now (not sales)? A rising rental-DOM trend means longer vacancies and softer asking-rent achievability than the comps imply.
- What's the recent tenant-quality profile in this submarket — average credit score on applications, eviction rate, late-payment / NSF rate, and stable-employment percentage? A property-management company in the area should have these aggregated.
- How much new for-sale + rental construction is in the pipeline within 1–3 miles? Heavy new supply typically softens prices + rents 12–24 months out; constrained supply supports both.
Investment metrics
- 1% rule
- 1.73% ✓
- Cap rate
- 14.79%
- Cash-on-cash
- 30.35%
- DSCR
- 2.35
- GRM
- 4.8
CMA / ARV
No comps found within radius.
Projected returns pro-forma
-3.0% appreciation · 3.0% rent growth · sell at horizon
- IRR
- 25.0%
- Equity multiple
- 2.03×
- Total profit
- $57,802
- Equity at exit
- $29,821
- IRR
- 32.8%
- Equity multiple
- 3.97×
- Total profit
- $166,516
- Equity at exit
- $17,292
Cash invested: $56,000 (down + closing). Projections, not guarantees.
Landlord ↔ Tenant lean methodology
- Overall (STATE)
- 46 Balanced
- State Minnesota
- 46 Balanced · D+2
- County
- — inherits STATE
- City
- — inherits STATE
ZIP-level market 55069
- Home prices YoY
- -1.7%
- Active inventory
- 49
- Price-to-rent
- 4.8×
Monthly cashflow live
- Estimated rent
- $3,452 medium interval (Pro) →
- Mortgage (P&I)
- −$1,049
- Tax from tax record
- −$178 /mo · $2,142/yr
- Insurance
- −$83
- HOA
- −$0
- Vacancy / Maint / Mgmt
- −$725
- Net cashflow
- $1,416
Break-even live
UW: 25.0% down · 7.5% · 30yr · 1.5% tax · 5.0% vac · 8.0% maint · 8.0% mgmt
Financing live
Cash to close
- Down payment
- $50,000
- Closing costs
- $6,000
- Reserves months
- —
- Total cash needed
- —
Loan-product check · same deal, 3 products live
Conventional
25% down · 7.5% · 30yr
- Down + closing
- —
- Monthly P&I
- —
- Monthly cashflow
- —
- DSCR
- —
- Eligible?
- —
Personal DTI + credit; lowest rate.
DSCR
20% down · 8.5% · 30yr
- Down + closing
- —
- Monthly P&I
- —
- Monthly cashflow
- —
- DSCR
- —
- Eligible?
- —
No personal income docs; deal must DSCR.
Hard money
10% down · 12.0% · 12mo
- Down + closing
- —
- Monthly P&I
- —
- Monthly cashflow
- —
- DSCR
- —
- Eligible?
- —
Short-term bridge; refi at stabilization.
Listing history 19 events
-
2026-06-07statusdays on market $200,000 Pending 44 DOM
-
2026-06-05days on market $200,000 Contingent - Inspection 43 DOM
-
2026-06-04days on market $200,000 Contingent - Inspection 41 DOM
-
2026-06-02days on market $200,000 Contingent - Inspection 40 DOM
-
2026-06-01days on market $200,000 Contingent - Inspection 39 DOM
-
2026-05-31days on market $200,000 Contingent - Inspection 38 DOM
-
2026-05-31days on market $200,000 Contingent - Inspection 37 DOM
-
2026-04-26historical Contingent - Inspection
-
2026-04-24$200,000 Active
-
2026-04-21historical $200,000
-
2009-10-05historical
-
2009-07-07$110,000
-
2009-05-07historical
-
2008-05-07$129,900
-
1996-03-13soldstatus $74,900
-
1996-03-13soldstatus $74,900
-
1995-07-12historical
-
1995-03-09$74,900
-
1992-05-22soldstatus $61,500
ⓘ Source: listings_history table (triggers on properties + properties_extension) + one-shot
backfill from property_details.listing_events for pre-trigger history.
Tax reassessment forecast MN · Partial reset (capped growth)
- Current annual tax
- $2,142 · $178/mo
- Projected year-2 tax
- $2,191 · $183/mo
- Expected delta
- +$49/yr (+$4/mo · 2.3%)
ⓘ Screening estimate from a state-policy table — verify with the county assessor before closing.
Climate risk First Street
- Flood 4/10 Moderate FEMA zone X (unshaded) · 20% chance over 30 yrs
- Wildfire 1/10 Low
- Heat 2/10 Low 7 d/yr ≥98°F today · 13 d/yr by 30 yrs out
- Wind 1/10 Low
- Air quality 2/10 Low 1 unhealthy d/yr today · 1 by 30 yrs out
Nearby sold comps map
Loading sold comps map…
Walkable amenities ~0.75 mi
Loading nearby amenities…
Taxation est. · year 1
- Rental income
- $41,421
- − Mortgage interest
- −$11,203
- − Property taxes
- −$2,142
- − Insurance
- −$1,000
- − Repairs & maintenance
- −$3,314
- − Management
- −$3,314
- − Depreciation
- −$5,818
- Taxable income
- $14,631
- Est. tax owed @ 24.0%
- −$3,511
- After-tax cash flow
- $13,484/yr
For passive investors: Depreciation is non-cash, so a rental often shows a tax loss while cash-flowing — sheltering income. Rental losses are passive: they offset passive income freely, and up to $25,000/yr can offset ordinary (W-2) income if you actively participate and your MAGI is under $100k (phasing out to $0 by $150k); unused losses carry forward. On sale, claimed depreciation is recaptured at up to 25%, and gains may owe capital-gains tax (a 1031 exchange can defer both). Figures are a year-1 estimate at your 24.0% rate — not tax advice; consult a CPA.
Schools (NCES district)
- District
- Rush City Public School District
- NCES district ID
- 2732550
- Math proficiency
- 37% ▼ -26.00%
- Reading proficiency
- 47% ▼ -20.00%
- Median HH income
- $60,045
- Composite
- 37.08/100
- National rank
- #4499
- State rank
- #195 of 301 in MN
Livability — Rush City
- Score
- 69/100
- State rank
- #355
- US rank
- #8328
Category grades
Schools grade is shown separately in the Schools card above.
Census & demographics
- Census place
- Rush City, MN
- Population (ZIP)
- 5,936
Population outlook (Chisago County) Hauer SSP2
- Today (2025)
- 55,187 people
- By 2030
- 55,036 · -0.3%
- By 2040
- 53,293 · -3.4%
- By 2050
- 49,157 · -10.9%
- By 2075
- 38,399 · -30.4%
- By 2100
- 24,646 · -55.3%
Race, ethnicity, and origin ACS 2023
- Neighborhood character
- Predominantly White (86%)
- Race & ethnicity
- White 86% Black 8% Two or more races 3% Asian 2% Native American 1%
- Common ancestry
- Portuguese 10% Romanian 3% Lithuanian 2%
- Foreign-born
- 2% · Canada
- Languages at home
- 98% English-only · Spanish 1% Other Asian/Pacific 1% Tagalog/Filipino 1%
Political lean MEDSL · Chisago
- 2024 margin
- Solid R (+31.4) · D 33.5% · R 64.9% · Other 1.6%
- 2008→2024 swing
- -21.2pp toward R · 2008: -10.3pp · 2024: -31.4pp
- All cycles
- 2024: R+31.4 2020: R+29.2 2016: R+30.5 2012: R+12.6 2008: R+10.3
Not yet ingested
- Civics
- —
Market trends
- HPI YoY
- ▼ -7.49%
- Current HPI
- 428.9296
- Rent YoY
- —
- Metro
- —
- State GDP YoY
- ▲ 2.41%
- F500 in state
- 34
Industry mix (Fortune 500 HQ in MN)
| Industry | F500 HQs | Revenue |
|---|---|---|
| Healthcare | 2 | $407B |
|
||
| Retail | 2 | $150B |
|
||
| Consumer Goods | 2 | $32B |
|
||
| Industrial Machinery | 2 | $6B |
|
||
| Agriculture | 1 | $40B |
|
||
| Healthcare / Medical Devices | 1 | $32B |
|
||
Price history
+225.2% since first listed12 events — show timeline
- 2026-04-26 Contingent — NORTHSTARMLS as Distributed by MLS Grid
- 2026-04-24 Listed $200,000 NORTHSTARMLS as Distributed by MLS Grid
- 2026-04-21 Coming Soon $200,000 NORTHSTARMLS as Distributed by MLS Grid
- 2009-10-05 Listing Removed — NORTHSTARMLS as Distributed by MLS Grid
- 2009-07-07 Listed $110,000 NORTHSTARMLS as Distributed by MLS Grid
- 2009-05-07 Listing Removed — NORTHSTARMLS as Distributed by MLS Grid
- 2008-05-07 Listed $129,900 NORTHSTARMLS as Distributed by MLS Grid
- 1996-03-13 Sold (Public Records) $74,900 Public Records
- 1996-03-13 Sold (MLS) $74,900 NORTHSTARMLS as Distributed by MLS Grid
- 1995-07-12 Listing Removed — NORTHSTARMLS as Distributed by MLS Grid
- 1995-03-09 Listed $74,900 NORTHSTARMLS as Distributed by MLS Grid
- 1992-05-22 Sold (Public Records) $61,500 Public Records
Property tax history
+4.9%/yrLatest (2025): $2,142 · -0.2% YoY. Source: county tax records.
Cash-flow waterfall
monthlySold comps — $/sqft
last 12 mo · ≤1 miLoading sold comps…