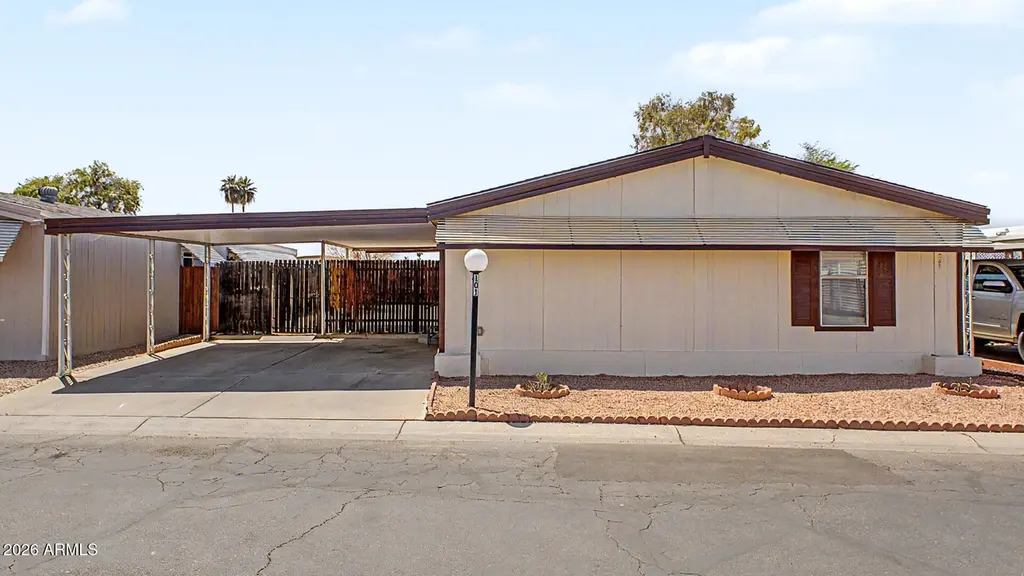
10951 N 91st Ave #101 · Peoria, AZ
Flood risk 1/10 · Minimal
- FEMA flood zone
- X (shaded)
- Chance of flooding over 30 yrs
- 0.0%
- Est. flood insurance / yr
- $507 – $1,088
Fire risk 1/10 · Minimal
- Est. fire insurance / yr
- $610 – $1,132
Heat risk 9/10 · Severe
- Hot days now (above 113°F)
- 7 days/yr
- Hot days in 30 yrs
- 19 days/yr
Wind risk 1/10 · Minimal
- Chance of severe wind over 30 yrs
- —
Air-quality risk 2/10 · Minimal
- Unhealthy air days now
- 1 days/yr
- Unhealthy air days in 30 yrs
- 1 days/yr
Risk factors via First Street. Map © Google.
Why this score? — see what drove the C+ grade
The composite is a weighted blend of 9 inputs, each scored 0–100. Each bar is that input's sub-score; the figure is the points it added to the 100-point composite (weight × sub-score).
- Cash flow +30.0/30.0
- 1% rule +10.0/10.0
- DSCR +10.0/10.0
- Livability +3.8/5.0
- Condition / age +3.8/5.0
- Schools +3.5/10.0
- Rent growth +2.7/5.0
- ARV discount +0.0/15.0
- Appreciation +0.0/10.0
$135,000
🖨 Deal sheet 📄 Offer letter ✓ Due diligence
Listing remarks
Well-maintained home featuring original finishes in like-new condition. Sold as-is with great potential to make it your own. All appliances included. Enjoy the benefit of an affordable lot lease, with water, sewer, and trash included. Conveniently located near Loop 101 & Peoria with easy access to shopping and dining. Spacious backyard with established landscaping--perfect for relaxing or entertaining.
Key facts
- 3,500 sq ft lot
- 2 parking spots
- Community pool
Property features AI
Finance
- Other: Annual tax information available
- HOA & community: Land lease community (monthly land lease); Land lease payment of $690 per month; Association covers sewer, water, trash, street maintenance, and other items
Exterior
- Parking: Covered parking for 2 vehicles; 2-car carport
- Utilities: City water; Public sewer
- Home design: Manufactured/mobile home; Leasehold ownership
- Construction: Wood frame construction; Painted exterior; Composition roof
- Exterior features: Gravel/stone front yard; Gravel/stone backyard; Wood fencing; Community pool
Interior
- Kitchen: Built-in microwave; Laminate counters; Refrigerator; Dishwasher; Garbage disposal
- Bedrooms: Up to 3 bedrooms
- Flooring: Laminate flooring
- Bathrooms: 2 full bathrooms
- Heating & cooling: Electric heating; Central air; Ceiling fan(s)
- Interior features: Breakfast bar; No interior steps; Vaulted ceilings; Full bath in primary bedroom; Separate shower and tub; Laminate counters
- Laundry & utility: Inside laundry
Neighborhood map
What this means for you Summary
Snapshot
- This is a 3-bed/2.0-bath manufactured listed at $135k. Condition is rated good.
Deal economics
- At list price, monthly cash flow is $679 ($8k/yr) — positive.
- The deal already cash-flows at list — no discount required.
- Meets the 1% rule at list price ($2k rent vs $135k).
- Recommended offer: $131k (3.0% below list) — sets the bar for market timing.
- Cap rate 12.3% vs local median 3.3% in Peoria — top-decile yield for the area; either an underpriced asset or a hidden risk that comps aren't pricing in. Stress-test before assuming the spread holds.
Location & tenants
- Location reads 76/100 on livability (#14 in AZ, #3,603 nationally) — a middle-class / working-renter tenant base. Strengths: housing A+, commute A, employment A; Watch: cost of living C-, amenities D, health & safety F.
- Peoria Unified School District (4237) (suburban): math 36% / reading 42% proficiency, ranked #64 of 249 in AZ (top 26%) — families likely to look elsewhere, expect single-tenant / working-renter base with shorter leases.
- Zoned schools: Sun Valley Elementary School (math 23% / reading 29%, grade F, #623 of 1,109 statewide, top 57%, 806 students, 65% FRL); Peoria High School (math 18% / reading 22%, grade F, #225 of 381 statewide, top 60%, 1,566 students, 54% FRL) — zoned schools average 59% FRL vs 35% district-wide (24 pts higher); higher-poverty schools than district average — tighter screening recommended.
- Zoned-school proficiency averages 23% at this address vs 39% district-wide (-16 pts) — the specific schools serving this property underperform the Peoria Unified School District (4237) average; the district grade overstates school quality for this exact location.
- Market conditions: Rents flat; 333 active listings in the ZIP; 40 comparable units currently listed for rent nearby; rentals at typical pace (median 24d on market — plan ~3-4 weeks tenant-placement turnaround); 36,011 units permitted in Maricopa County in 2024 (12,801 in 5+ unit buildings).
- This rent runs 36% of the median local income ($67k/yr) — at the standard rent-burdened threshold; future hikes will face affordability resistance.
Forward outlook
- Local home prices are declining (-3.0%/yr); year-one equity from $933 of loan paydown is wiped out by about $4k of value loss. Plan a longer hold.
- Maricopa County population projected at +38% by 2050 — long-run rental-demand tailwind backs the buy-and-hold thesis.
- At projected returns (-3.0% appreciation + 0.6% rent growth), your $38k cash investment doubles in ~7 years — after that, you're playing with house money.
Negotiation context
- It's been on market 43 days — a 3% lower offer ($131k) is reasonable based on typical stale-listing flexibility.
Risks & watch-outs
- Climate carrying-cost: extreme-heat days projected 7→19/yr by 2055 (HVAC capex compounding) — expect insurance premiums to compound above CPI over the hold.
Questions for the listing agent
- It's been on market 43 days. Have you received any prior offers? Is the seller open to a 3% concession, seller financing, or rate buy-down credit?
- Is there a deadline driving the sale (1031 exchange, divorce, estate, relocation)? That informs how much negotiation room exists.
- Schools are B-rated — typically a magnet for longer-tenancy family renters. What's the average tenant stay here, and is there a school-zone premium baked into asking?
- What's the average days-on-market for RENTAL listings here right now (not sales)? A rising rental-DOM trend means longer vacancies and softer asking-rent achievability than the comps imply.
- What's the recent tenant-quality profile in this submarket — average credit score on applications, eviction rate, late-payment / NSF rate, and stable-employment percentage? A property-management company in the area should have these aggregated.
- How much new for-sale + rental construction is in the pipeline within 1–3 miles? Heavy new supply typically softens prices + rents 12–24 months out; constrained supply supports both.
Investment metrics
- 1% rule
- 1.51% ✓
- Cap rate
- 12.33%
- Cash-on-cash
- 21.56%
- DSCR
- 1.96
- GRM
- 5.5
CMA / ARV
- ARV (median comp)
- $95,000
- List price
- $135,000
- Delta
- 42.11%
- Verdict
- OVERPRICED
- Comps
- 17 within 1.0 mi
Show comp detail 10 sales within ~0.75 mi
| Address | Dist | Beds/Ba | Sqft | Sold | Price | $/sf | Match |
|---|---|---|---|---|---|---|---|
| 10951 N 91st Ave #254 | 0.00mi | 3/2.0 | 1,680 (0%) | 5mo | $121,000 | $72 | 96 |
| 10951 N 91st Ave #84 | 0.22mi | 3/2.0 | 1,680 (0%) | 4mo | $138,000 | $82 | 86 |
| 10951 N 91st Ave #263 | 0.23mi | 3/2.0 | 1,792 (+7%) | 4mo | $95,000 | $53 | 74 |
| 10951 N 91st Ave #184 | 0.22mi | 4/2.0 (+1) | 1,584 (-6%) | 1mo | $120,000 | $76 | 74 |
| 11411 N 91st Ave #75 | 0.16mi | 2/2.0 (-1) | 1,568 (-7%) | 6mo | $75,000 | $48 | 72 |
| 11000 N 91st Ave #19 | 0.36mi | 3/2.0 | 1,600 (-5%) | 10mo | $125,000 | $78 | 67 |
| 10951 N 91st Ave #266 | 0.23mi | 3/2.0 | 1,456 (-13%) | 3mo | $119,000 | $82 | 64 |
| 10951 N 91st Ave #56 | 0.23mi | 4/2.0 (+1) | 1,526 (-9%) | 12mo | $172,000 | $113 | 59 |
| 11411 N 91st Ave #175 | 0.16mi | 2/2.0 (-1) | 1,456 (-13%) | 12mo | $74,900 | $51 | 56 |
| 10951 N 91st Ave #92 | 0.23mi | 2/2.0 (-1) | 1,440 (-14%) | 21mo | $80,000 | $56 | 43 |
Match score weights: distance 35% · size 25% · config 20% · recency 20%. Top-matched comps best support the ARV.
Projected returns pro-forma
-3.0% appreciation · 0.62% rent growth · sell at horizon
- IRR
- 11.4%
- Equity multiple
- 1.44×
- Total profit
- $16,641
- Equity at exit
- $20,129
- IRR
- 18.5%
- Equity multiple
- 2.37×
- Total profit
- $51,644
- Equity at exit
- $11,672
Cash invested: $37,800 (down + closing). Projections, not guarantees.
Landlord ↔ Tenant lean methodology
- Overall (STATE)
- 87 Strongly Landlord-Friendly
- State Arizona
- 87 Strongly Landlord-Friendly · R+3
- County
- — inherits STATE
- City
- — inherits STATE
ZIP-level market 85345
- Home prices YoY
- -19.8%
- Rents YoY
- 0.6%
- Active inventory
- 333
- Price-to-rent
- 5.5×
Monthly cashflow live
- Estimated rent
- $2,041 high interval (Pro) →
- Mortgage (P&I)
- −$708
- Tax est. 1.5%
- −$169 /mo · $2,025/yr
- Insurance
- −$56
- HOA
- −$0
- Vacancy / Maint / Mgmt
- −$429
- Net cashflow
- $679
Break-even live
UW: 25.0% down · 7.5% · 30yr · 1.5% tax · 5.0% vac · 8.0% maint · 8.0% mgmt
Financing live
Cash to close
- Down payment
- $33,750
- Closing costs
- $4,050
- Reserves months
- —
- Total cash needed
- —
Loan-product check · same deal, 3 products live
Conventional
25% down · 7.5% · 30yr
- Down + closing
- —
- Monthly P&I
- —
- Monthly cashflow
- —
- DSCR
- —
- Eligible?
- —
Personal DTI + credit; lowest rate.
DSCR
20% down · 8.5% · 30yr
- Down + closing
- —
- Monthly P&I
- —
- Monthly cashflow
- —
- DSCR
- —
- Eligible?
- —
No personal income docs; deal must DSCR.
Hard money
10% down · 12.0% · 12mo
- Down + closing
- —
- Monthly P&I
- —
- Monthly cashflow
- —
- DSCR
- —
- Eligible?
- —
Short-term bridge; refi at stabilization.
Rent comps 40 comps
| Address | Beds | Baths | Sqft | Rent | $/sqft | DOM | Units | Dist |
|---|---|---|---|---|---|---|---|---|
| 8821 W Sahuaro Dr Peoria, AZ | 3.0 | 2.0 | 1074 | $1,595 | $1.49 | 24d | 1 | 0.14mi |
| 8821 W Sahuaro Dr Peoria, AZ | 3.0 | 2.0 | 1074 | $1,595 | $1.49 | 2d | 1 | 0.14mi |
| 11411 N 91st Ave Unit 134 Peoria, AZ | 3.0 | 2.0 | 1310 | $1,599 | $1.22 | 43d | 1 | 0.31mi |
| 9221 W Gary Rd Peoria, AZ | 4.0 | 1.0 | 1300 | $2,000 | $1.54 | 43d | 1 | 0.41mi |
| 8930 W Monroe St Peoria, AZ | 3.0 | 2.0 | 1300 | $1,899 | $1.46 | 43d | 2 | 0.42mi |
| 8930 W Monroe St Peoria, AZ | 3.0 | 2.0 | 1300 | $2,099 | $1.61 | 24d | 1 | 0.42mi |
| 8889 W Cameron Dr Peoria, AZ | 4.0 | 2.5 | 1998 | $2,535 | $1.27 | 43d | 1 | 0.43mi |
| 8889 W Cameron Dr Peoria, AZ | 4.0 | 2.5 | 1998 | $2,290 | $1.15 | 22d | 1 | 0.44mi |
| 10221 N 87th Ln Peoria, AZ | 3.0 | 2.0 | 1232 | $2,059 | $1.67 | 43d | 1 | 0.44mi |
| 10101 N 91st Ave #109 Peoria, AZ | 2.0 | 2.5 | 1161 | $1,395 | $1.20 | 2d | 1 | 0.58mi |
| 8647 W Brown St Peoria, AZ | 4.0 | 2.0 | 2073 | $3,295 | $1.59 | 22d | 1 | 0.60mi |
| 9002 W Malapai Dr Peoria, AZ | 3.0 | 2.0 | 1270 | $2,040 | $1.61 | 20d | 1 | 0.61mi |
| 8763 W Paradise Dr Peoria, AZ | 3.0 | 2.0 | 1575 | $1,800 | $1.14 | 43d | 1 | 0.71mi |
| 8311 W Edwards St Peoria, AZ | 3.0 | 2.0 | 1242 | $2,100 | $1.69 | 24d | 1 | 0.72mi |
| 8642 W Laurel Ln Peoria, AZ | 4.0 | 2.0 | 1680 | $2,300 | $1.37 | 43d | 1 | 0.73mi |
| 8543 W Cherry Hills Dr Peoria, AZ | 4.0 | 2.0 | 1680 | $2,341 | $1.39 | 24d | 1 | 0.74mi |
| 8834 W Purdue Ave Peoria, AZ | 3.0 | 2.0 | 1319 | $1,800 | $1.36 | 3d | 1 | 0.76mi |
| 8782 W Shaw Butte Dr Peoria, AZ | 3.0 | 2.0 | 1575 | $2,200 | $1.40 | 24d | 1 | 0.78mi |
| 11110 N 82nd Ln Peoria, AZ | 3.0 | 2.0 | 1350 | $1,899 | $1.41 | 24d | 1 | 0.79mi |
| 8621 W Shaw Butte Dr Peoria, AZ | 3.0 | 2.0 | 1546 | $1,975 | $1.28 | 18d | 1 | 0.82mi |
| 9426 W Monroe St Peoria, AZ | 3.0 | 3.5 | 1405 | $1,800 | $1.28 | 16d | 1 | 0.82mi |
| 11175 N 82nd Ln Peoria, AZ | 3.0 | 2.0 | 1821 | $2,390 | $1.31 | 2d | 1 | 0.82mi |
| 10316 N 94th Ln Peoria, AZ | 3.0 | 2.0 | 1352 | $2,000 | $1.48 | 24d | 1 | 0.82mi |
| 8630 W Shaw Butte Dr Peoria, AZ | 3.0 | 2.0 | 1284 | $1,951 | $1.52 | 12d | 1 | 0.84mi |
| 9607 N 88th Dr Peoria, AZ | 4.0 | 2.0 | 1541 | $1,989 | $1.29 | 20d | 1 | 0.85mi |
| 9323 W Ironwood Dr Peoria, AZ | 3.0 | 2.0 | 1306 | $1,985 | $1.52 | 24d | 1 | 0.90mi |
| 9323 W Ironwood Dr Peoria, AZ | 3.0 | 2.0 | 1306 | $2,085 | $1.60 | 43d | 1 | 0.90mi |
| 11635 N 83rd Ave Peoria, AZ | 4.0 | 2.0 | 1740 | $2,070 | $1.19 | 5d | 1 | 0.91mi |
| 8368 W Paradise Dr Peoria, AZ | 3.0 | 2.0 | 1666 | $2,125 | $1.28 | 43d | 1 | 0.95mi |
| 8556 W Carol Ave Peoria, AZ | 3.0 | 2.0 | 1573 | $2,199 | $1.40 | 3d | 1 | 0.96mi |
| 8551 W Carol Ave Peoria, AZ | 3.0 | 2.0 | 1323 | $2,135 | $1.61 | 11d | 1 | 1.00mi |
| 11014 N 81st Ave Peoria, AZ | 3.0 | 3.0 | 1133 | $1,699 | $1.50 | 5d | 1 | 1.01mi |
| 9427 W Ironwood Dr Peoria, AZ | 4.0 | 2.0 | 1591 | $1,944 | $1.22 | 11d | 1 | 1.01mi |
| 12160 N 83rd Dr Peoria, AZ | 4.0 | 2.0 | 1818 | $1,995 | $1.10 | 22d | 1 | 1.02mi |
| 9311 W Carol Ave Peoria, AZ | 4.0 | 2.5 | 2178 | $2,195 | $1.01 | 43d | 1 | 1.04mi |
| 10104 N 96th Dr Unit A Peoria, AZ | 2.0 | 2.0 | 1072 | $1,750 | $1.63 | 24d | 1 | 1.06mi |
| 8165 W Whitney Dr Peoria, AZ | 1.0–2.0 | 1.0–2.0 | 911 | $2,223 | $2.44 | 1d | 229 | 1.10mi |
| 8563 W Mission Ln Peoria, AZ | 3.0 | 2.0 | 1323 | $1,950 | $1.47 | 24d | 1 | 1.13mi |
| 9626 W Mountain View Rd Unit A Peoria, AZ | 2.0 | 2.0 | 1156 | $1,500 | $1.30 | 43d | 1 | 1.17mi |
| 8940 W Olive Ave Peoria, AZ | 2.0 | 2.0 | 1446 | $1,600 | $1.11 | 43d | 1 | 1.17mi |
Listing history 15 events
-
2026-06-18days on market $135,000 Active 43 DOM
-
2026-06-17days on market $135,000 Active 42 DOM
-
2026-06-16days on market $135,000 Active 41 DOM
-
2026-06-15days on market $135,000 Active 40 DOM
-
2026-06-13days on market $135,000 Active 38 DOM
-
2026-06-13days on market $135,000 Active 37 DOM
-
2026-06-09days on market $135,000 Active 34 DOM
-
2026-06-08days on market $135,000 Active 33 DOM
-
2026-06-07days on market $135,000 Active 32 DOM
-
2026-06-04days on market $135,000 Active 29 DOM
-
2026-06-03days on market $135,000 Active 28 DOM
-
2026-06-02days on market $135,000 Active 27 DOM
-
2026-06-01days on market $135,000 Active 26 DOM
-
2026-05-31days on market $135,000 Active 25 DOM
-
2026-05-06$135,000 Active 409-char remark
ⓘ Source: listings_history table (triggers on properties + properties_extension) + one-shot
backfill from property_details.listing_events for pre-trigger history.
Climate risk First Street
- Flood 1/10 Low FEMA zone X (shaded) · 0% chance over 30 yrs
- Wildfire 1/10 Low
- Heat 9/10 Extreme 7 d/yr ≥113°F today · 19 d/yr by 30 yrs out
- Wind 1/10 Low
- Air quality 2/10 Low 1 unhealthy d/yr today · 1 by 30 yrs out
Nearby sold comps map
Loading sold comps map…
Walkable amenities ~0.75 mi
Loading nearby amenities…
Taxation est. · year 1
- Rental income
- $24,489
- − Mortgage interest
- −$7,562
- − Property taxes
- −$2,025
- − Insurance
- −$675
- − Repairs & maintenance
- −$1,959
- − Management
- −$1,959
- − Depreciation
- −$3,927
- Taxable income
- $6,381
- Est. tax owed @ 24.0%
- −$1,531
- After-tax cash flow
- $6,619/yr
For passive investors: Depreciation is non-cash, so a rental often shows a tax loss while cash-flowing — sheltering income. Rental losses are passive: they offset passive income freely, and up to $25,000/yr can offset ordinary (W-2) income if you actively participate and your MAGI is under $100k (phasing out to $0 by $150k); unused losses carry forward. On sale, claimed depreciation is recaptured at up to 25%, and gains may owe capital-gains tax (a 1031 exchange can defer both). Figures are a year-1 estimate at your 24.0% rate — not tax advice; consult a CPA.
Condition & rehab AI · 12 photos
This well-maintained manufactured home features original finishes in good condition, with minor wear in the kitchen and bathrooms. A fresh coat of paint and updated cabinetry would significantly enhance its curb appeal and value.
Repairs flagged
- Minor kitchen cabinets — Wear
- Minor bathroom cabinets — Wear
- Minor kitchen appliances — Wear
Value-add opportunities
- Both Paint interior walls — Enhances curb appeal and interior aesthetics
- Both Replace kitchen cabinets — Modernizes kitchen and increases value
- Both Replace bathroom cabinets — Modernizes bathroom and increases value
Renovation cost estimate screening
| Repair item | Severity | Est. cost |
|---|---|---|
| kitchen cabinets · Wear | Minor | $500–3,000 |
| bathroom cabinets · Wear | Minor | $500–3,000 |
| kitchen appliances · Wear | Minor | $500–3,000 |
| Total estimated repair cost · 3 items | $1,500–9,000 |
Value-add ROI direction
- Both Paint interior walls — Enhances curb appeal and interior aesthetics ↑
- Both Replace kitchen cabinets — Modernizes kitchen and increases value ↑
- Both Replace bathroom cabinets — Modernizes bathroom and increases value ↑
ⓘ Cost ranges are severity-bucket heuristics (US national rule-of-thumb). Get contractor quotes + a written scope before underwriting a rehab budget.
Schools (NCES district)
- District
- Peoria Unified School District (4237)
- NCES district ID
- 0406250
- Math proficiency
- 36% ▼ -14.00%
- Reading proficiency
- 42% ▼ -8.00%
- Median HH income
- $60,171
- Composite
- 34.62/100
- National rank
- #5152
- State rank
- #64 of 249 in AZ
Livability — Peoria
- Score
- 76/100
- State rank
- #14
- US rank
- #3603
Category grades
Schools grade is shown separately in the Schools card above.
Census & demographics
- Census place
- Peoria, AZ
- County
- Maricopa County · 4,537,380 people
- City population
- 206,687
- Metro
- Phoenix-Mesa-Chandler, AZ
- Population (ZIP)
- 60,918
- Household income
- $67,380
- Rent vs Own
- Severe rent burden
- 1879.0
Population outlook (Maricopa County) Hauer SSP2
- Today (2025)
- 4,979,203 people
- By 2030
- 5,378,229 · +8.0%
- By 2040
- 6,156,598 · +23.6%
- By 2050
- 6,872,376 · +38.0%
- By 2075
- 8,401,270 · +68.7%
- By 2100
- 9,247,439 · +85.7%
Race, ethnicity, and origin ACS 2023
- Neighborhood character
- Diverse neighborhood (Simpson 0.62)
- Race & ethnicity
- White 51% Hispanic / Latino 34% Two or more races 14% Black 5% Asian 4% Native American 2%
- Hispanic origin (detail)
- Mexican 29%
- Common ancestry
- Romanian 2% Italian 2% Slovak 1%
- Foreign-born
- 13% · Canada, Vietnam
- Languages at home
- 76% English-only · Spanish 18% Other Indo-European 1% Vietnamese 1%
Political lean MEDSL · Maricopa
- 2024 margin
- Toss-up / Even · D 47.7% · R 51.2% · Other 1.1%
- 2008→2024 swing
- +7.1pp toward D · 2008: -10.6pp · 2024: -3.5pp
- All cycles
- 2024: R+3.5 2020: D+2.2 2016: R+3.5 2012: R+12.0 2008: R+10.6
Not yet ingested
- Civics
- —
Market trends
- HPI YoY
- ▼ -80.77%
- Current HPI
- 328.1069
- Rent YoY
- ▲ 0.62%
- Metro
- Phoenix-Mesa-Chandler, AZ
- State GDP YoY
- ▲ 4.54%
- F500 in state
- 20
Industry mix (Fortune 500 HQ in AZ)
| Industry | F500 HQs | Revenue |
|---|---|---|
| Technology | 2 | $13B |
|
||
| Mining / Metals | 1 | $23B |
|
||
| Environmental Services | 1 | $16B |
|
||
| Metals / Steel | 1 | $14B |
|
||
| Technology Distribution | 1 | $9B |
|
||
| Homebuilding | 1 | $8B |
|
||
Price history
1 event — show timeline
- 2026-05-06 Listed $135,000 ARMLS
Cash-flow waterfall
monthlySold comps — $/sqft
last 12 mo · ≤1 miLoading sold comps…