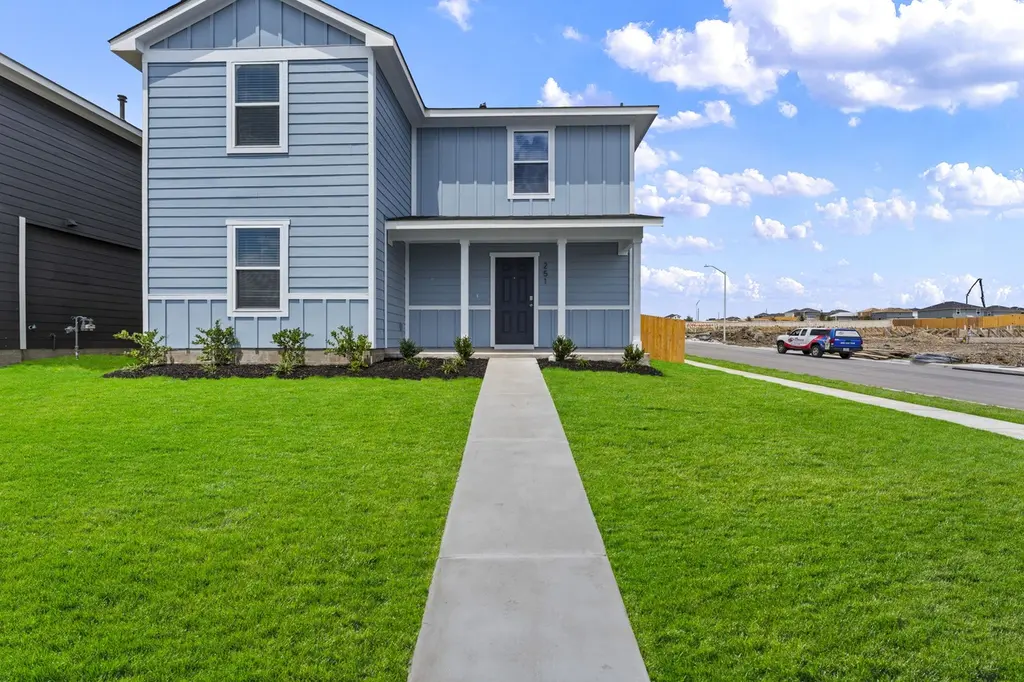
251 Bardwell Way · Niederwald, TX
Flood risk No data
- FEMA flood zone
- —
- Chance of flooding over 30 yrs
- —
- Est. flood insurance / yr
- —
Fire risk No data
- Est. fire insurance / yr
- —
Heat risk No data
- Hot days now (above threshold)
- —
- Hot days in 30 yrs
- —
Wind risk No data
- Chance of severe wind over 30 yrs
- —
Air-quality risk No data
- Unhealthy air days now
- —
- Unhealthy air days in 30 yrs
- —
Risk factors via First Street. Map © Google.
Why this score? — see what drove the D- grade
The composite is a weighted blend of 9 inputs, each scored 0–100. Each bar is that input's sub-score; the figure is the points it added to the 100-point composite (weight × sub-score).
- ARV discount +12.8/15.0
- Cash flow +8.6/30.0
- Condition / age +4.0/5.0
- Schools +3.5/10.0
- 1% rule +3.0/10.0
- Livability +2.9/5.0
- DSCR +2.3/10.0
- Rent growth +2.1/5.0
- Appreciation +0.0/10.0
$297,035
🖨 Deal sheet 📄 Offer letter ✓ Due diligence
Listing remarks
MOVE IN READY! Check out the Pearl floorplan featured in our Prairie Lakes community in Buda, TX. This home offers 1,938 square feet of living space across 5 bedrooms, 2.5 bathrooms and 2 stories. As you enter through the front door, you're greeted by one of the main bedroom with an en-suite that includes a large walk-in closet. Stepping further into the home you immediately notice the gourmet kitchen with plenty of counter and cabinet space. The kitchen features stainless steel appliances, white cabinets, and quartz countertops. The kitchen flows into the living area with windows that let in natural light giving the home a bright and open feel. Making your way upstairs, you'll find the 4
Key facts
- Quartz countertops
- Open concept kitchen
- Natural light
Tags
Property features AI
Finance
- HOA & community: Homeowners association (Prairie Lakes); Monthly association fee of $80; Association fee includes common area maintenance; Community features: clubhouse, playground, park, trails/paths, community mailbox, common grounds/area
Exterior
- Parking: Attached garage facing front; 2 covered parking spaces (2 total)
- Security: Smoke detector(s)
- Utilities: Electricity available; Natural gas available; Water connected (Municipal Utility District); Public sewer / sewer connected
- Home design: New construction; 2 stories; Faces southwest; Built by DR HORTON
- Construction: HardiPlank-type siding; Radiant barrier; Composition shingle roof; Slab foundation; New construction (builder source)
- Exterior features: Private yard; Front porch; Back yard; Corner lot; Front yard; Wood fencing (fenced backyard); Community pool
Interior
- Kitchen: Dishwasher; Gas range; Microwave; Disposal; Exhaust/vented exhaust fan
- Bedrooms: Main level primary bedroom; One main level bedroom
- Flooring: Carpet; Laminate
- Bathrooms: 3 full bathrooms
- Heating & cooling: Central heating; Central air conditioning
- Interior features: Open floorplan; Kitchen island; Pantry; Quartz counters; Recessed lighting; Smart home features; Walk-in closet(s); Double pane windows
- Laundry & utility: Main level laundry room; Gas dryer hookup
Neighborhood map
What this means for you Summary
Snapshot
- This is a 5-bed/3.0-bath single-family listed at $297k. Condition is rated good.
Deal economics
- At list price, monthly cash flow is $-258 ($-3k/yr) — negative.
- To cash-flow at today's rent, offer at most $260k (12.6% below list).
- To meet the 1% rule (rent ≥ 1% of price), the offer needs to be $237k (20.1% below list).
- Recommended offer: $237k (20.1% below list) — sets the bar for 1% rule.
Location & tenants
- Location reads 58/100 on livability (#1,198 in TX) — a working-class tenant base; expect higher turnover. Strengths: cost of living A+, housing A+, employment B; Watch: schools F, crime D-, amenities F.
- Hays CISD (rural): math 35% / reading 41% proficiency, ranked #390 of 826 in TX (top 47%) — families likely to look elsewhere, expect single-tenant / working-renter base with shorter leases.
- Market conditions: Rents soft (-1.8%/yr); 1002 active listings in the ZIP; 1 comparable units currently listed for rent nearby; high-income renter base; 5,270 units permitted in Hays County in 2024 (1,464 in 5+ unit buildings).
Forward outlook
- Local home prices are declining (-3.0%/yr); year-one equity from $2k of loan paydown is wiped out by about $9k of value loss. Plan a longer hold.
- Hays County population projected at +93% by 2050 — long-run rental-demand tailwind backs the buy-and-hold thesis.
Negotiation context
- It's been on market 15 days — a 2% lower offer ($293k) is reasonable based on typical stale-listing flexibility.
- 2 sale attempts with the ask held roughly flat each time — persistent listings suggest the price (not the market) is what's stuck; bring a comps-based counter.
Questions for the listing agent
- What do current leases actually rent for vs. the listed asking? Can we see a recent rent roll and the last 12 months of T-12 income?
- What does the HOA fee cover, when was the last increase, and are there any pending special assessments or reserve-fund shortfalls?
- Is there a deadline driving the sale (1031 exchange, divorce, estate, relocation)? That informs how much negotiation room exists.
- Schools are F-rated, which usually means shorter tenancies and higher turnover. Who's the typical renter profile here, and what's been the actual vacancy rate?
- Crime grade is D in this area — have there been break-ins, vandalism, or insurance claims at this property in the last 3 years? What carrier currently insures it and at what premium?
- The area grade is low — what's the realistic commute time and amenity access for the typical tenant pool here? Any planned neighborhood developments (good or bad) we should know about?
- What's the average days-on-market for RENTAL listings here right now (not sales)? A rising rental-DOM trend means longer vacancies and softer asking-rent achievability than the comps imply.
- What's the recent tenant-quality profile in this submarket — average credit score on applications, eviction rate, late-payment / NSF rate, and stable-employment percentage? A property-management company in the area should have these aggregated.
- How much new for-sale + rental construction is in the pipeline within 1–3 miles? Heavy new supply typically softens prices + rents 12–24 months out; constrained supply supports both.
Investment metrics
- 1% rule
- 0.80% ✗
- Cap rate
- 5.25%
- Cash-on-cash
- -3.72%
- DSCR
- 0.83
- GRM
- 10.4
CMA / ARV
- ARV (median comp)
- $336,858
- List price
- $297,035
- Delta
- -13.59%
- Verdict
- UNDERPRICED
- Comps
- 20 within 1.0 mi
Show comp detail 12 sales within ~0.75 mi
| Address | Dist | Beds/Ba | Sqft | Sold | Price | $/sf | Match |
|---|---|---|---|---|---|---|---|
| 224 Garcia St | 0.20mi | 5/2.5 | 1,892 (-2%) | 1mo | $303,118 | $160 | 84 |
| 188 Garcia St | 0.23mi | 5/2.5 | 1,892 (-2%) | 3mo | $286,990 | $152 | 81 |
| 470 Bull Lake Cir | 0.27mi | 5/2.5 | 1,892 (-2%) | 1mo | $290,990 | $154 | 80 |
| 411 Mustang Lake Cir | 0.09mi | 4/2.5 (-1) | 2,042 (+5%) | 4mo | $339,990 | $166 | 77 |
| 435 Mustang Lake Cir | 0.07mi | 4/2.5 (-1) | 2,107 (+9%) | 4mo | $344,990 | $164 | 72 |
| 395 Mustang Lake Cir | 0.11mi | 4/2.0 (-1) | 1,778 (-8%) | 3mo | $319,990 | $180 | 70 |
| 236 Gilmer Ln | 0.18mi | 4/2.0 (-1) | 1,796 (-7%) | 1mo | $332,640 | $185 | 70 |
| 276 Mustang Lake Cir | 0.19mi | 4/3.5 (-1) | 2,107 (+9%) | 1mo | $339,990 | $161 | 69 |
| 280 Mustang Lake Cir | 0.18mi | 4/2.0 (-1) | 1,780 (-8%) | 2mo | $326,990 | $184 | 68 |
| 168 Juan Cordona Dr | 0.30mi | 4/2.5 (-1) | 2,042 (+5%) | 4mo | $339,990 | $166 | 67 |
| 244 Gilmer Ln | 0.18mi | 4/2.0 (-1) | 1,659 (-14%) | 2mo | $318,990 | $192 | 57 |
| 119 Juan Cordona Dr | 0.19mi | 4/2.0 (-1) | 1,680 (-13%) | 4mo | $314,990 | $187 | 57 |
Match score weights: distance 35% · size 25% · config 20% · recency 20%. Top-matched comps best support the ARV.
Projected returns pro-forma
-3.0% appreciation · 0.0% rent growth · sell at horizon
- IRR
- -26.1%
- Equity multiple
- 0.14×
- Total profit
- $-71,432
- Equity at exit
- $44,289
- IRR
- -37.7%
- Equity multiple
- -0.32×
- Total profit
- $-109,890
- Equity at exit
- $25,682
Cash invested: $83,170 (down + closing). Projections, not guarantees.
Landlord ↔ Tenant lean methodology
- Overall (STATE)
- 87 Strongly Landlord-Friendly
- State Texas
- 87 Strongly Landlord-Friendly · R+5
- County
- — inherits STATE
- City
- — inherits STATE
ZIP-level market 78610
- Rents YoY
- -1.8%
- Active inventory
- 1002
- Price-to-rent
- 10.4×
Monthly cashflow live
- Estimated rent
- $2,373 medium interval (Pro) →
- Mortgage (P&I)
- −$1,558
- Tax est. 1.5%
- −$371 /mo · $4,456/yr
- Insurance
- −$124
- HOA
- −$80
- Vacancy / Maint / Mgmt
- −$498
- Net cashflow
- $-258
Break-even live
UW: 25.0% down · 7.5% · 30yr · 1.5% tax · 5.0% vac · 8.0% maint · 8.0% mgmt
Financing live
Cash to close
- Down payment
- $74,259
- Closing costs
- $8,911
- Reserves months
- —
- Total cash needed
- —
Loan-product check · same deal, 3 products live
Conventional
25% down · 7.5% · 30yr
- Down + closing
- —
- Monthly P&I
- —
- Monthly cashflow
- —
- DSCR
- —
- Eligible?
- —
Personal DTI + credit; lowest rate.
DSCR
20% down · 8.5% · 30yr
- Down + closing
- —
- Monthly P&I
- —
- Monthly cashflow
- —
- DSCR
- —
- Eligible?
- —
No personal income docs; deal must DSCR.
Hard money
10% down · 12.0% · 12mo
- Down + closing
- —
- Monthly P&I
- —
- Monthly cashflow
- —
- DSCR
- —
- Eligible?
- —
Short-term bridge; refi at stabilization.
Rent comps 1 comps
| Address | Beds | Baths | Sqft | Rent | $/sqft | DOM | Units | Dist |
|---|---|---|---|---|---|---|---|---|
| 143 Santa Teresa Rd Kyle, TX | 4.0 | 2.5 | 2042 | $2,500 | $1.22 | 43d | 1 | 0.33mi |
HOA detail
- Monthly dues
- $80 · $960/yr
Listing history 10 events
-
2026-06-18days on market $297,035 Active 15 DOM
-
2026-06-17days on market $297,035 Active 14 DOM
-
2026-06-16days on market $297,035 Active 13 DOM
-
2026-06-15days on market $297,035 Active 12 DOM
-
2026-06-13days on market $297,035 Active 10 DOM
-
2026-06-09days on market $297,035 Active 6 DOM
-
2026-06-08days on market $297,035 Active 5 DOM
-
2026-06-07days on market $297,035 Active 4 DOM
-
2026-06-05pricestatus $297,035 Active 1 DOM
-
2026-05-07Active
ⓘ Source: listings_history table (triggers on properties + properties_extension) + one-shot
backfill from property_details.listing_events for pre-trigger history.
Nearby sold comps map
Loading sold comps map…
Walkable amenities ~0.75 mi
Loading nearby amenities…
Taxation est. · year 1
- Rental income
- $28,478
- − Mortgage interest
- −$16,639
- − Property taxes
- −$4,456
- − Insurance
- −$1,485
- − Repairs & maintenance
- −$2,278
- − Management
- −$2,278
- − HOA
- −$960
- − Depreciation
- −$8,641
- Taxable loss
- −$8,259
- Est. tax savings @ 24.0%
- +$1,982
- After-tax cash flow
- $-1,113/yr
For passive investors: Depreciation is non-cash, so a rental often shows a tax loss while cash-flowing — sheltering income. Rental losses are passive: they offset passive income freely, and up to $25,000/yr can offset ordinary (W-2) income if you actively participate and your MAGI is under $100k (phasing out to $0 by $150k); unused losses carry forward. On sale, claimed depreciation is recaptured at up to 25%, and gains may owe capital-gains tax (a 1031 exchange can defer both). Figures are a year-1 estimate at your 24.0% rate — not tax advice; consult a CPA.
Condition & rehab AI · 12 photos
This move-in ready home in Buda, TX, offers a Pearl floorplan with 1,938 square feet of living space across 5 bedrooms and 2.5 bathrooms. The home is in good condition with no major repairs needed, and has potential for value-adding updates to increase its resale and rental appeal.
Value-add opportunities
- Both Paint interior walls — Fresh paint can enhance curb appeal and interior aesthetics
- Both Replace carpet with hardwood or tile — Hardwood or tile flooring can increase both resale and rental value
- Both Install smart home features — Smart home features can increase both resale and rental value by making the home more modern and convenient
Renovation cost estimate screening
Value-add ROI direction
- Both Paint interior walls — Fresh paint can enhance curb appeal and interior aesthetics ↑
- Both Replace carpet with hardwood or tile — Hardwood or tile flooring can increase both resale and rental value ↑
- Both Install smart home features — Smart home features can increase both resale and rental value by making the home more modern and convenient ↑
ⓘ Cost ranges are severity-bucket heuristics (US national rule-of-thumb). Get contractor quotes + a written scope before underwriting a rehab budget.
Schools (NCES district)
- District
- Hays CISD
- NCES district ID
- 4800010
- Math proficiency
- 35% ▼ -15.00%
- Reading proficiency
- 41% ▼ -5.00%
- Median HH income
- $70,570
- Composite
- 34.78/100
- National rank
- #5118
- State rank
- #390 of 826 in TX
Livability — Niederwald
- Score
- 58/100
- State rank
- #1198
- US rank
- #20995
Category grades
Schools grade is shown separately in the Schools card above.
Census & demographics
- County
- Hays County · 280,138 people
- Metro
- Austin-Round Rock-Georgetown, TX
- Population (ZIP)
- 48,319
- Household income
- $119,698
- Rent vs Own
- Severe rent burden
- 611.0
Population outlook (Hays County) Hauer SSP2
- Today (2025)
- 286,948 people
- By 2030
- 336,923 · +17.4%
- By 2040
- 441,894 · +54.0%
- By 2050
- 553,462 · +92.9%
- By 2075
- 838,261 · +192.1%
- By 2100
- 1,063,658 · +270.7%
Race, ethnicity, and origin ACS 2023
- Neighborhood character
- Diverse neighborhood (Simpson 0.58)
- Race & ethnicity
- White 49% Hispanic / Latino 42% Two or more races 17% Black 4% Asian 2%
- Hispanic origin (detail)
- Mexican 35%
- Common ancestry
- Italian 2% Romanian 2% Lithuanian 2%
- Foreign-born
- 10% · Canada, Jamaica, South Korea
- Languages at home
- 76% English-only · Spanish 20% Arabic 2% Other Indo-European 1%
Political lean MEDSL · Hays
- 2024 margin
- Lean D (+5.7) · D 52.1% · R 46.5% · Other 1.4%
- 2008→2024 swing
- +7.7pp toward D · 2008: -2.0pp · 2024: 5.7pp
- All cycles
- 2024: D+5.7 2020: D+10.8 2016: R+0.9 2012: R+10.4 2008: R+2.0
Not yet ingested
- Civics
- —
Market trends
- HPI YoY
- ▼ -161.50%
- Current HPI
- 220.6824
- Rent YoY
- ▼ -1.80%
- Metro
- Austin-Round Rock-Georgetown, TX
- State GDP YoY
- ▲ 3.95%
- F500 in state
- 110
Industry mix (Fortune 500 HQ in TX)
| Industry | F500 HQs | Revenue |
|---|---|---|
| Energy | 16 | $1,198B |
|
||
| Technology | 5 | $198B |
|
||
| Engineering / Construction | 4 | $72B |
|
||
| Energy Services | 3 | $60B |
|
||
| Utilities | 3 | $41B |
|
||
| Healthcare | 2 | $330B |
|
||
Price history
2 events — show timeline
- 2026-06-03 Listed $297,035 Unlock MLS
- 2026-05-07 Listed — Unlock MLS
Cash-flow waterfall
monthlySold comps — $/sqft
last 12 mo · ≤1 miLoading sold comps…