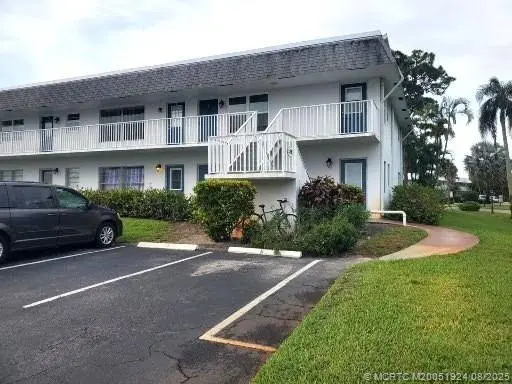
2929 SE Ocean Blvd Unit 128-7 · Stuart, FL
Flood risk 5/10 · Moderate
- FEMA flood zone
- X (unshaded)
- Chance of flooding over 30 yrs
- 0.23%
- Est. flood insurance / yr
- $507 – $1,088
Fire risk 1/10 · Minimal
- Est. fire insurance / yr
- $947 – $1,759
Heat risk 10/10 · Severe
- Hot days now (above 106°F)
- 8 days/yr
- Hot days in 30 yrs
- 27 days/yr
Wind risk 10/10 · Severe
- Chance of severe wind over 30 yrs
- 99.0%
Air-quality risk 2/10 · Minimal
- Unhealthy air days now
- 2 days/yr
- Unhealthy air days in 30 yrs
- 2 days/yr
Risk factors via First Street. Map © Google.
Why this score? — see what drove the B- grade
The composite is a weighted blend of 9 inputs, each scored 0–100. Each bar is that input's sub-score; the figure is the points it added to the 100-point composite (weight × sub-score).
- Cash flow +25.8/30.0
- 1% rule +10.0/10.0
- Appreciation +10.0/10.0
- DSCR +8.6/10.0
- Schools +4.5/10.0
- Livability +4.2/5.0
- Rent growth +2.5/5.0
- Condition / age +2.5/5.0
- ARV discount +0.2/15.0
$124,900
🖨 Deal sheet 📄 Offer letter ✓ Due diligence
Listing remarks MLS
Welcome to beautiful Cedar Pointe, a 55 + active community. This unit is a one bedroom with one 1/1/2 bathrooms located on the 2nd floor. Walk into your open layout with spacious kitchen, dining/family room space. The bedroom has an ensuite bath, a walk-in closet and opens into your enclosed lanai. This unit overlooks the green space and pool. Located minutes to the pristine ocean beaches of Hutchinson Island, shopping, restaurants & downtown Stuart.
Key facts
- Walk-in closet
- Spacious kitchen
- Ensuite bath
Tags
Neighborhood map
What this means for you Summary
Snapshot
- This is a 1-bed/1.5-bath condo listed at $125k.
Deal economics
- At list price, monthly cash flow is $304 ($4k/yr) — positive.
- The deal already cash-flows at list — no discount required.
- Meets the 1% rule at list price ($2k rent vs $125k).
- Recommended offer: $110k (12.0% below list) — sets the bar for market timing.
- Cap rate 9.2% vs local median 4.1% in Stuart — top-decile yield for the area; either an underpriced asset or a hidden risk that comps aren't pricing in. Stress-test before assuming the spread holds.
Location & tenants
- Location reads 84/100 on livability (#39 in FL, #790 nationally) — a professional / high-income tenant draw. Strengths: commute A+, housing A+, health & safety A+; Watch: crime C-, employment C-, amenities D.
- Martin (suburban): math 52% / reading 53% proficiency, ranked #24 of 73 in FL (top 33%) — acceptable for families but not a draw, mixed tenant base, ~2y average lease.
- Market conditions: 251 active listings in the ZIP; 3 comparable units currently listed for rent nearby; rentals at typical pace (median 14d on market — plan ~3-4 weeks tenant-placement turnaround); solid renter incomes; 737 units permitted in Martin County in 2024 (167 in 5+ unit buildings).
Forward outlook
- In year one you build about $13k of equity ($864 loan paydown + $12k appreciation (10.0% local appreciation)).
- Martin County population projected at +19% by 2050 — long-run rental-demand tailwind backs the buy-and-hold thesis.
- At projected returns (10.0% appreciation + 3.0% rent growth), your $35k cash investment doubles in ~2 years — after that, you're playing with house money.
- By year 3, paydown + projected appreciation supports a ~$34k cash-out refi (75% LTV) — recoverable capital for the next deal without selling this one.
Negotiation context
- It's been on market 296 days — a 12% lower offer ($110k) is reasonable based on typical stale-listing flexibility.
- 10 sale attempts since 22y ago; this cycle's ask is 7706% above the opening price — seller raised mid-cycle; expect resistance to lowballs.
- Current owner paid $105k; 19% above their basis — modest negotiation headroom, anchor on the comps not their cost.
Risks & watch-outs
- Watch-outs: HOA is 22% of rent.
- Climate carrying-cost: moderate flood risk; severe wind risk, 99% chance of damaging wind over 30y; extreme-heat days projected 8→27/yr by 2055 (HVAC capex compounding) — expect insurance premiums to compound above CPI over the hold.
Questions for the listing agent
- It's been on market 296 days. Have you received any prior offers? Is the seller open to a 12% concession, seller financing, or rate buy-down credit?
- Built in 1972 — when were the roof, HVAC, electrical panel, plumbing, and water heater last replaced?
- What does the HOA fee cover, when was the last increase, and are there any pending special assessments or reserve-fund shortfalls?
- Any open or pending special assessments — roof, HVAC, plumbing, elevator, façade? What's the per-unit balance and payoff schedule, and is the seller paying it off at close or rolling it to the buyer?
- Why hasn't it sold? Are there any deal-killer items the seller is aware of (foundation, flood, title, zoning, code violations)?
- Is there a deadline driving the sale (1031 exchange, divorce, estate, relocation)? That informs how much negotiation room exists.
- Schools are A-rated — typically a magnet for longer-tenancy family renters. What's the average tenant stay here, and is there a school-zone premium baked into asking?
- What's the average days-on-market for RENTAL listings here right now (not sales)? A rising rental-DOM trend means longer vacancies and softer asking-rent achievability than the comps imply.
- What's the recent tenant-quality profile in this submarket — average credit score on applications, eviction rate, late-payment / NSF rate, and stable-employment percentage? A property-management company in the area should have these aggregated.
- How much new apartment / multifamily construction is in the pipeline within 1–3 miles? Heavy new supply (>2% of stock underway) typically softens rents 12–24 months out; light construction supports rent growth.
Investment metrics
- 1% rule
- 1.55% ✓
- Cap rate
- 9.21%
- Cash-on-cash
- 10.42%
- DSCR
- 1.46
- GRM
- 5.4
CMA / ARV
- ARV (median comp)
- $107,380
- List price
- $124,900
- Delta
- 16.32%
- Verdict
- OVERPRICED
- Comps
- 20 within 1.0 mi
Projected returns pro-forma
10.0% appreciation · 3.0% rent growth · sell at horizon
- IRR
- 32.0%
- Equity multiple
- 3.51×
- Total profit
- $87,625
- Equity at exit
- $112,520
- IRR
- 27.7%
- Equity multiple
- 7.96×
- Total profit
- $243,333
- Equity at exit
- $242,653
Cash invested: $34,972 (down + closing). Projections, not guarantees.
Landlord ↔ Tenant lean methodology
- Overall (STATE)
- 87 Strongly Landlord-Friendly
- State Florida
- 87 Strongly Landlord-Friendly · R+3
- County
- — inherits STATE
- City
- — inherits STATE
ZIP-level market 34996
- Home prices YoY
- 2.1%
- Active inventory
- 251
- Price-to-rent
- 5.4×
Monthly cashflow live
- Estimated rent
- $1,941 medium interval (Pro) →
- Mortgage (P&I)
- −$655
- Tax from tax record
- −$105 /mo · $1,260/yr
- Insurance
- −$52
- HOA
- −$418
- Vacancy / Maint / Mgmt
- −$408
- Net cashflow
- $304
Break-even live
UW: 25.0% down · 7.5% · 30yr · 1.5% tax · 5.0% vac · 8.0% maint · 8.0% mgmt
Financing live
Cash to close
- Down payment
- $31,225
- Closing costs
- $3,747
- Reserves months
- —
- Total cash needed
- —
Loan-product check · same deal, 3 products live
Conventional
25% down · 7.5% · 30yr
- Down + closing
- —
- Monthly P&I
- —
- Monthly cashflow
- —
- DSCR
- —
- Eligible?
- —
Personal DTI + credit; lowest rate.
DSCR
20% down · 8.5% · 30yr
- Down + closing
- —
- Monthly P&I
- —
- Monthly cashflow
- —
- DSCR
- —
- Eligible?
- —
No personal income docs; deal must DSCR.
Hard money
10% down · 12.0% · 12mo
- Down + closing
- —
- Monthly P&I
- —
- Monthly cashflow
- —
- DSCR
- —
- Eligible?
- —
Short-term bridge; refi at stabilization.
Rent comps 3 comps
| Address | Beds | Baths | Sqft | Rent | $/sqft | DOM | Units | Dist |
|---|---|---|---|---|---|---|---|---|
| 2929 SE Ocean Blvd Stuart, FL | 1.0–2.0 | 1.0–2.0 | 812 | $1,450 | $1.79 | 14d | 8 | 0.16mi |
| 2929 SE Ocean Blvd Stuart, FL | 1.0–2.0 | 1.0–2.0 | 812 | $1,500 | $1.85 | 23d | 6 | 0.16mi |
| 300 SE Saint Lucie Blvd Stuart, FL | 1.0–3.0 | 1.0–2.0 | 884 | $1,789 | $2.02 | 14d | 12 | 0.22mi |
HOA detail condo
- Monthly dues
- $418 · $5,016/yr
- Likely covers
- pool
- Assessments
- None detected in remarks — confirm with the listing agent.
Listing history 43 events
-
2026-06-18days on market $124,900 Active 296 DOM
-
2026-06-17days on market $124,900 Active 295 DOM
-
2026-06-16days on market $124,900 Active 294 DOM
-
2026-06-15days on market $124,900 Active 293 DOM
-
2026-06-14days on market $124,900 Active 291 DOM
-
2026-06-13days on market $124,900 Active 290 DOM
-
2026-06-10days on market $124,900 Active 288 DOM
-
2026-06-09days on market $124,900 Active 287 DOM
-
2026-06-08days on market $124,900 Active 286 DOM
-
2026-06-07days on market $124,900 Active 285 DOM
-
2026-06-03days on market $124,900 Active 281 DOM
-
2026-06-02days on market $124,900 Active 280 DOM
-
2026-06-01days on market $124,900 Active 279 DOM
-
2026-05-31days on market $124,900 Active 278 DOM
-
2026-05-31days on market $124,900 Active 277 DOM
-
2026-03-01historical $1,600
-
2026-02-04$1,600
-
2025-12-09historical $1,600
-
2025-11-05$1,600
-
2025-08-26$124,900 Active 460-char remark
Show marketing remark (460 chars)
Welcome to beautiful Cedar Pointe, a 55 + active community. This unit is a one bedroom with one 1/1/2 bathrooms located on the 2nd floor. Walk into your open layout with spacious kitchen, dining/family room space. The bedroom has an ensuite bath, a walk-in closet and opens into your enclosed lanai. This unit overlooks the green space and pool. Located minutes to the pristine ocean beaches of Hutchinson Island, shopping, restaurants & downtown Stuart.
-
2024-04-12historical $1,600
-
2024-04-04historical $1,600
-
2024-04-03$1,600
-
2024-03-29historical $1,600
-
2024-03-27$1,600
-
2024-03-18$1,600
-
2024-03-08historical $1,600
-
2024-02-22price $1,600
-
2024-02-13$1,800
-
2023-12-07historical $1,650
-
2023-11-29price $1,650
-
2023-11-06$1,400
-
2022-05-09price $1,400
-
2007-02-26soldstatus $105,000
-
2005-06-08soldstatus $105,000
-
2005-06-06soldstatus $105,000 24-char remark
Show marketing remark (24 chars)
MUST SEE !!! LIKE NEW!!!
-
2005-06-06price $110,000 24-char remark
Show marketing remark (24 chars)
MUST SEE !!! LIKE NEW!!!
-
2005-04-04$105,000 24-char remark
Show marketing remark (24 chars)
MUST SEE !!! LIKE NEW!!!
-
2005-03-09soldstatus $96,000
-
2005-03-07price $99,900
-
2005-03-07soldstatus $96,000
-
2004-11-10$96,000
-
1996-05-16soldstatus $32,500
ⓘ Source: listings_history table (triggers on properties + properties_extension) + one-shot
backfill from property_details.listing_events for pre-trigger history.
Tax reassessment forecast FL · Resets to sale price
- Current annual tax
- $1,260 · $105/mo
- Projected year-2 tax
- $1,260 · $105/mo
- Expected delta
- $0/yr ($0/mo · 0.0%)
ⓘ Screening estimate from a state-policy table — verify with the county assessor before closing.
Climate risk First Street
- Flood 5/10 Major FEMA zone X (unshaded) · 23% chance over 30 yrs
- Wildfire 1/10 Low
- Heat 10/10 Extreme 8 d/yr ≥106°F today · 27 d/yr by 30 yrs out
- Wind 10/10 Extreme 99% chance of damaging wind over 30 yrs
- Air quality 2/10 Low 2 unhealthy d/yr today · 2 by 30 yrs out
Nearby sold comps map
Loading sold comps map…
Walkable amenities ~0.75 mi
Loading nearby amenities…
Taxation est. · year 1
- Rental income
- $23,297
- − Mortgage interest
- −$6,996
- − Property taxes
- −$1,260
- − Insurance
- −$624
- − Repairs & maintenance
- −$1,864
- − Management
- −$1,864
- − HOA
- −$5,016
- − Depreciation
- −$3,633
- Taxable income
- $2,040
- Est. tax owed @ 24.0%
- −$490
- After-tax cash flow
- $3,155/yr
For passive investors: Depreciation is non-cash, so a rental often shows a tax loss while cash-flowing — sheltering income. Rental losses are passive: they offset passive income freely, and up to $25,000/yr can offset ordinary (W-2) income if you actively participate and your MAGI is under $100k (phasing out to $0 by $150k); unused losses carry forward. On sale, claimed depreciation is recaptured at up to 25%, and gains may owe capital-gains tax (a 1031 exchange can defer both). Figures are a year-1 estimate at your 24.0% rate — not tax advice; consult a CPA.
Schools (NCES district)
- District
- Martin
- NCES district ID
- 1201290
- Math proficiency
- 52% ▼ -14.00%
- Reading proficiency
- 53% ▼ -4.00%
- Median HH income
- $52,482
- Composite
- 45.1/100
- National rank
- #2690
- State rank
- #24 of 73 in FL
Livability — Stuart
- Score
- 84/100
- State rank
- #39
- US rank
- #790
Category grades
Schools grade is shown separately in the Schools card above.
Census & demographics
- County
- Martin County · 165,223 people
- City population
- 65,812
- Metro
- Port St. Lucie, FL
- Population (ZIP)
- 10,653
- Household income
- $83,929
- Rent vs Own
- Severe rent burden
- 247.0
Population outlook (Martin County) Hauer SSP2
- Today (2025)
- 172,383 people
- By 2030
- 180,192 · +4.5%
- By 2040
- 194,114 · +12.6%
- By 2050
- 204,992 · +18.9%
- By 2075
- 229,641 · +33.2%
- By 2100
- 232,146 · +34.7%
Race, ethnicity, and origin ACS 2023
- Neighborhood character
- Predominantly White (90%)
- Race & ethnicity
- White 90% Hispanic / Latino 7% Two or more races 5%
- Hispanic origin (detail)
- Puerto Rican 2%
- Common ancestry
- Italian 3% Romanian 3% Slovak 3%
- Foreign-born
- 6% · Canada
- Languages at home
- 94% English-only · Spanish 3% Other Indo-European 1% French/Haitian/Cajun 1%
Political lean MEDSL · Martin
- 2024 margin
- Solid R (+31.1) · D 34.1% · R 65.2%
- 2008→2024 swing
- -17.5pp toward R · 2008: -13.6pp · 2024: -31.1pp
- All cycles
- 2024: R+31.1 2020: R+24.6 2016: R+26.9 2012: R+22.9 2008: R+13.6
Not yet ingested
- Civics
- —
Market trends
- HPI YoY
- ▲ 13.71%
- Current HPI
- 658.96
- Rent YoY
- —
- Metro
- Port St. Lucie, FL
- State GDP YoY
- ▲ 3.28%
- F500 in state
- 36
Industry mix (Fortune 500 HQ in FL)
| Industry | F500 HQs | Revenue |
|---|---|---|
| Industrial Technology | 2 | $29B |
|
||
| Insurance | 2 | $17B |
|
||
| Retail | 1 | $60B |
|
||
| Technology Distribution | 1 | $58B |
|
||
| Homebuilding | 1 | $35B |
|
||
| Technology Manufacturing | 1 | $35B |
|
||
Price history
-95.1% since first listed28 events — show timeline
- 2026-03-01 Rental Removed $1,600 MCRTC
- 2026-02-04 Listed for Rent $1,600 MCRTC
- 2025-12-09 Rental Removed $1,600 MCRTC
- 2025-11-05 Listed for Rent $1,600 MCRTC
- 2025-08-26 Listed $124,900 MCRTC
- 2024-04-12 Rental Removed $1,600 RENT.
- 2024-04-04 Rental Removed $1,600 MCRTC
- 2024-04-03 Listed for Rent $1,600 MCRTC
- 2024-03-29 Rental Removed $1,600 MCRTC
- 2024-03-27 Listed for Rent $1,600 MCRTC
- 2024-03-18 Listed for Rent $1,600 RENT.
- 2024-03-08 Rental Removed $1,600 MCRTC
- 2024-02-22 Price Changed $1,600 MCRTC
- 2024-02-13 Listed for Rent $1,800 MCRTC
- 2023-12-07 Rental Removed $1,650 RENT.
- 2023-11-29 Price Changed $1,650 RENT.
- 2023-11-06 Listed for Rent $1,400 RENT.
- 2022-05-09 Price Changed $1,400 RENT.
- 2007-02-26 Sold (Public Records) $105,000 Public Records
- 2005-06-08 Sold (Public Records) $105,000 Public Records
- 2005-06-06 Price Changed $110,000 MCRTC
- 2005-06-06 Sold (MLS) $105,000 MCRTC
- 2005-04-04 Listed $105,000 MCRTC
- 2005-03-09 Sold (Public Records) $96,000 Public Records
- 2005-03-07 Sold (MLS) $96,000 MCRTC
- 2005-03-07 Price Changed $99,900 MCRTC
- 2004-11-10 Listed $96,000 MCRTC
- 1996-05-16 Sold (Public Records) $32,500 Public Records
Property tax history
+9.9%/yrLatest (2025): $1,260 · +0.9% YoY. Source: county tax records.
Cash-flow waterfall
monthlySold comps — $/sqft
last 12 mo · ≤1 miLoading sold comps…