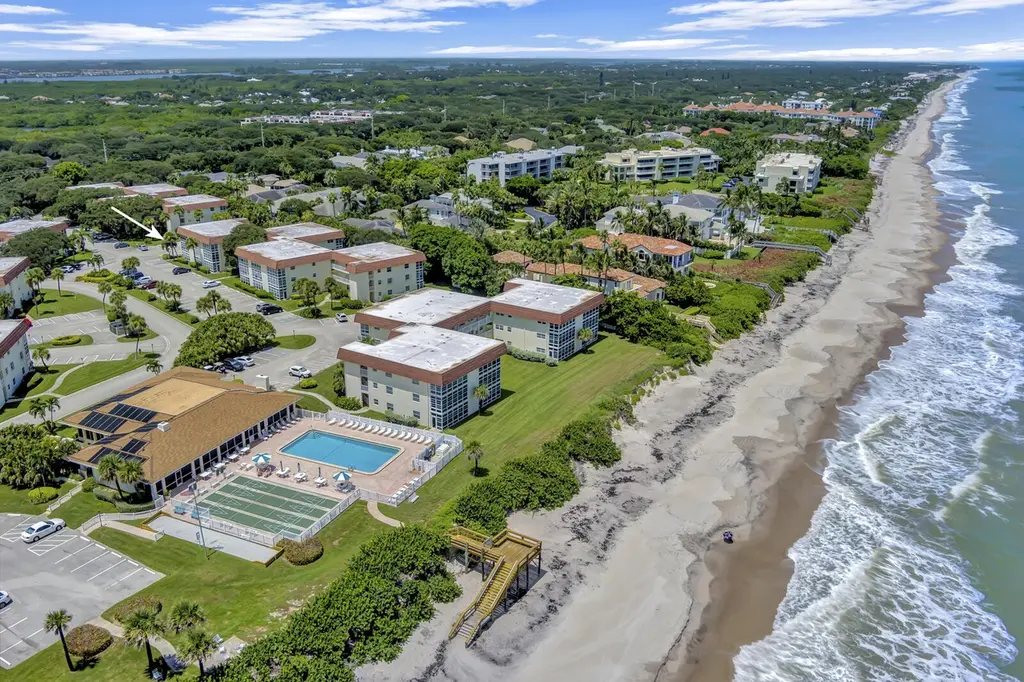
5400 Jimmy Buffett Mem Hwy Unit B 22 · Indian River Shores, FL
Flood risk 6/10 · Moderate
- FEMA flood zone
- X (unshaded)
- Chance of flooding over 30 yrs
- 0.55%
- Est. flood insurance / yr
- $507 – $1,088
Fire risk 1/10 · Minimal
- Est. fire insurance / yr
- $947 – $1,759
Heat risk 10/10 · Severe
- Hot days now (above 105°F)
- 7 days/yr
- Hot days in 30 yrs
- 25 days/yr
Wind risk 10/10 · Severe
- Chance of severe wind over 30 yrs
- 99.0%
Air-quality risk 1/10 · Minimal
- Unhealthy air days now
- 0 days/yr
- Unhealthy air days in 30 yrs
- 0 days/yr
Risk factors via First Street. Map © Google.
Why this score? — see what drove the C- grade
The composite is a weighted blend of 9 inputs, each scored 0–100. Each bar is that input's sub-score; the figure is the points it added to the 100-point composite (weight × sub-score).
- Cash flow +17.1/30.0
- ARV discount +7.5/15.0
- 1% rule +6.6/10.0
- DSCR +5.3/10.0
- Rent growth +5.0/5.0
- Condition / age +4.8/5.0
- Schools +4.2/10.0
- Livability +3.4/5.0
- Appreciation +0.0/10.0
$309,000
🖨 Deal sheet (PDF) 📄 Offer letter ✓ Due diligence
Listing remarks
Incredible home awaits you. BEACHSIDE BEAUTY! 55 plus simple living without sacrifice, this one is over the moon! A definitive cut above the rest. A superior home awaits a new owner. This property sports over $100,000 in amazing upgrades that you will benefit from. With special millwork, crown & shiplap, Impact windows, crafted doors, custom closets, expanded floorplan open to Florida room, new high end lux floors, freshly painted, stunning bathrooms & more! Upgraded countertops, farmers sink, shaker style, softclose kitchen cabinets with under cabinet & decorative lighting, the list goes on! High end living with quality upgrades of over $100,000 added to enjoy without pay
Key facts
- Upgraded countertops
- Farmers sink
- Florida room
Tags
Property features AI
Finance
- Other: No land lease; Pets not allowed
- HOA & community: Delmar association; Monthly HOA fee covers cable TV, insurance, grounds and structure maintenance, sewer, trash, water, common areas, elevator, reserve funds, roof repairs, and recreation facilities; Community amenities include beach access, clubhouse, elevators, game room, pool (heated), spa/hot tub (in-ground, heated), shuffleboard court, maintained community, street lights, and recreation facilities; Community of about 150 units; Senior community
Exterior
- Parking: Assigned parking on asphalt; Four open parking spaces (total 4 parking spaces)
- Security: Building security; Fire sprinkler system; Security patrol; Smoke detectors
- Utilities: Public water; Public sewer; 200+ amp electric service; Cable, electricity, sewer and water connected
- Home design: Condominium, one story; Resale, updated/remodeled; Accessible elevator installed; Visitable; Faces south; Entry level: 3
- Construction: Block/brick/CBS/concrete block with stucco construction; Second/third floor concrete elements; Built-up, shingle, and tile roofs; Block and slab foundation; Building B, approximately 1,000 building area; Total stories: 1
- Exterior features: Screened porch and enclosed glass porch; Porch; Storage structure; Fenced (other); Corner and interior lot with many trees and landscaping; Deeded beach access and ocean access; Private road frontage (east of US-1); Public maintained asphalt road
Interior
- Kitchen: Dishwasher; Electric range; Microwave; Refrigerator; Garbage disposal; Electric water heater (owned)
- Bedrooms: One main-level bedroom
- Flooring: Ceramic tile; Tile; Vinyl
- Bathrooms: One full bathroom; One half bathroom (total 2 bathrooms)
- Heating & cooling: Central individual heating; Central individual cooling; Ceiling fan(s)
- Interior features: Built-in features; Walk-in closet(s); Closet cabinetry; Blinds, insulated and storm windows, shutters; Negotiable furnished status
- Laundry & utility: Common area laundry room with multiple locations, outside access
Neighborhood map
What this means for you Summary
Snapshot
- This is a 1-bed/1.5-bath condo listed at $309k. Condition is rated excellent.
Deal economics
- At list price, monthly cash flow is $213 ($3k/yr) — positive.
- The deal already cash-flows at list — no discount required.
- Meets the 1% rule at list price ($4k rent vs $309k).
- Recommended offer: $304k (1.5% below list) — sets the bar for market timing.
- Cap rate 7.1% vs local median 1.5% in Indian River Shores — top-decile yield for the area; either an underpriced asset or a hidden risk that comps aren't pricing in. Stress-test before assuming the spread holds.
Location & tenants
- Location reads 68/100 on livability (#517 in FL) — a middle-class / working-renter tenant base. Strengths: crime A+, employment A+, housing A-; Watch: amenities F, commute F, cost of living F.
- Indian River (other): math 48% / reading 52% proficiency, ranked #35 of 73 in FL (top 48%) — acceptable for families but not a draw, mixed tenant base, ~2y average lease.
- Zoned schools: Beachland Elementary School (math 54% / reading 58%, grade C+, #832 of 2,144 statewide, top 40%, 523 students, 39% FRL); Gifford Middle School (math 46% / reading 45%, grade D+, #305 of 571 statewide, top 54%, 582 students, 72% FRL); Vero Beach High School (math 28% / reading 43%, grade F, #367 of 667 statewide, top 57%, 2,847 students, 50% FRL) — zoned schools at 54% FRL track the district average.
- Market conditions: Rents rising fast (+11.0%/yr); 498 active listings in the ZIP; 26 comparable units currently listed for rent nearby; rentals at typical pace (median 22d on market — plan ~3-4 weeks tenant-placement turnaround); high-income renter base; 564 units permitted in Indian River County in 2024 (281 in 5+ unit buildings).
Forward outlook
- Local home prices are declining (-3.0%/yr); year-one equity from $2k of loan paydown is wiped out by about $9k of value loss. Plan a longer hold.
- Indian River County population projected at +18% by 2050 — long-run rental-demand tailwind backs the buy-and-hold thesis.
- At projected returns (-3.0% appreciation + 8.0% rent growth), your $87k cash investment doubles in ~10 years — after that, you're playing with house money.
Negotiation context
- It's been on market 27 days — a 2% lower offer ($304k) is reasonable based on typical stale-listing flexibility.
Risks & watch-outs
- Climate carrying-cost: major flood risk; severe wind risk, 99% chance of damaging wind over 30y; extreme-heat days projected 7→25/yr by 2055 (HVAC capex compounding) — expect insurance premiums to compound above CPI over the hold.
Questions for the listing agent
- Built in 1972 — when were the roof, HVAC, electrical panel, plumbing, and water heater last replaced?
- What does the HOA fee cover, when was the last increase, and are there any pending special assessments or reserve-fund shortfalls?
- Any open or pending special assessments — roof, HVAC, plumbing, elevator, façade? What's the per-unit balance and payoff schedule, and is the seller paying it off at close or rolling it to the buyer?
- Is there a deadline driving the sale (1031 exchange, divorce, estate, relocation)? That informs how much negotiation room exists.
- What's the average days-on-market for RENTAL listings here right now (not sales)? A rising rental-DOM trend means longer vacancies and softer asking-rent achievability than the comps imply.
- What's the recent tenant-quality profile in this submarket — average credit score on applications, eviction rate, late-payment / NSF rate, and stable-employment percentage? A property-management company in the area should have these aggregated.
- How much new apartment / multifamily construction is in the pipeline within 1–3 miles? Heavy new supply (>2% of stock underway) typically softens rents 12–24 months out; light construction supports rent growth.
Investment metrics
- 1% rule
- 1.16% ✓
- Cap rate
- 7.12%
- Cash-on-cash
- 2.96%
- DSCR
- 1.13
- GRM
- 7.2
CMA / ARV
No comps found within radius.
Projected returns pro-forma
-3.0% appreciation · 8.0% rent growth · sell at horizon
- IRR
- -5.0%
- Equity multiple
- 0.80×
- Total profit
- $-17,272
- Equity at exit
- $46,073
- IRR
- 10.5%
- Equity multiple
- 2.04×
- Total profit
- $89,776
- Equity at exit
- $26,717
Cash invested: $86,520 (down + closing). Projections, not guarantees.
Landlord ↔ Tenant lean methodology
- Overall (STATE)
- 87 Strongly Landlord-Friendly
- State Florida
- 87 Strongly Landlord-Friendly · R+3
- County
- — inherits STATE
- City
- — inherits STATE
ZIP-level market 32963
- Rents YoY
- 11.0%
- Active inventory
- 498
- Price-to-rent
- 7.2×
Monthly cashflow live
- Estimated rent
- $3,573 high interval (Pro) →
- Mortgage (P&I)
- −$1,620
- Tax est. 1.5%
- −$386 /mo · $4,635/yr
- Insurance
- −$129
- HOA
- −$474
- Vacancy / Maint / Mgmt
- −$750
- Net cashflow
- $213
Break-even live
Sensitivity live
| Price | -10% $427 | -5% $320 | +0% $213 | +5% $106 | +10% $0 |
|---|---|---|---|---|---|
| Rent | -10% $-69 | -5% $72 | +0% $213 | +5% $354 | +10% $495 |
| Rate | -1.0pp $369 | -0.5pp $292 | base $213 | +0.5pp $133 | +1.0pp $52 |
UW: 25.0% down · 7.5% · 30yr · 1.5% tax · 5.0% vac · 8.0% maint · 8.0% mgmt
Financing live
Cash to close
- Down payment
- $77,250
- Closing costs
- $9,270
- Reserves months
- —
- Total cash needed
- —
Loan-product check · same deal, 3 products live
Conventional
25% down · 7.5% · 30yr
- Down + closing
- —
- Monthly P&I
- —
- Monthly cashflow
- —
- DSCR
- —
- Eligible?
- —
Personal DTI + credit; lowest rate.
DSCR
20% down · 8.5% · 30yr
- Down + closing
- —
- Monthly P&I
- —
- Monthly cashflow
- —
- DSCR
- —
- Eligible?
- —
No personal income docs; deal must DSCR.
Hard money
10% down · 12.0% · 12mo
- Down + closing
- —
- Monthly P&I
- —
- Monthly cashflow
- —
- DSCR
- —
- Eligible?
- —
Short-term bridge; refi at stabilization.
Rent comps 26 comps
| Address | Beds | Baths | Sqft | Rent | $/sqft | DOM | Units | Dist |
|---|---|---|---|---|---|---|---|---|
| 5400 Jimmy Buffett Memorial Hwy Unit 5400A11 Indian River Shores, FL | 1.0 | 2.0 | 1000 | $2,500 | $2.50 | 22d | 1 | 0.02mi |
| 5400 Jimmy Buffett Memorial Hwy Unit B8 Indian River Shores, FL | 1.0 | 1.5 | 1000 | $1,650 | $1.65 | 14d | 1 | 0.02mi |
| 5400 Jimmy Buffett Memorial Hwy Unit I24 Indian River Shores, FL | 1.0 | 1.5 | 1000 | $1,650 | $1.65 | 22d | 1 | 0.02mi |
| 5400 Jimmy Buffett Memorial Hwy Indian River Shores, FL | 2.0 | 2.0 | 1200 | $1,800 | $1.50 | 22d | 1 | 0.06mi |
| 5400 Jimmy Buffett Memorial Hwy Unit A19 Indian River Shores, FL | 1.0 | 1.5 | 900 | $3,000 | $3.33 | 22d | 1 | 0.06mi |
| 5300 Jimmy Buffett Memorial Hwy #301 Indian River Shores, FL | 2.0 | 2.0 | 1300 | $7,000 | $5.38 | 22d | 1 | 0.13mi |
| 5300 Jimmy Buffett Memorial Hwy Unit 408 Indian River Shores, FL | 2.0 | 2.0 | 1300 | $9,000 | $6.92 | 22d | 1 | 0.14mi |
| 5300 Jimmy Buffett Memorial Hwy Unit 305 Indian River Shores, FL | 2.0 | 2.0 | 1300 | $6,000 | $4.62 | 22d | 1 | 0.14mi |
| 5300 Jimmy Buffett Memorial Hwy Unit 214 Indian River Shores, FL | 2.0 | 2.0 | 1300 | $5,500 | $4.23 | 22d | 1 | 0.14mi |
| 5300 Jimmy Buffett Memorial Hwy Unit 314 Indian River Shores, FL | 2.0 | 2.0 | 1300 | $3,000 | $2.31 | 22d | 1 | 0.14mi |
| 837 Seminole Ln Vero Beach, FL | 2.0 | 2.0 | 860 | $2,800 | $3.26 | 14d | 1 | 0.21mi |
| 5151 Jimmy Buffett Memorial Hwy Unit 514 Indian River Shores, FL | 1.0 | 1.0 | 937 | $1,750 | $1.87 | 22d | 1 | 0.29mi |
| 5151 Jimmy Buffett Memorial Hwy Unit 512 Indian River Shores, FL | 2.0 | 2.0 | 1339 | $4,600 | $3.44 | 22d | 1 | 0.29mi |
| 5151 Jimmy Buffett Memorial Hwy Unit 305 Indian River Shores, FL | 2.0 | 2.0 | 1339 | $2,300 | $1.72 | 22d | 1 | 0.29mi |
| 5151 Jimmy Buffett Memorial Hwy Unit 516 Indian River Shores, FL | 1.0 | 1.5 | 937 | $3,000 | $3.20 | 22d | 1 | 0.30mi |
| 5100 Jimmy Buffett Memorial Hwy Unit 58G INDN RIV SHRS, FL | 2.0 | 2.0 | 1170 | $6,000 | $5.13 | 22d | 1 | 0.52mi |
| 4890 Bethel Creek Dr #5 Vero Beach, FL | 2.0 | 2.5 | 1244 | $2,200 | $1.77 | 22d | 1 | 0.93mi |
| 4834 Bethel Creek Dr Vero Beach, FL | 2.0 | 2.5 | 1500 | $2,900 | $1.93 | 22d | 1 | 0.96mi |
| 4601 Highway A1A #202 Vero Beach, FL | 2.0 | 2.0 | 1440 | $3,250 | $2.26 | 22d | 1 | 1.12mi |
| 4600 Highway A1A #507 Vero Beach, FL | 2.0 | 2.0 | 1400 | $5,000 | $3.57 | 22d | 1 | 1.15mi |
| 4450 Highway A1A #303 Vero Beach, FL | 2.0 | 2.0 | 1080 | $3,500 | $3.24 | 22d | 1 | 1.20mi |
| 4450 Highway A1A #404 Vero Beach, FL | 2.0 | 2.0 | 1080 | $3,499 | $3.24 | 14d | 1 | 1.20mi |
| 4450 Florida A1A Unit 102 Vero Beach, FL | 2.0 | 2.0 | 1000 | $3,900 | $3.90 | 22d | 1 | 1.20mi |
| 4400 Highway A1A #10 Vero Beach, FL | 2.0 | 2.0 | 800 | $5,500 | $6.88 | 22d | 1 | 1.27mi |
| 4150 Highway A1A #111 Vero Beach, FL | 2.0 | 2.0 | 1300 | $2,600 | $2.00 | 22d | 1 | 1.42mi |
| 4141 Ocean Dr Vero Beach, FL | 2.0–3.0 | 2.0 | 1200 | $3,500 | $2.92 | 14d | 4 | 1.46mi |
HOA detail condo
- Monthly dues
- $474 · $5,688/yr
- Assessments
- None detected in remarks — confirm with the listing agent.
Listing history 17 events
-
2026-06-19days on market $309,000 Active 27 DOM
-
2026-06-18days on market $309,000 Active 26 DOM
-
2026-06-17days on market $309,000 Active 25 DOM
-
2026-06-16days on market $309,000 Active 24 DOM
-
2026-06-15days on market $309,000 Active 23 DOM
-
2026-06-14days on market $309,000 Active 21 DOM
-
2026-06-13days on market $309,000 Active 20 DOM
-
2026-06-10days on market $309,000 Active 18 DOM
-
2026-06-09days on market $309,000 Active 17 DOM
-
2026-06-08days on market $309,000 Active 16 DOM
-
2026-06-07days on market $309,000 Active 15 DOM
-
2026-06-05days on market $309,000 Active 12 DOM
-
2026-06-02days on market $309,000 Active 10 DOM
-
2026-06-01days on market $309,000 Active 9 DOM
-
2026-05-31days on market $309,000 Active 8 DOM
-
2026-05-30days on market $309,000 Active 7 DOM
-
2026-05-22$309,000 Active
ⓘ Source: listings_history table (triggers on properties + properties_extension) + one-shot
backfill from property_details.listing_events for pre-trigger history.
Climate risk First Street
- Flood 6/10 Major FEMA zone X (unshaded) · 55% chance over 30 yrs
- Wildfire 1/10 Low
- Heat 10/10 Extreme 7 d/yr ≥105°F today · 25 d/yr by 30 yrs out
- Wind 10/10 Extreme 99% chance of damaging wind over 30 yrs
- Air quality 1/10 Low 0 unhealthy d/yr today · 0 by 30 yrs out
Nearby sold comps map
Loading sold comps map…
Walkable amenities ~0.75 mi
Loading nearby amenities…
Taxation est. · year 1
- Rental income
- $42,874
- − Mortgage interest
- −$17,309
- − Property taxes
- −$4,635
- − Insurance
- −$1,545
- − Repairs & maintenance
- −$3,430
- − Management
- −$3,430
- − HOA
- −$5,688
- − Depreciation
- −$8,989
- Taxable loss
- −$2,152
- Est. tax savings @ 24.0%
- +$516
- After-tax cash flow
- $3,074/yr
For passive investors: Depreciation is non-cash, so a rental often shows a tax loss while cash-flowing — sheltering income. Rental losses are passive: they offset passive income freely, and up to $25,000/yr can offset ordinary (W-2) income if you actively participate and your MAGI is under $100k (phasing out to $0 by $150k); unused losses carry forward. On sale, claimed depreciation is recaptured at up to 25%, and gains may owe capital-gains tax (a 1031 exchange can defer both). Figures are a year-1 estimate at your 24.0% rate — not tax advice; consult a CPA.
Condition & rehab AI · 30 photos
This stunning beachfront townhouse is move-in ready with modern upgrades and a prime location.
Value-add opportunities
- Both Beachfront location — Enhances both resale and rental value.
- Both Modern kitchen and bathrooms — Improves both resale and rental value.
- Both Landscaping and curb appeal — Enhances both resale and rental value.
- Both Beach access — Enhances both resale and rental value.
Renovation cost estimate screening
Value-add ROI direction
- Both Beachfront location — Enhances both resale and rental value. ↑
- Both Modern kitchen and bathrooms — Improves both resale and rental value. ↑
- Both Landscaping and curb appeal — Enhances both resale and rental value. ↑
- Both Beach access — Enhances both resale and rental value. ↑
ⓘ Cost ranges are severity-bucket heuristics (US national rule-of-thumb). Get contractor quotes + a written scope before underwriting a rehab budget.
Schools (NCES district)
- District
- Indian River
- NCES district ID
- 1200930
- Math proficiency
- 48% ▼ -9.00%
- Reading proficiency
- 52% ▼ -3.00%
- Median HH income
- $46,597
- Composite
- 42.45/100
- National rank
- #3218
- State rank
- #35 of 73 in FL
Livability — Indian River Shores
- Score
- 68/100
- State rank
- #517
- US rank
- #9512
Category grades
Schools grade is shown separately in the Schools card above.
Census & demographics
- Census place
- Indian River Shores, FL
- County
- Indian River County · 143,738 people
- City population
- 15,008
- Metro
- Sebastian-Vero Beach, FL
- Population (ZIP)
- 15,008
- Household income
- $149,923
- Rent vs Own
- Severe rent burden
- 119.0
Population outlook (Indian River County) Hauer SSP2
- Today (2025)
- 165,104 people
- By 2030
- 172,869 · +4.7%
- By 2040
- 185,640 · +12.4%
- By 2050
- 194,465 · +17.8%
- By 2075
- 211,115 · +27.9%
- By 2100
- 211,781 · +28.3%
Race, ethnicity, and origin ACS 2023
- Neighborhood character
- Predominantly White (92%)
- Race & ethnicity
- White 92% Two or more races 5% Hispanic / Latino 4% Asian 2%
- Common ancestry
- Slovak 5% Lithuanian 4% Italian 3%
- Foreign-born
- 9% · Canada
- Languages at home
- 92% English-only · Spanish 3% Other Indo-European 1% German/W. Germanic 1%
Political lean MEDSL · Indian River
- 2024 margin
- Strong R (+27.4) · D 36.0% · R 63.4%
- 2008→2024 swing
- -12.5pp toward R · 2008: -14.8pp · 2024: -27.4pp
- All cycles
- 2024: R+27.4 2020: R+21.6 2016: R+24.5 2012: R+22.3 2008: R+14.8
Not yet ingested
- Civics
- —
Market trends
- HPI YoY
- ▼ -180.47%
- Current HPI
- 312.0326
- Rent YoY
- ▲ 11.04%
- Metro
- Sebastian-Vero Beach, FL
- State GDP YoY
- ▲ 3.28%
- F500 in state
- 36
Industry mix (Fortune 500 HQ in FL)
| Industry | F500 HQs | Revenue |
|---|---|---|
| Industrial Technology | 2 | $29B |
|
||
| Insurance | 2 | $17B |
|
||
| Retail | 1 | $60B |
|
||
| Technology Distribution | 1 | $58B |
|
||
| Homebuilding | 1 | $35B |
|
||
| Technology Manufacturing | 1 | $35B |
|
||
Price history
1 event — show timeline
- 2026-05-22 Listed $309,000 Beaches MLS
Cash-flow waterfall
monthlySold comps — $/sqft
last 12 mo · ≤1 miLoading sold comps…