 29-Plex
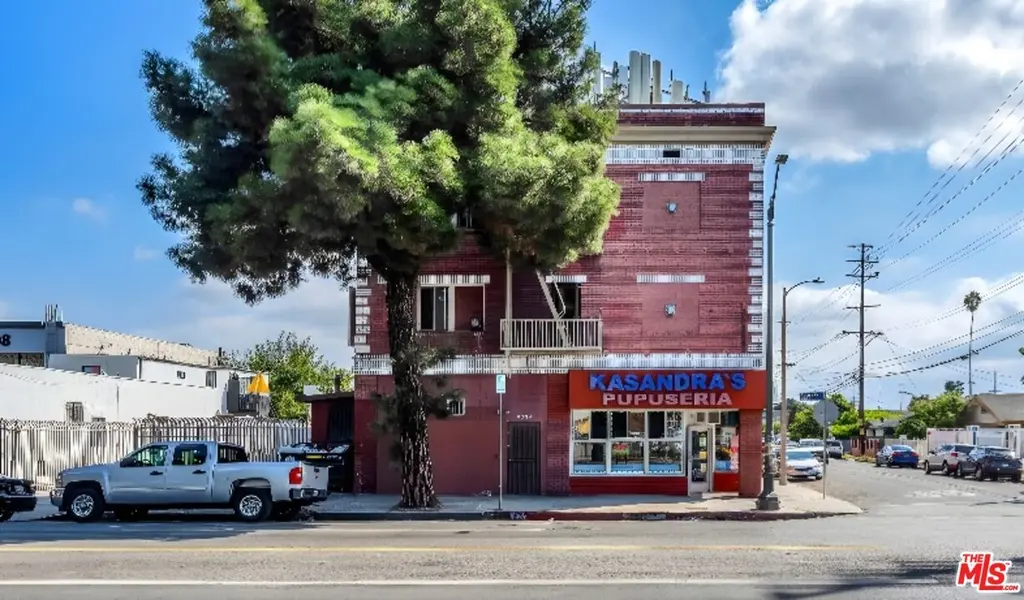
5734 S Broadway · Los Angeles, CA
Flood risk No data
- FEMA flood zone
- —
- Chance of flooding over 30 yrs
- —
- Est. flood insurance / yr
- —
Fire risk No data
- Est. fire insurance / yr
- —
Heat risk No data
- Hot days now (above threshold)
- —
- Hot days in 30 yrs
- —
Wind risk No data
- Chance of severe wind over 30 yrs
- —
Air-quality risk No data
- Unhealthy air days now
- —
- Unhealthy air days in 30 yrs
- —
Risk factors via First Street. Map © Google.
Why this score? — see what drove the C+ grade
The composite is a weighted blend of 9 inputs, each scored 0–100. Each bar is that input's sub-score; the figure is the points it added to the 100-point composite (weight × sub-score).
- Cash flow +30.0/30.0
- 1% rule +10.0/10.0
- DSCR +10.0/10.0
- Schools +3.6/10.0
- Livability +3.4/5.0
- Rent growth +2.9/5.0
- Condition / age +2.5/5.0
- ARV discount +0.0/15.0
- Appreciation +0.0/10.0
$2,195,000
🖨 Deal sheet 📄 Offer letter ✓ Due diligence
Multi-family units
County records classify this as Multi-Family (5+ Unit). Listing-text estimate: 29 units. confirmed
5+ unit building — per-unit beds/baths from public records are typically unavailable; the breakdown below (if shown) is an estimate from the listing text.
Listing remarks MLS
REDUCED! 5734-5736 S Broadway 29-Unit Mixed-Use Building | Major Value-Add Opportunity. Rare opportunity to acquire a three-story, 29-unit mixed-use property located in the rapidly improving South Los Angeles corridor. The ground floor features a built-out restaurant space plus two apartment units. The second floor offers eight self-contained studio units, each with its own kitchen and bathroom, while the third floor includes seventeen efficiency units with shared restrooms. .. An efficient, high-yield mix that generates steady income and strong cash-flow potential. Priced at a crazy low price of $51,724 per unit. Seller has vacated 10 units and they're ready for you to add value and get higher/market rents. Restaurant is month-to-month and, if replaced or renegotiated, should bring in at least twice the current rent of $2,450. UNIT MIX IS AS FOLLOWS: 8 STUDIO/1BTH, 3 1BDR/1BTH, 17 EFCY (studio units on a floor with shared bathrooms) 1 Restaurant- Street Level. With an estimated 30-50% rental upside through property improvements, re-tenanting, and proper management, this asset presents an exceptional value-add opportunity in one of LA's most active and evolving neighborhoods. Prominently positioned along high-visibility S Broadway, the property offers convenient access to Downtown LA, USC, the 110 Freeway, and major transit lines, making it attractive to both residential tenants and commercial operators. Once stabilized, this building should be a cash-cow!
Key facts
- Residential units
- Mixed-use property
- 8,353 sq ft lot
Tags
Neighborhood map
What this means for you Summary
Snapshot
- This is a 29 × 1-bed/3.0-bath units multifamily listed at $2.19M.
Deal economics
- At list price, monthly cash flow is $22k ($263k/yr) — positive. Per door: $755/mo.
- The deal already cash-flows at list — no discount required.
- Meets the 1% rule at list price ($47k rent vs $2.19M).
- Recommended offer: $1.93M (12.0% below list) — sets the bar for market timing.
- Cap rate 18.3% vs local median 2.1% in Los Angeles — top-decile yield for the area; either an underpriced asset or a hidden risk that comps aren't pricing in. Stress-test before assuming the spread holds.
Location & tenants
- Location reads 68/100 on livability (#273 in CA) — a middle-class / working-renter tenant base. Strengths: amenities A+, commute A+, employment B; Watch: health & safety C-, schools D+, crime F.
- Los Angeles Unified (urban): math 29% / reading 54% proficiency, ranked #223 of 517 in CA (top 43%) — families likely to look elsewhere, expect single-tenant / working-renter base with shorter leases; 67% free/reduced lunch — lower-income household profile, screen leases tightly.
- Market conditions: Rents rising (+1.7%/yr); 99 active listings in the ZIP; 19,697 units permitted in Los Angeles County in 2024 (9,426 in 5+ unit buildings).
- At $46,930/mo this rent would consume 977% of the median local household income ($58k/yr) (locally 4200% of renters already pay >50% of income on rent) — very limited rent-growth headroom before tenants either downsize or default.
Forward outlook
- Local home prices are declining (-3.0%/yr); year-one equity from $15k of loan paydown is wiped out by about $66k of value loss. Plan a longer hold.
- Los Angeles County population projected at +9% by 2050 — modest demand growth; plan on rents tracking national, not racing it.
- At projected returns (-3.0% appreciation + 1.7% rent growth), your $615k cash investment doubles in ~3 years — after that, you're playing with house money.
Negotiation context
- It's been on market 230 days — a 12% lower offer ($1.93M) is reasonable based on typical stale-listing flexibility.
- 2 sale attempts since 28y ago; this cycle's ask has dropped $255k (10%) from the opening price — seller is motivated, your offer sets the floor, not the list.
Risks & watch-outs
- Watch-outs: built in 1925 — expect roof / HVAC / electrical / plumbing capex.
Questions for the listing agent
- It's been on market 230 days. Have you received any prior offers? Is the seller open to a 12% concession, seller financing, or rate buy-down credit?
- Can we see the unit-by-unit rent roll, current vacancy, and any below-market leases? What's the average tenancy length?
- What capital expenditures (roof, boiler, parking lot, exteriors) have been made in the last 5 years, and what's planned in the next 2?
- Built in 1925 — when were the roof, HVAC, electrical panel, plumbing, and water heater last replaced?
- Why hasn't it sold? Are there any deal-killer items the seller is aware of (foundation, flood, title, zoning, code violations)?
- Is there a deadline driving the sale (1031 exchange, divorce, estate, relocation)? That informs how much negotiation room exists.
- Schools are D-rated, which usually means shorter tenancies and higher turnover. Who's the typical renter profile here, and what's been the actual vacancy rate?
- Crime grade is F in this area — have there been break-ins, vandalism, or insurance claims at this property in the last 3 years? What carrier currently insures it and at what premium?
- What's the average days-on-market for RENTAL listings here right now (not sales)? A rising rental-DOM trend means longer vacancies and softer asking-rent achievability than the comps imply.
- What's the recent tenant-quality profile in this submarket — average credit score on applications, eviction rate, late-payment / NSF rate, and stable-employment percentage? A property-management company in the area should have these aggregated.
- How much new apartment / multifamily construction is in the pipeline within 1–3 miles? Heavy new supply (>2% of stock underway) typically softens rents 12–24 months out; light construction supports rent growth.
Investment metrics
- 1% rule
- 2.14% ✓
- Cap rate
- 18.27%
- Cash-on-cash
- 42.77%
- DSCR
- 2.90
- GRM
- 3.9
CMA / ARV
- ARV (median comp)
- $1,631,717
- List price
- $2,195,000
- Delta
- 34.52%
- Verdict
- OVERPRICED
- Comps
- 3 within 1.0 mi
Projected returns pro-forma
-3.0% appreciation · 1.69% rent growth · sell at horizon
- IRR
- 38.1%
- Equity multiple
- 2.59×
- Total profit
- $979,135
- Equity at exit
- $327,282
- IRR
- 43.9%
- Equity multiple
- 4.92×
- Total profit
- $2,407,954
- Equity at exit
- $189,783
Cash invested: $614,600 (down + closing). Projections, not guarantees.
Landlord ↔ Tenant lean methodology
- Overall (CITY)
- 0 Strongly Tenant-Friendly
- State California
- 18 Strongly Tenant-Friendly · D+13
- County
- — inherits STATE
- City Los Angeles
- 0 Strongly Tenant-Friendly · D+22
ZIP-level market 90037
- Rents YoY
- 1.7%
- Active inventory
- 99
- Price-to-rent
- 113.0×
Monthly cashflow live
- Estimated rent
- $46,930 high interval (Pro) →
- Mortgage (P&I)
- −$11,511
- Tax est. 1.5%
- −$2,744 /mo · $32,925/yr
- Insurance
- −$915
- HOA
- −$0
- Vacancy / Maint / Mgmt
- −$9,855
- Net cashflow
- $21,906
Break-even live
29-unit breakdown (identical units grouped — click to expand)
| Units | Beds | Baths | Est. rent |
|---|---|---|---|
| 29× units | 1 | 3 | $46,922 |
| #1 | 1 | 3 | $1,618 |
| #2 | 1 | 3 | $1,618 |
| #3 | 1 | 3 | $1,618 |
| #4 | 1 | 3 | $1,618 |
| #5 | 1 | 3 | $1,618 |
| #6 | 1 | 3 | $1,618 |
| #7 | 1 | 3 | $1,618 |
| #8 | 1 | 3 | $1,618 |
| #9 | 1 | 3 | $1,618 |
| #10 | 1 | 3 | $1,618 |
| #11 | 1 | 3 | $1,618 |
| #12 | 1 | 3 | $1,618 |
| #13 | 1 | 3 | $1,618 |
| #14 | 1 | 3 | $1,618 |
| #15 | 1 | 3 | $1,618 |
| #16 | 1 | 3 | $1,618 |
| #17 | 1 | 3 | $1,618 |
| #18 | 1 | 3 | $1,618 |
| #19 | 1 | 3 | $1,618 |
| #20 | 1 | 3 | $1,618 |
| #21 | 1 | 3 | $1,618 |
| #22 | 1 | 3 | $1,618 |
| #23 | 1 | 3 | $1,618 |
| #24 | 1 | 3 | $1,618 |
| #25 | 1 | 3 | $1,618 |
| #26 | 1 | 3 | $1,618 |
| #27 | 1 | 3 | $1,618 |
| #28 | 1 | 3 | $1,618 |
| #29 | 1 | 3 | $1,618 |
| Total (29 units) | $46,930 | ||
UW: 25.0% down · 7.5% · 30yr · 1.5% tax · 5.0% vac · 8.0% maint · 8.0% mgmt
Financing live
Cash to close
- Down payment
- $548,750
- Closing costs
- $65,850
- Reserves months
- —
- Total cash needed
- —
Loan-product check · same deal, 3 products live
Conventional
25% down · 7.5% · 30yr
- Down + closing
- —
- Monthly P&I
- —
- Monthly cashflow
- —
- DSCR
- —
- Eligible?
- —
Personal DTI + credit; lowest rate.
DSCR
20% down · 8.5% · 30yr
- Down + closing
- —
- Monthly P&I
- —
- Monthly cashflow
- —
- DSCR
- —
- Eligible?
- —
No personal income docs; deal must DSCR.
Hard money
10% down · 12.0% · 12mo
- Down + closing
- —
- Monthly P&I
- —
- Monthly cashflow
- —
- DSCR
- —
- Eligible?
- —
Short-term bridge; refi at stabilization.
Listing history 19 events
-
2026-06-18days on market $2,195,000 Active 230 DOM
-
2026-06-17days on market $2,195,000 Active 229 DOM
-
2026-06-16days on market $2,195,000 Active 228 DOM
-
2026-06-15days on market $2,195,000 Active 227 DOM
-
2026-06-13days on market $2,195,000 Active 225 DOM
-
2026-06-10price $2,195,000 Active 221 DOM
-
2026-06-09days on market $1,500,000 Active 221 DOM
-
2026-06-08days on market $1,500,000 Active 220 DOM
-
2026-06-07days on market $1,500,000 Active 219 DOM
-
2026-06-04days on market $1,500,000 Active 216 DOM
-
2026-06-03days on market $1,500,000 Active 215 DOM
-
2026-06-02days on market $1,500,000 Active 214 DOM
-
2026-06-01days on market $1,500,000 Active 213 DOM
-
2026-05-31days on market $1,500,000 Active 212 DOM
-
2026-05-13price $1,500,000 1480-char remark
Show marketing remark (1480 chars)
REDUCED! 5734-5736 S Broadway 29-Unit Mixed-Use Building | Major Value-Add Opportunity. Rare opportunity to acquire a three-story, 29-unit mixed-use property located in the rapidly improving South Los Angeles corridor. The ground floor features a built-out restaurant space plus two apartment units. The second floor offers eight self-contained studio units, each with its own kitchen and bathroom, while the third floor includes seventeen efficiency units with shared restrooms. .. An efficient, high-yield mix that generates steady income and strong cash-flow potential. Priced at a crazy low price of $51,724 per unit. Seller has vacated 10 units and they're ready for you to add value and get higher/market rents. Restaurant is month-to-month and, if replaced or renegotiated, should bring in at least twice the current rent of $2,450. UNIT MIX IS AS FOLLOWS: 8 STUDIO/1BTH, 3 1BDR/1BTH, 17 EFCY (studio units on a floor with shared bathrooms) 1 Restaurant- Street Level. With an estimated 30-50% rental upside through property improvements, re-tenanting, and proper management, this asset presents an exceptional value-add opportunity in one of LA's most active and evolving neighborhoods. Prominently positioned along high-visibility S Broadway, the property offers convenient access to Downtown LA, USC, the 110 Freeway, and major transit lines, making it attractive to both residential tenants and commercial operators. Once stabilized, this building should be a cash-cow!
-
2026-04-01price $2,100,000 1480-char remark
Show marketing remark (1480 chars)
REDUCED! 5734-5736 S Broadway 29-Unit Mixed-Use Building | Major Value-Add Opportunity. Rare opportunity to acquire a three-story, 29-unit mixed-use property located in the rapidly improving South Los Angeles corridor. The ground floor features a built-out restaurant space plus two apartment units. The second floor offers eight self-contained studio units, each with its own kitchen and bathroom, while the third floor includes seventeen efficiency units with shared restrooms. .. An efficient, high-yield mix that generates steady income and strong cash-flow potential. Priced at a crazy low price of $51,724 per unit. Seller has vacated 10 units and they're ready for you to add value and get higher/market rents. Restaurant is month-to-month and, if replaced or renegotiated, should bring in at least twice the current rent of $2,450. UNIT MIX IS AS FOLLOWS: 8 STUDIO/1BTH, 3 1BDR/1BTH, 17 EFCY (studio units on a floor with shared bathrooms) 1 Restaurant- Street Level. With an estimated 30-50% rental upside through property improvements, re-tenanting, and proper management, this asset presents an exceptional value-add opportunity in one of LA's most active and evolving neighborhoods. Prominently positioned along high-visibility S Broadway, the property offers convenient access to Downtown LA, USC, the 110 Freeway, and major transit lines, making it attractive to both residential tenants and commercial operators. Once stabilized, this building should be a cash-cow!
-
2025-10-31$2,450,000 Active 1480-char remark
Show marketing remark (1480 chars)
REDUCED! 5734-5736 S Broadway 29-Unit Mixed-Use Building | Major Value-Add Opportunity. Rare opportunity to acquire a three-story, 29-unit mixed-use property located in the rapidly improving South Los Angeles corridor. The ground floor features a built-out restaurant space plus two apartment units. The second floor offers eight self-contained studio units, each with its own kitchen and bathroom, while the third floor includes seventeen efficiency units with shared restrooms. .. An efficient, high-yield mix that generates steady income and strong cash-flow potential. Priced at a crazy low price of $51,724 per unit. Seller has vacated 10 units and they're ready for you to add value and get higher/market rents. Restaurant is month-to-month and, if replaced or renegotiated, should bring in at least twice the current rent of $2,450. UNIT MIX IS AS FOLLOWS: 8 STUDIO/1BTH, 3 1BDR/1BTH, 17 EFCY (studio units on a floor with shared bathrooms) 1 Restaurant- Street Level. With an estimated 30-50% rental upside through property improvements, re-tenanting, and proper management, this asset presents an exceptional value-add opportunity in one of LA's most active and evolving neighborhoods. Prominently positioned along high-visibility S Broadway, the property offers convenient access to Downtown LA, USC, the 110 Freeway, and major transit lines, making it attractive to both residential tenants and commercial operators. Once stabilized, this building should be a cash-cow!
-
1998-10-11historical
-
1998-07-11
ⓘ Source: listings_history table (triggers on properties + properties_extension) + one-shot
backfill from property_details.listing_events for pre-trigger history.
Nearby sold comps map
Loading sold comps map…
Walkable amenities ~0.75 mi
Loading nearby amenities…
Taxation est. · year 1
- Rental income
- $563,160
- − Mortgage interest
- −$122,954
- − Property taxes
- −$32,925
- − Insurance
- −$10,975
- − Repairs & maintenance
- −$45,053
- − Management
- −$45,053
- − Depreciation
- −$63,855
- Taxable income
- $242,346
- Est. tax owed @ 24.0%
- −$58,163
- After-tax cash flow
- $204,704/yr
For passive investors: Depreciation is non-cash, so a rental often shows a tax loss while cash-flowing — sheltering income. Rental losses are passive: they offset passive income freely, and up to $25,000/yr can offset ordinary (W-2) income if you actively participate and your MAGI is under $100k (phasing out to $0 by $150k); unused losses carry forward. On sale, claimed depreciation is recaptured at up to 25%, and gains may owe capital-gains tax (a 1031 exchange can defer both). Figures are a year-1 estimate at your 24.0% rate — not tax advice; consult a CPA.
Schools (NCES district)
- District
- Los Angeles Unified
- NCES district ID
- 0622710
- Math proficiency
- 29% ▼ -4.00%
- Reading proficiency
- 54% ▲ 10.00%
- Median HH income
- $50,403
- Composite
- 35.67/100
- National rank
- #4875
- State rank
- #223 of 517 in CA
Livability — Los Angeles
- Score
- 68/100
- State rank
- #273
- US rank
- #9237
Category grades
Schools grade is shown separately in the Schools card above.
Census & demographics
- Census place
- Los Angeles, CA
- County
- Los Angeles County · 9,444,647 people
- City population
- 3,838,149
- Metro
- Los Angeles-Long Beach-Anaheim, CA
- Population (ZIP)
- 65,482
- Household income
- $57,622
- Rent vs Own
- Severe rent burden
- 4200.0
Population outlook (Los Angeles County) Hauer SSP2
- Today (2025)
- 10,940,515 people
- By 2030
- 11,256,481 · +2.9%
- By 2040
- 11,729,929 · +7.2%
- By 2050
- 11,948,407 · +9.2%
- By 2075
- 11,818,114 · +8.0%
- By 2100
- 10,842,928 · -0.9%
Race, ethnicity, and origin ACS 2023
- Neighborhood character
- Predominantly Hispanic (80%)
- Race & ethnicity
- Hispanic / Latino 80% Two or more races 15% Black 15% Native American 3% White 2% Asian 1%
- Hispanic origin (detail)
- Mexican 43%
- Common ancestry
- British 1%
- Foreign-born
- 44% · Canada, South Korea
- Languages at home
- 23% English-only · Spanish 74% Korean 1% French/Haitian/Cajun 1%
Political lean MEDSL · Los Angeles
- 2024 margin
- Solid D (+32.9) · D 64.8% · R 31.9% · Other 3.3%
- 2008→2024 swing
- -7.4pp toward R · 2008: 40.4pp · 2024: 32.9pp
- All cycles
- 2024: D+32.9 2020: D+44.2 2016: D+48.0 2012: D+40.0 2008: D+40.4
Not yet ingested
- Civics
- —
Market trends
- HPI YoY
- ▼ -639.09%
- Current HPI
- 467.0371
- Rent YoY
- ▲ 1.69%
- Metro
- Los Angeles-Long Beach-Anaheim, CA
- State GDP YoY
- ▲ 3.21%
- F500 in state
- 116
Industry mix (Fortune 500 HQ in CA)
| Industry | F500 HQs | Revenue |
|---|---|---|
| Technology | 27 | $1,492B |
|
||
| Financial Services | 3 | $174B |
|
||
| Retail | 3 | $44B |
|
||
| Insurance | 3 | $26B |
|
||
| Media / Entertainment | 2 | $115B |
|
||
| Pharmaceuticals / Biotech | 2 | $62B |
|
||
Price history
-38.8% since first listed5 events — show timeline
- 2026-05-13 Price Changed $1,500,000 TheMLS
- 2026-04-01 Price Changed $2,100,000 TheMLS
- 2025-10-31 Listed $2,450,000 TheMLS
- 1998-10-11 Delisted — TheMLS
- 1998-07-11 Listed — TheMLS
Cash-flow waterfall
monthlySold comps — $/sqft
last 12 mo · ≤1 miLoading sold comps…