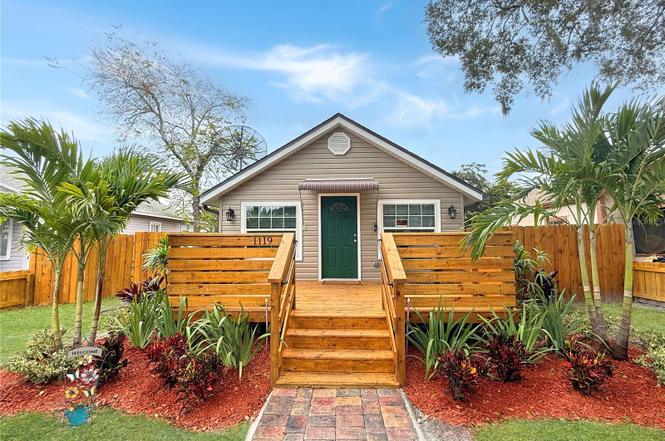
1119 Hickory Ave · Sanford, FL
Flood risk 4/10 · Minor
- FEMA flood zone
- X (unshaded)
- Chance of flooding over 30 yrs
- 0.22%
- Est. flood insurance / yr
- $507 – $1,088
Fire risk 1/10 · Minimal
- Est. fire insurance / yr
- $947 – $1,759
Heat risk 9/10 · Severe
- Hot days now (above 107°F)
- 7 days/yr
- Hot days in 30 yrs
- 22 days/yr
Wind risk 9/10 · Severe
- Chance of severe wind over 30 yrs
- 99.0%
Air-quality risk 2/10 · Minimal
- Unhealthy air days now
- 1 days/yr
- Unhealthy air days in 30 yrs
- 1 days/yr
Risk factors via First Street. Map © Google.
Why this score? — see what drove the C- grade
The composite is a weighted blend of 9 inputs, each scored 0–100. Each bar is that input's sub-score; the figure is the points it added to the 100-point composite (weight × sub-score).
- Cash flow +14.7/30.0
- ARV discount +14.3/15.0
- Schools +5.1/10.0
- DSCR +4.5/10.0
- Livability +3.7/5.0
- 1% rule +3.3/10.0
- Rent growth +2.6/5.0
- Condition / age +2.5/5.0
- Appreciation +0.0/10.0
$269,900
🖨 Deal sheet (PDF) 📄 Offer letter ✓ Due diligence
Listing remarks MLS
Looking for Fixer Upper? Then this 4 bedroom 1 full bath home is the property for you! Located near Down Town Sanford; plenty of restaurants, shopping, parks and so much more! Currently in probate, an extended closing date may be required.
Key facts
- 5,850 sq ft lot
- Built 1937
- Listed 146 days
Property features AI
Finance
- Other: Property zoned MR2; Unfurnished; Total living area about 1,315 square feet
- HOA & community: No HOA association
Exterior
- Utilities: Public water; Public sewer; Public utilities
- Home design: Single Family Residence; One story; Faces west; Residential property
- Construction: Wood siding; Shingle roof; Crawlspace foundation; Built on lot of approximately 0.13 acres (50 x 117)
- Exterior features: Other exterior features; Asphalt road access
Interior
- Kitchen: Range; Refrigerator
- Bedrooms: 4 bedrooms
- Bathrooms: 2 full bathrooms
- Heating & cooling: Central heating; Central air conditioning
- Interior features: Other interior features
- Laundry & utility: Dedicated laundry room
Neighborhood map
What this means for you Summary
Snapshot
- This is a 4-bed/2.0-bath single-family listed at $270k.
Deal economics
- At list price, monthly cash flow is $68 ($811/yr) — positive.
- The deal already cash-flows at list — no discount required.
- To meet the 1% rule (rent ≥ 1% of price), the offer needs to be $224k (17.1% below list).
- Recommended offer: $224k (17.1% below list) — sets the bar for 1% rule.
- Cap rate 6.6% vs local median 3.6% in Sanford — top-decile yield for the area; either an underpriced asset or a hidden risk that comps aren't pricing in. Stress-test before assuming the spread holds.
Location & tenants
- Location reads 73/100 on livability (#316 in FL) — a middle-class / working-renter tenant base. Strengths: cost of living A+, housing A+, health & safety A+; Watch: employment C-, crime F, amenities F.
- Seminole (suburban): math 57% / reading 61% proficiency, ranked #13 of 73 in FL (top 18%) — acceptable for families but not a draw, mixed tenant base, ~2y average lease.
- Zoned schools: Midway Elementary School (math 44% / reading 46%, grade D-, #1,271 of 2,144 statewide, top 60%, 786 students, 86% FRL); Markham Woods Middle School (math 61% / reading 60%, grade B+, #131 of 571 statewide, top 23%, 961 students, 51% FRL); Seminole High School (math 35% / reading 51%, grade F, #255 of 667 statewide, top 39%, 4,036 students, 53% FRL) — zoned schools average 63% FRL vs 38% district-wide (25 pts higher); higher-poverty schools than district average — tighter screening recommended.
- Market conditions: Rents flat; 565 active listings in the ZIP; 24 comparable units currently listed for rent nearby; rentals at typical pace (median 17d on market — plan ~3-4 weeks tenant-placement turnaround); solid renter incomes; 1,979 units permitted in Seminole County in 2024 (1,191 in 5+ unit buildings).
- This rent runs 34% of the median local income ($78k/yr) — at the standard rent-burdened threshold; future hikes will face affordability resistance.
Forward outlook
- Local home prices are declining (-3.0%/yr); year-one equity from $2k of loan paydown is wiped out by about $8k of value loss. Plan a longer hold.
- Seminole County population projected at +24% by 2050 — long-run rental-demand tailwind backs the buy-and-hold thesis.
Negotiation context
- It's been on market 146 days — a 12% lower offer ($238k) is reasonable based on typical stale-listing flexibility.
- 4 sale attempts since 4y ago; this cycle's ask has dropped $100k (27%) from the opening price — seller is motivated, your offer sets the floor, not the list.
- Current owner paid $104k; list at $270k implies a 158% gain — meaningful room to come down on a strong offer.
Risks & watch-outs
- Watch-outs: built in 1937 — expect roof / HVAC / electrical / plumbing capex.
- Climate carrying-cost: severe wind risk, 99% chance of damaging wind over 30y; extreme-heat days projected 7→22/yr by 2055 (HVAC capex compounding) — expect insurance premiums to compound above CPI over the hold.
Questions for the listing agent
- It's been on market 146 days. Have you received any prior offers? Is the seller open to a 17% concession, seller financing, or rate buy-down credit?
- Built in 1937 — when were the roof, HVAC, electrical panel, plumbing, and water heater last replaced?
- Why hasn't it sold? Are there any deal-killer items the seller is aware of (foundation, flood, title, zoning, code violations)?
- Is there a deadline driving the sale (1031 exchange, divorce, estate, relocation)? That informs how much negotiation room exists.
- Schools are B-rated — typically a magnet for longer-tenancy family renters. What's the average tenant stay here, and is there a school-zone premium baked into asking?
- Crime grade is F in this area — have there been break-ins, vandalism, or insurance claims at this property in the last 3 years? What carrier currently insures it and at what premium?
- What's the average days-on-market for RENTAL listings here right now (not sales)? A rising rental-DOM trend means longer vacancies and softer asking-rent achievability than the comps imply.
- What's the recent tenant-quality profile in this submarket — average credit score on applications, eviction rate, late-payment / NSF rate, and stable-employment percentage? A property-management company in the area should have these aggregated.
- How much new for-sale + rental construction is in the pipeline within 1–3 miles? Heavy new supply typically softens prices + rents 12–24 months out; constrained supply supports both.
Investment metrics
- 1% rule
- 0.83% ✗
- Cap rate
- 6.59%
- Cash-on-cash
- 1.07%
- DSCR
- 1.05
- GRM
- 10.1
CMA / ARV
- ARV (on-the-fly)
- $318,230
- Comps found
- 12
Show comp detail 12 sales within ~0.75 mi
| Address | Dist | Beds/Ba | Sqft | Sold | Price | $/sf | Match |
|---|---|---|---|---|---|---|---|
| 1429 Mara Ct | 0.29mi | 4/2.0 | 1,400 (+6%) | 1mo | $306,000 | $219 | 75 |
| 827 Rosalia Dr | 0.42mi | 3/1.5 (-1) | 1,300 (-1%) | 3mo | $305,000 | $235 | 69 |
| 1701 S Palmetto Ave | 0.43mi | 3/2.0 (-1) | 1,248 (-5%) | 1mo | $362,500 | $290 | 65 |
| 718 Willow Ave | 0.30mi | 3/2.0 (-1) | 1,411 (+7%) | 6mo | $345,000 | $245 | 64 |
| 311 W 10th St | 0.56mi | 3/1.0 (-1) | 1,311 (-0%) | 2mo | $355,000 | $271 | 63 |
| 1210 S Palmetto Ave | 0.29mi | 3/1.0 (-1) | 1,426 (+8%) | 4mo | $345,000 | $242 | 60 |
| 1804 S Mellonville Ave | 0.49mi | 4/1.5 | 1,217 (-8%) | 4mo | $289,900 | $238 | 59 |
| 1320 Sanford Ave | 0.25mi | 3/2.0 (-1) | 1,511 (+15%) | 2mo | $415,000 | $275 | 57 |
| 845 E 20th St | 0.56mi | 3/2.0 (-1) | 1,390 (+6%) | 4mo | $293,000 | $211 | 56 |
| 314 W 6th St | 0.69mi | 3/2.0 (-1) | 1,212 (-8%) | 2mo | $345,000 | $285 | 48 |
| 211 S Summerlin Ave | 0.74mi | 3/2.0 (-1) | 1,472 (+12%) | 2mo | $300,000 | $204 | 39 |
| 1920 S Summerlin Ave | 0.74mi | 3/1.0 (-1) | 1,122 (-15%) | 4mo | $257,000 | $229 | 28 |
Match score weights: distance 35% · size 25% · config 20% · recency 20%. Top-matched comps best support the ARV.
Projected returns pro-forma
-3.0% appreciation · 0.38% rent growth · sell at horizon
- IRR
- -17.3%
- Equity multiple
- 0.40×
- Total profit
- $-45,244
- Equity at exit
- $40,243
- IRR
- -14.7%
- Equity multiple
- 0.25×
- Total profit
- $-56,508
- Equity at exit
- $23,336
Cash invested: $75,572 (down + closing). Projections, not guarantees.
Landlord ↔ Tenant lean methodology
- Overall (STATE)
- 87 Strongly Landlord-Friendly
- State Florida
- 87 Strongly Landlord-Friendly · R+3
- County
- — inherits STATE
- City
- — inherits STATE
ZIP-level market 32771
- Rents YoY
- 0.4%
- Active inventory
- 565
- Price-to-rent
- 10.1×
Monthly cashflow live
- Estimated rent
- $2,237 high interval (Pro) →
- Mortgage (P&I)
- −$1,415
- Tax from tax record
- −$172 /mo · $2,064/yr
- Insurance
- −$112
- HOA
- −$0
- Vacancy / Maint / Mgmt
- −$470
- Net cashflow
- $68
Break-even live
Sensitivity live
| Price | -10% $220 | -5% $144 | +0% $68 | +5% $-9 | +10% $-85 |
|---|---|---|---|---|---|
| Rent | -10% $-109 | -5% $-21 | +0% $68 | +5% $156 | +10% $244 |
| Rate | -1.0pp $204 | -0.5pp $136 | base $68 | +0.5pp $-2 | +1.0pp $-73 |
UW: 25.0% down · 7.5% · 30yr · 1.5% tax · 5.0% vac · 8.0% maint · 8.0% mgmt
Financing live
Cash to close
- Down payment
- $67,475
- Closing costs
- $8,097
- Reserves months
- —
- Total cash needed
- —
Loan-product check · same deal, 3 products live
Conventional
25% down · 7.5% · 30yr
- Down + closing
- —
- Monthly P&I
- —
- Monthly cashflow
- —
- DSCR
- —
- Eligible?
- —
Personal DTI + credit; lowest rate.
DSCR
20% down · 8.5% · 30yr
- Down + closing
- —
- Monthly P&I
- —
- Monthly cashflow
- —
- DSCR
- —
- Eligible?
- —
No personal income docs; deal must DSCR.
Hard money
10% down · 12.0% · 12mo
- Down + closing
- —
- Monthly P&I
- —
- Monthly cashflow
- —
- DSCR
- —
- Eligible?
- —
Short-term bridge; refi at stabilization.
Rent comps 24 comps
| Address | Beds | Baths | Sqft | Rent | $/sqft | DOM | Units | Dist |
|---|---|---|---|---|---|---|---|---|
| 700 E 7th St Sanford, FL | 3.0 | 2.0 | 1440 | $2,200 | $1.53 | 0d | 1 | 0.31mi |
| 619 San Lanta Cir Sanford, FL | 3.0 | 2.0 | 1092 | $1,796 | $1.64 | 16d | 1 | 0.33mi |
| 1515 S Elliott St Sanford, FL | 4.0 | 2.0 | 1632 | $2,149 | $1.32 | 16d | 1 | 0.60mi |
| 1218 Crescent St Sanford, FL | 5.0 | 2.0 | 1657 | $3,100 | $1.87 | 25d | 1 | 0.65mi |
| 101 E 21st St Sanford, FL | 3.0 | 2.0 | 896 | $2,500 | $2.79 | 25d | 1 | 0.72mi |
| 2015 Jefferson Ave Sanford, FL | 4.0 | 2.0 | 1600 | $1,995 | $1.25 | 25d | 1 | 0.79mi |
| 129 Oakman Way Sanford, FL | 3.0 | 3.0 | 1649 | $2,249 | $1.36 | 0d | 1 | 0.88mi |
| 129 Oakman Way Unit 1 Sanford, FL | 3.0 | 3.0 | 1652 | $2,349 | $1.42 | 6d | 1 | 0.88mi |
| 129 Oakman Way Unit 1 Sanford, FL | 3.0 | 3.0 | 1652 | $2,349 | $1.42 | 0d | 1 | 0.88mi |
| 1574 Effra Way Sanford, FL | 3.0 | 2.0 | 1429 | $2,270 | $1.59 | 25d | 1 | 0.89mi |
| 131 Langston Dr Sanford, FL | 3.0 | 1.5 | 1082 | $1,697 | $1.57 | 22d | 1 | 0.99mi |
| 1001 W 8th St Unit 1 Sanford, FL | 3.0 | 1.0 | 1075 | $2,250 | $2.09 | 23d | 1 | 1.00mi |
| 253 McKay Blvd Sanford, FL | 4.0 | 2.0 | 1874 | $2,201 | $1.17 | 0d | 1 | 1.00mi |
| 1711 Roseberry Ln Sanford, FL | 3.0 | 2.0 | 984 | $2,150 | $2.18 | 6d | 1 | 1.03mi |
| 2008 William Clark Ave Sanford, FL | 3.0 | 2.0 | 1328 | $2,199 | $1.66 | 4d | 1 | 1.12mi |
| 2406 S Lake Ave Sanford, FL | 3.0 | 2.0 | 1111 | $2,000 | $1.80 | 16d | 1 | 1.27mi |
| 2405 Chase Ave Sanford, FL | 3.0 | 2.0 | 1200 | $2,095 | $1.75 | 16d | 1 | 1.28mi |
| 2420 S Lake Ave Sanford, FL | 3.0 | 1.0 | 1100 | $1,545 | $1.40 | 16d | 1 | 1.33mi |
| 2420 S Lake Ave Unit B Sanford, FL | 3.0 | 1.0 | 1100 | $1,545 | $1.40 | 19d | 1 | 1.33mi |
| 1320 S Oleander Ave Sanford, FL | 3.0 | 2.0 | 1200 | $1,850 | $1.54 | 25d | 1 | 1.35mi |
| 2441 Marshall Ave Sanford, FL | 3.0 | 2.0 | 1462 | $2,235 | $1.53 | 6d | 1 | 1.44mi |
| 107 Garrison Dr Sanford, FL | 3.0 | 2.0 | 1439 | $1,800 | $1.25 | 19d | 1 | 1.45mi |
| 106 Garrison Dr Sanford, FL | 3.0 | 2.0 | 1080 | $1,895 | $1.75 | 6d | 1 | 1.47mi |
| 2420 Daffadil Ter Sanford, FL | 3.0 | 2.0 | 1097 | $1,850 | $1.69 | 19d | 1 | 1.47mi |
Listing history 25 events
-
2026-06-07statusdays on market $269,900 Pending 146 DOM
-
2026-06-04days on market $269,900 Active 144 DOM
-
2026-06-03days on market $269,900 Active 143 DOM
-
2026-06-02days on market $269,900 Active 142 DOM
-
2026-06-02status $269,900 Active 141 DOM
-
2026-05-05status Pending
-
2026-05-02status Active
-
2026-04-07status Pending
-
2026-03-17price $269,900
-
2026-03-05price $279,900
-
2026-02-19price $289,900
-
2026-02-13price $299,900
-
2026-02-09price $309,500
-
2026-01-28price $329,500
-
2026-01-12price $339,500
-
2025-12-29price $349,500
-
2025-12-10price $359,500
-
2025-11-20$369,500 Active
-
2024-02-29soldstatus $104,500
-
2024-02-12soldstatus $104,500 Closed 241-char remark
Show marketing remark (241 chars)
Looking for Fixer Upper? Then this 4 bedroom 1 full bath home is the property for you! Located near Down Town Sanford; plenty of restaurants, shopping, parks and so much more! Currently in probate, an extended closing date may be required.
-
2023-05-08status Pending 241-char remark
Show marketing remark (241 chars)
Looking for Fixer Upper? Then this 4 bedroom 1 full bath home is the property for you! Located near Down Town Sanford; plenty of restaurants, shopping, parks and so much more! Currently in probate, an extended closing date may be required.
-
2023-04-24price $149,999 241-char remark
Show marketing remark (241 chars)
Looking for Fixer Upper? Then this 4 bedroom 1 full bath home is the property for you! Located near Down Town Sanford; plenty of restaurants, shopping, parks and so much more! Currently in probate, an extended closing date may be required.
-
2023-04-15status Active 241-char remark
Show marketing remark (241 chars)
Looking for Fixer Upper? Then this 4 bedroom 1 full bath home is the property for you! Located near Down Town Sanford; plenty of restaurants, shopping, parks and so much more! Currently in probate, an extended closing date may be required.
-
2022-10-28price $199,900 241-char remark
Show marketing remark (241 chars)
Looking for Fixer Upper? Then this 4 bedroom 1 full bath home is the property for you! Located near Down Town Sanford; plenty of restaurants, shopping, parks and so much more! Currently in probate, an extended closing date may be required.
-
2022-09-20$199,999 Active 241-char remark
Show marketing remark (241 chars)
Looking for Fixer Upper? Then this 4 bedroom 1 full bath home is the property for you! Located near Down Town Sanford; plenty of restaurants, shopping, parks and so much more! Currently in probate, an extended closing date may be required.
ⓘ Source: listings_history table (triggers on properties + properties_extension) + one-shot
backfill from property_details.listing_events for pre-trigger history.
Tax reassessment forecast FL · Resets to sale price
- Current annual tax
- $2,064 · $172/mo
- Projected year-2 tax
- $2,240 · $187/mo
- Expected delta
- +$176/yr (+$15/mo · 8.5%)
ⓘ Screening estimate from a state-policy table — verify with the county assessor before closing.
Climate risk First Street
- Flood 4/10 Moderate FEMA zone X (unshaded) · 22% chance over 30 yrs
- Wildfire 1/10 Low
- Heat 9/10 Extreme 7 d/yr ≥107°F today · 22 d/yr by 30 yrs out
- Wind 9/10 Extreme 99% chance of damaging wind over 30 yrs
- Air quality 2/10 Low 1 unhealthy d/yr today · 1 by 30 yrs out
Nearby sold comps map
Loading sold comps map…
Walkable amenities ~0.75 mi
Loading nearby amenities…
Taxation est. · year 1
- Rental income
- $26,848
- − Mortgage interest
- −$15,119
- − Property taxes
- −$2,064
- − Insurance
- −$1,350
- − Repairs & maintenance
- −$2,148
- − Management
- −$2,148
- − Depreciation
- −$7,852
- Taxable loss
- −$3,832
- Est. tax savings @ 24.0%
- +$920
- After-tax cash flow
- $1,731/yr
For passive investors: Depreciation is non-cash, so a rental often shows a tax loss while cash-flowing — sheltering income. Rental losses are passive: they offset passive income freely, and up to $25,000/yr can offset ordinary (W-2) income if you actively participate and your MAGI is under $100k (phasing out to $0 by $150k); unused losses carry forward. On sale, claimed depreciation is recaptured at up to 25%, and gains may owe capital-gains tax (a 1031 exchange can defer both). Figures are a year-1 estimate at your 24.0% rate — not tax advice; consult a CPA.
Schools (NCES district)
- District
- Seminole
- NCES district ID
- 1201710
- Math proficiency
- 57% ▼ -7.00%
- Reading proficiency
- 61% ▼ -1.00%
- Median HH income
- $58,478
- Composite
- 51.05/100
- National rank
- #1769
- State rank
- #13 of 73 in FL
Livability — Sanford
- Score
- 73/100
- State rank
- #316
- US rank
- #5359
Category grades
Schools grade is shown separately in the Schools card above.
Census & demographics
- Census place
- Sanford, FL
- County
- Seminole County · 436,154 people
- City population
- 96,638
- Metro
- Orlando-Kissimmee-Sanford, FL
- Population (ZIP)
- 62,606
- Household income
- $77,868
- Rent vs Own
- Severe rent burden
- 2645.0
Population outlook (Seminole County) Hauer SSP2
- Today (2025)
- 515,494 people
- By 2030
- 545,713 · +5.9%
- By 2040
- 598,068 · +16.0%
- By 2050
- 640,663 · +24.3%
- By 2075
- 724,461 · +40.5%
- By 2100
- 755,530 · +46.6%
Race, ethnicity, and origin ACS 2023
- Neighborhood character
- Diverse neighborhood (Simpson 0.70)
- Race & ethnicity
- White 43% Black 24% Hispanic / Latino 23% Two or more races 13% Asian 7%
- Hispanic origin (detail)
- Mexican 2% Puerto Rican 7% Cuban 2% Dominican 2%
- Common ancestry
- Romanian 2% Slovak 1% Italian 1%
- Foreign-born
- 18% · Canada, Jamaica, China
- Languages at home
- 76% English-only · Spanish 15% Other Indo-European 3% Other Asian/Pacific 1%
Political lean MEDSL · Seminole
- 2024 margin
- Toss-up / Even · D 47.6% · R 51.1% · Other 1.3%
- 2008→2024 swing
- -0.8pp no change · 2008: -2.8pp · 2024: -3.5pp
- All cycles
- 2024: R+3.5 2020: D+2.8 2016: R+1.6 2012: R+6.5 2008: R+2.8
Not yet ingested
- Civics
- —
Market trends
- HPI YoY
- ▼ -281.27%
- Current HPI
- 299.2738
- Rent YoY
- ▲ 0.38%
- Metro
- Orlando-Kissimmee-Sanford, FL
- State GDP YoY
- ▲ 3.28%
- F500 in state
- 36
Industry mix (Fortune 500 HQ in FL)
| Industry | F500 HQs | Revenue |
|---|---|---|
| Industrial Technology | 2 | $29B |
|
||
| Insurance | 2 | $17B |
|
||
| Retail | 1 | $60B |
|
||
| Technology Distribution | 1 | $58B |
|
||
| Homebuilding | 1 | $35B |
|
||
| Technology Manufacturing | 1 | $35B |
|
||
Price history
+35.0% since first listed20 events — show timeline
- 2026-05-05 Pending — Stellar MLS as Distributed by MLS Grid
- 2026-05-02 Relisted — Stellar MLS as Distributed by MLS Grid
- 2026-04-07 Pending — Stellar MLS as Distributed by MLS Grid
- 2026-03-17 Price Changed $269,900 Stellar MLS as Distributed by MLS Grid
- 2026-03-05 Price Changed $279,900 Stellar MLS as Distributed by MLS Grid
- 2026-02-19 Price Changed $289,900 Stellar MLS as Distributed by MLS Grid
- 2026-02-13 Price Changed $299,900 Stellar MLS as Distributed by MLS Grid
- 2026-02-09 Price Changed $309,500 Stellar MLS as Distributed by MLS Grid
- 2026-01-28 Price Changed $329,500 Stellar MLS as Distributed by MLS Grid
- 2026-01-12 Price Changed $339,500 Stellar MLS as Distributed by MLS Grid
- 2025-12-29 Price Changed $349,500 Stellar MLS as Distributed by MLS Grid
- 2025-12-10 Price Changed $359,500 Stellar MLS as Distributed by MLS Grid
- 2025-11-20 Listed $369,500 Stellar MLS as Distributed by MLS Grid
- 2024-02-29 Sold (Public Records) $104,500 Public Records
- 2024-02-12 Sold (MLS) $104,500 Stellar MLS as Distributed by MLS Grid
- 2023-05-08 Pending — Stellar MLS as Distributed by MLS Grid
- 2023-04-24 Price Changed $149,999 Stellar MLS as Distributed by MLS Grid
- 2023-04-15 Relisted — Stellar MLS as Distributed by MLS Grid
- 2022-10-28 Price Changed $199,900 Stellar MLS as Distributed by MLS Grid
- 2022-09-20 Listed $199,999 Stellar MLS as Distributed by MLS Grid
Property tax history
+10.3%/yrLatest (2025): $2,064 · +8.1% YoY. Source: county tax records.
Cash-flow waterfall
monthlySold comps — $/sqft
last 12 mo · ≤1 miLoading sold comps…