110 Sinclair Ln · Wadesboro, NC
Flood risk 1/10 · Minimal
- FEMA flood zone
- X (unshaded)
- Chance of flooding over 30 yrs
- 0.0%
- Est. flood insurance / yr
- $507 – $1,088
Fire risk 3/10 · Minor
- Est. fire insurance / yr
- $906 – $1,684
Heat risk 6/10 · Moderate
- Hot days now (above 106°F)
- 7 days/yr
- Hot days in 30 yrs
- 16 days/yr
Wind risk 6/10 · Moderate
- Chance of severe wind over 30 yrs
- 55.0%
Air-quality risk 2/10 · Minimal
- Unhealthy air days now
- 1 days/yr
- Unhealthy air days in 30 yrs
- 2 days/yr
Risk factors via First Street. Map © Google.
Why this score? — see what drove the B grade
The composite is a weighted blend of 9 inputs, each scored 0–100. Each bar is that input's sub-score; the figure is the points it added to the 100-point composite (weight × sub-score).
- Cash flow +30.0/30.0
- DSCR +10.0/10.0
- Appreciation +10.0/10.0
- 1% rule +8.2/10.0
- ARV discount +7.5/15.0
- Rent growth +2.5/5.0
- Condition / age +2.5/5.0
- Schools +2.1/10.0
- Livability +2.1/5.0
$119,000
🖨 Deal sheet (PDF) 📄 Offer letter ✓ Due diligence
Listing remarks
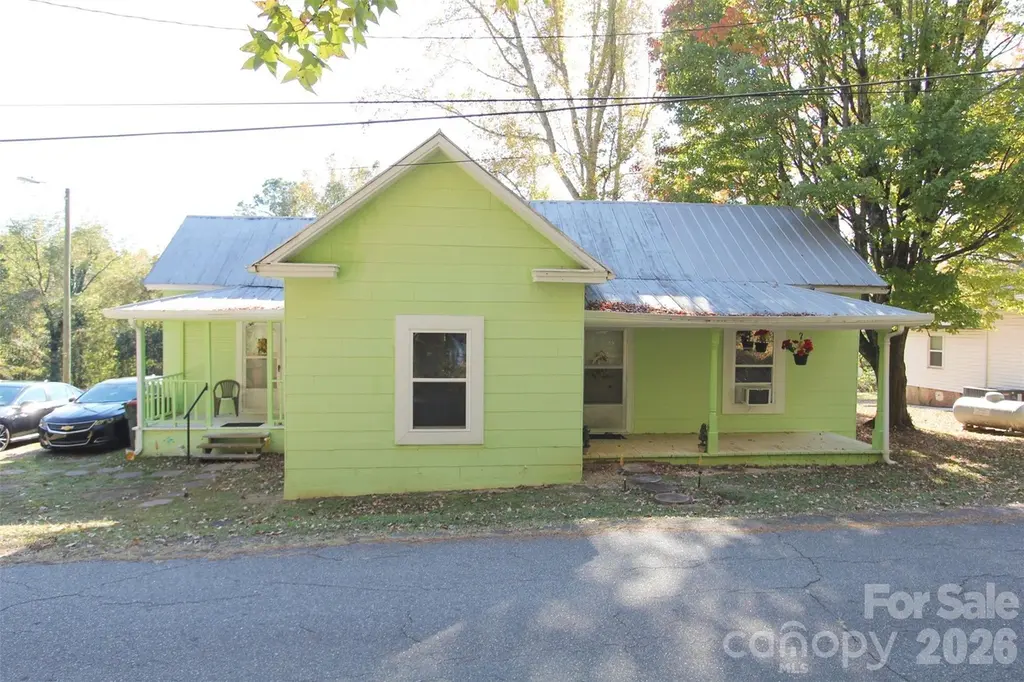
WELL MAINTAINED 1900s TWO BEDROOM, ONE BATH COTTAGE STYLE HOME, LESS THAN ONE MILE FROM SHOPPING AND DINING IN DOWNTOWN WADESBORO. This house features updated flooring & windows throughout. The bathroom includes a tub & shower combo and provides a stack washer/dryer. Updated kitchen cabinets line the wall with plenty of dining area in the kitchen. This house comes with a window Heat/AC COMBINATION unit - Just set to desired temperature for year-round comfort!
Key facts
- Stack washer dryer
- Updated flooring
- 0.26 acre lot
Tags
Property features AI
Finance
- HOA & community: No HOA
Exterior
- Parking: Driveway
- Utilities: City water; Public sewer
- Home design: Single family residence (site-built); One level; Crawl space foundation
- Construction: Metal and vinyl exterior materials; Metal roof
- Exterior features: Front porch; Roads: dirt and paved; publicly maintained
Interior
- Bedrooms: 2 bedrooms on the main level; Primary/one room approx. 13'1" x 13'7"
- Flooring: Vinyl flooring
- Bathrooms: 1 full bathroom on the main level
- Heating & cooling: Ductless electric heating; Multiple cooling options: dual systems, electric, multi units, window unit(s)
- Interior features: Insulated windows; 1 total room
- Laundry & utility: Washer/Dryer included; Laundry located in the bathroom
Neighborhood map
What this means for you Summary
Snapshot
- This is a 2-bed/1.0-bath single-family listed at $119k.
Deal economics
- At list price, monthly cash flow is $538 ($6k/yr) — positive.
- The deal already cash-flows at list — no discount required.
- Meets the 1% rule at list price ($2k rent vs $119k).
- Recommended offer: $112k (6.0% below list) — sets the bar for market timing.
- Cap rate 11.7% vs local median 6.2% in Wadesboro — top-decile yield for the area; either an underpriced asset or a hidden risk that comps aren't pricing in. Stress-test before assuming the spread holds.
Location & tenants
- Location reads 41/100 on livability (#728 in NC) — a working-class tenant base; expect higher turnover. Strengths: cost of living A+; Watch: housing C-, schools F, crime F.
- Anson County Schools (rural): math 20% / reading 32% proficiency, ranked #159 of 178 in NC (top 89%) — low school quality limits family demand, transient renter base, plan for 1-2y turnover; 67% free/reduced lunch — lower-income household profile, screen leases tightly.
- Market conditions: 87 active listings in the ZIP; 55 units permitted in Anson County in 2024 (0 in 5+ unit buildings).
Forward outlook
- In year one you build about $13k of equity ($823 loan paydown + $12k appreciation (10.0% local appreciation)).
- Anson County population projected at -24% by 2050 — secular population decline; favor cash flow + early exit over multi-decade hold.
- At projected returns (10.0% appreciation + 3.0% rent growth), your $33k cash investment doubles in ~2 years — after that, you're playing with house money.
- By year 3, paydown + projected appreciation supports a ~$32k cash-out refi (75% LTV) — recoverable capital for the next deal without selling this one.
Negotiation context
- It's been on market 75 days — a 6% lower offer ($112k) is reasonable based on typical stale-listing flexibility.
- 10 sale attempts since 11y ago with the ask held roughly flat each time — persistent listings suggest the price (not the market) is what's stuck; bring a comps-based counter.
- Current owner paid $10; list at $119k implies a 1189900% gain — meaningful room to come down on a strong offer.
Risks & watch-outs
- Watch-outs: built in 1900 — expect roof / HVAC / electrical / plumbing capex.
- Climate carrying-cost: major wind risk, 55% chance of damaging wind over 30y; extreme-heat days projected 7→16/yr by 2055 (HVAC capex compounding) — expect insurance premiums to compound above CPI over the hold.
Questions for the listing agent
- It's been on market 75 days. Have you received any prior offers? Is the seller open to a 6% concession, seller financing, or rate buy-down credit?
- Built in 1900 — when were the roof, HVAC, electrical panel, plumbing, and water heater last replaced?
- Why hasn't it sold? Are there any deal-killer items the seller is aware of (foundation, flood, title, zoning, code violations)?
- Is there a deadline driving the sale (1031 exchange, divorce, estate, relocation)? That informs how much negotiation room exists.
- Schools are F-rated, which usually means shorter tenancies and higher turnover. Who's the typical renter profile here, and what's been the actual vacancy rate?
- Crime grade is F in this area — have there been break-ins, vandalism, or insurance claims at this property in the last 3 years? What carrier currently insures it and at what premium?
- What's the average days-on-market for RENTAL listings here right now (not sales)? A rising rental-DOM trend means longer vacancies and softer asking-rent achievability than the comps imply.
- What's the recent tenant-quality profile in this submarket — average credit score on applications, eviction rate, late-payment / NSF rate, and stable-employment percentage? A property-management company in the area should have these aggregated.
- How much new for-sale + rental construction is in the pipeline within 1–3 miles? Heavy new supply typically softens prices + rents 12–24 months out; constrained supply supports both.
Investment metrics
- 1% rule
- 1.32% ✓
- Cap rate
- 11.72%
- Cash-on-cash
- 19.38%
- DSCR
- 1.86
- GRM
- 6.3
CMA / ARV
- ARV (on-the-fly)
- $68,474
- Comps found
- 5
Show comp detail 5 sales within ~0.75 mi
| Address | Dist | Beds/Ba | Sqft | Sold | Price | $/sf | Match |
|---|---|---|---|---|---|---|---|
| 203 Wheeler St | 0.44mi | 3/1.0 (+1) | 1,084 (+6%) | 7mo | $37,000 | $34 | 58 |
| 511 Lodge St | 0.55mi | 3/1.0 (+1) | 973 (-5%) | 8mo | $152,000 | $156 | 54 |
| 832 Sikes Ave | 0.27mi | 3/2.0 (+1) | 1,173 (+15%) | 3mo | $165,000 | $141 | 52 |
| 713 Sikes Ave #2 | 0.45mi | 2/1.0 | 927 (-9%) | 18mo | $40,000 | $43 | 49 |
| 609 Cedar St | 0.73mi | 3/1.0 (+1) | 963 (-6%) | 9mo | $64,900 | $67 | 44 |
Match score weights: distance 35% · size 25% · config 20% · recency 20%. Top-matched comps best support the ARV.
Projected returns pro-forma
10.0% appreciation · 3.0% rent growth · sell at horizon
- IRR
- 38.7%
- Equity multiple
- 3.97×
- Total profit
- $99,036
- Equity at exit
- $107,205
- IRR
- 33.3%
- Equity multiple
- 8.94×
- Total profit
- $264,598
- Equity at exit
- $231,191
Cash invested: $33,320 (down + closing). Projections, not guarantees.
Landlord ↔ Tenant lean methodology
- Overall (STATE)
- 85 Strongly Landlord-Friendly
- State North Carolina
- 85 Strongly Landlord-Friendly · R+3
- County
- — inherits STATE
- City
- — inherits STATE
ZIP-level market 28170
- Home prices YoY
- 5.8%
- Active inventory
- 87
- Price-to-rent
- 6.3×
Monthly cashflow live
- Estimated rent
- $1,576 medium interval (Pro) →
- Mortgage (P&I)
- −$624
- Tax from tax record
- −$33 /mo · $396/yr
- Insurance
- −$50
- HOA
- −$0
- Vacancy / Maint / Mgmt
- −$331
- Net cashflow
- $538
Break-even live
Sensitivity live
| Price | -10% $605 | -5% $572 | +0% $538 | +5% $504 | +10% $471 |
|---|---|---|---|---|---|
| Rent | -10% $414 | -5% $476 | +0% $538 | +5% $600 | +10% $663 |
| Rate | -1.0pp $598 | -0.5pp $568 | base $538 | +0.5pp $507 | +1.0pp $476 |
UW: 25.0% down · 7.5% · 30yr · 1.5% tax · 5.0% vac · 8.0% maint · 8.0% mgmt
Financing live
Cash to close
- Down payment
- $29,750
- Closing costs
- $3,570
- Reserves months
- —
- Total cash needed
- —
Loan-product check · same deal, 3 products live
Conventional
25% down · 7.5% · 30yr
- Down + closing
- —
- Monthly P&I
- —
- Monthly cashflow
- —
- DSCR
- —
- Eligible?
- —
Personal DTI + credit; lowest rate.
DSCR
20% down · 8.5% · 30yr
- Down + closing
- —
- Monthly P&I
- —
- Monthly cashflow
- —
- DSCR
- —
- Eligible?
- —
No personal income docs; deal must DSCR.
Hard money
10% down · 12.0% · 12mo
- Down + closing
- —
- Monthly P&I
- —
- Monthly cashflow
- —
- DSCR
- —
- Eligible?
- —
Short-term bridge; refi at stabilization.
Listing history 42 events
-
2026-06-21days on market $119,000 Active 75 DOM
-
2026-06-18days on market $119,000 Active 73 DOM
-
2026-06-17days on market $119,000 Active 72 DOM
-
2026-06-16days on market $119,000 Active 71 DOM
-
2026-06-15days on market $119,000 Active 70 DOM
-
2026-06-13days on market $119,000 Active 68 DOM
-
2026-06-12days on market $119,000 Active 67 DOM
-
2026-06-09days on market $119,000 Active 64 DOM
-
2026-06-08days on market $119,000 Active 63 DOM
-
2026-06-07days on market $119,000 Active 62 DOM
-
2026-06-07days on market $119,000 Active 61 DOM
-
2026-06-04days on market $119,000 Active 58 DOM
-
2026-06-02days on market $119,000 Active 57 DOM
-
2026-06-01days on market $119,000 Active 56 DOM
-
2026-05-31days on market $119,000 Active 55 DOM
-
2026-04-06$119,000 Active
-
2024-08-27status Active
-
2024-03-25price $138,000
-
2024-02-16price $145,000
-
2023-11-09$156,000 Active
-
2023-10-24soldstatus $10
-
2022-11-30$104,900 Active
-
2022-06-29price $109,900
-
2022-06-04$119,900 Active
-
2022-01-04soldstatus $28,000 Closed
-
2021-12-13historical Active Under Contract
-
2021-11-19price $38,000
-
2021-08-17price $42,000
-
2021-07-09price $45,000
-
2021-06-29price $54,000
-
2021-05-26$59,000 Active
-
2017-08-31soldstatus $16,750 Closed
-
2017-08-31soldstatus $34,000
-
2017-07-25historical Under Contract - No Show
-
2017-07-21status Active
-
2017-07-12historical
-
2017-07-11status Active
-
2017-07-01historical
-
2017-01-04status Active
-
2017-01-03historical
-
2015-05-12price $29,900
-
2015-03-04$34,900 Active
ⓘ Source: listings_history table (triggers on properties + properties_extension) + one-shot
backfill from property_details.listing_events for pre-trigger history.
Tax reassessment forecast NC · Resets to sale price
- Current annual tax
- $396 · $33/mo
- Projected year-2 tax
- $976 · $81/mo
- Expected delta
- +$580/yr (+$48/mo · 146.7%)
ⓘ Screening estimate from a state-policy table — verify with the county assessor before closing.
Climate risk First Street
- Flood 1/10 Low FEMA zone X (unshaded) · 0% chance over 30 yrs
- Wildfire 3/10 Moderate
- Heat 6/10 Major 7 d/yr ≥106°F today · 16 d/yr by 30 yrs out
- Wind 6/10 Major 55% chance of damaging wind over 30 yrs
- Air quality 2/10 Low 1 unhealthy d/yr today · 2 by 30 yrs out
Nearby sold comps map
Loading sold comps map…
Walkable amenities ~0.75 mi
Loading nearby amenities…
Taxation est. · year 1
- Rental income
- $18,907
- − Mortgage interest
- −$6,666
- − Property taxes
- −$396
- − Insurance
- −$595
- − Repairs & maintenance
- −$1,513
- − Management
- −$1,513
- − Depreciation
- −$3,462
- Taxable income
- $4,764
- Est. tax owed @ 24.0%
- −$1,143
- After-tax cash flow
- $5,314/yr
For passive investors: Depreciation is non-cash, so a rental often shows a tax loss while cash-flowing — sheltering income. Rental losses are passive: they offset passive income freely, and up to $25,000/yr can offset ordinary (W-2) income if you actively participate and your MAGI is under $100k (phasing out to $0 by $150k); unused losses carry forward. On sale, claimed depreciation is recaptured at up to 25%, and gains may owe capital-gains tax (a 1031 exchange can defer both). Figures are a year-1 estimate at your 24.0% rate — not tax advice; consult a CPA.
Schools (NCES district)
- District
- Anson County Schools
- NCES district ID
- 3700180
- Math proficiency
- 20% ▼ -7.00%
- Reading proficiency
- 32% ▼ -1.00%
- Median HH income
- $34,961
- Composite
- 21.41/100
- National rank
- #8348
- State rank
- #159 of 178 in NC
Livability — Wadesboro
- Score
- 41/100
- State rank
- #728
- US rank
- #27112
Category grades
Schools grade is shown separately in the Schools card above.
Census & demographics
- Census place
- Wadesboro, NC
- Population (ZIP)
- 9,595
Population outlook (Anson County) Hauer SSP2
- Today (2025)
- 23,572 people
- By 2030
- 22,384 · -5.0%
- By 2040
- 19,976 · -15.3%
- By 2050
- 17,803 · -24.5%
- By 2075
- 13,839 · -41.3%
- By 2100
- 10,890 · -53.8%
Race, ethnicity, and origin ACS 2023
- Neighborhood character
- Diverse neighborhood (Simpson 0.57)
- Race & ethnicity
- Black 53% White 38% Two or more races 4% Asian 3% Hispanic / Latino 2%
- Common ancestry
- Slovak 1% Russian 1% Serbian 1%
- Foreign-born
- 4% · Canada, South Korea
- Languages at home
- 95% English-only · Spanish 2% Other Asian/Pacific 1% Korean 1%
Political lean MEDSL · Anson
- 2024 margin
- Toss-up / Even · D 48.4% · R 50.9%
- 2008→2024 swing
- -23.5pp toward R · 2008: 20.9pp · 2024: -2.5pp
- All cycles
- 2024: R+2.5 2020: D+4.2 2016: D+12.6 2012: D+25.0 2008: D+20.9
Not yet ingested
- Civics
- —
Market trends
- HPI YoY
- ▲ 12.62%
- Current HPI
- 228.7798
- Rent YoY
- —
- Metro
- —
- State GDP YoY
- ▲ 3.28%
- F500 in state
- 26
Industry mix (Fortune 500 HQ in NC)
| Industry | F500 HQs | Revenue |
|---|---|---|
| Financial Services | 2 | $213B |
|
||
| Retail | 2 | $95B |
|
||
| Industrial Conglomerate | 1 | $38B |
|
||
| Metals / Steel | 1 | $35B |
|
||
| Utilities | 1 | $30B |
|
||
| Industrial Machinery | 1 | $19B |
|
||
Price history
+241.0% since first listed27 events — show timeline
- 2026-04-06 Listed $119,000 CANOPYMLS as Distributed by MLS Grid
- 2024-08-27 Relisted — CANOPYMLS as Distributed by MLS Grid
- 2024-03-25 Price Changed $138,000 CANOPYMLS as Distributed by MLS Grid
- 2024-02-16 Price Changed $145,000 CANOPYMLS as Distributed by MLS Grid
- 2023-11-09 Listed $156,000 CANOPYMLS as Distributed by MLS Grid
- 2023-10-24 Sold (Public Records) $10 Public Records
- 2022-11-30 Listed $104,900 CANOPYMLS as Distributed by MLS Grid
- 2022-06-29 Price Changed $109,900 CANOPYMLS as Distributed by MLS Grid
- 2022-06-04 Listed $119,900 CANOPYMLS as Distributed by MLS Grid
- 2022-01-04 Sold (MLS) $28,000 CANOPYMLS as Distributed by MLS Grid
- 2021-12-13 Contingent — CANOPYMLS as Distributed by MLS Grid
- 2021-11-19 Price Changed $38,000 CANOPYMLS as Distributed by MLS Grid
- 2021-08-17 Price Changed $42,000 CANOPYMLS as Distributed by MLS Grid
- 2021-07-09 Price Changed $45,000 CANOPYMLS as Distributed by MLS Grid
- 2021-06-29 Price Changed $54,000 CANOPYMLS as Distributed by MLS Grid
- 2021-05-26 Listed $59,000 CANOPYMLS as Distributed by MLS Grid
- 2017-08-31 Sold (Public Records) $34,000 Public Records
- 2017-08-31 Sold (MLS) $16,750 CANOPYMLS as Distributed by MLS Grid
- 2017-07-25 Contingent — CANOPYMLS as Distributed by MLS Grid
- 2017-07-21 Relisted — CANOPYMLS as Distributed by MLS Grid
- 2017-07-12 Delisted — CANOPYMLS as Distributed by MLS Grid
- 2017-07-11 Relisted — CANOPYMLS as Distributed by MLS Grid
- 2017-07-01 Delisted — CANOPYMLS as Distributed by MLS Grid
- 2017-01-04 Relisted — CANOPYMLS as Distributed by MLS Grid
- 2017-01-03 Delisted — CANOPYMLS as Distributed by MLS Grid
- 2015-05-12 Price Changed $29,900 CANOPYMLS as Distributed by MLS Grid
- 2015-03-04 Listed $34,900 CANOPYMLS as Distributed by MLS Grid
Property tax history
+5.1%/yrLatest (2025): $396 · +4.5% YoY. Source: county tax records.
Cash-flow waterfall
monthlySold comps — $/sqft
last 12 mo · ≤1 miLoading sold comps…