246 E Shirley Rd · Pamplico, SC
Flood risk 1/10 · Minimal
- FEMA flood zone
- X (unshaded)
- Chance of flooding over 30 yrs
- 0.0%
- Est. flood insurance / yr
- $507 – $1,088
Fire risk 6/10 · Moderate
- Est. fire insurance / yr
- $783 – $1,453
Heat risk 7/10 · Major
- Hot days now (above 109°F)
- 7 days/yr
- Hot days in 30 yrs
- 16 days/yr
Wind risk 8/10 · Major
- Chance of severe wind over 30 yrs
- 80.0%
Air-quality risk 2/10 · Minimal
- Unhealthy air days now
- 1 days/yr
- Unhealthy air days in 30 yrs
- 1 days/yr
Risk factors via First Street. Map © Google.
Why this score? — see what drove the B- grade
The composite is a weighted blend of 9 inputs, each scored 0–100. Each bar is that input's sub-score; the figure is the points it added to the 100-point composite (weight × sub-score).
- Cash flow +25.4/30.0
- Appreciation +10.0/10.0
- DSCR +8.4/10.0
- ARV discount +7.5/15.0
- 1% rule +5.3/10.0
- Livability +3.1/5.0
- Rent growth +2.5/5.0
- Condition / age +2.5/5.0
- Schools +2.2/10.0
$99,000
🖨 Deal sheet 📄 Offer letter ✓ Due diligence
Listing remarks
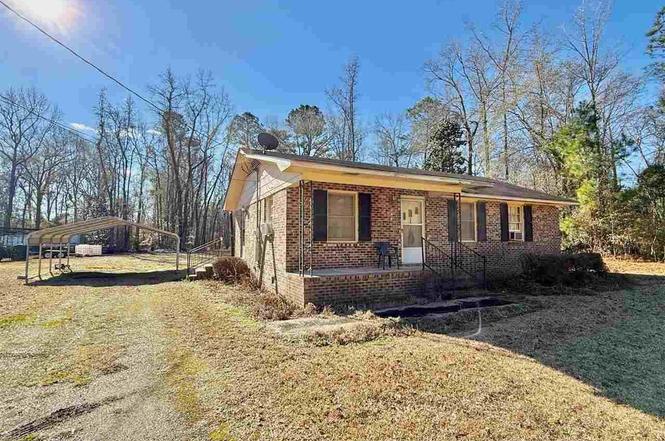
Opportunity awaits! This 3 bedroom, 1 bath home offers endless potential for the right buyer. Whether you are an investor looking for your next project, a first-time buyer ready to build equity, or someone who loves the idea of customizing a home to fit your style, this property is full of possibilities. Inside, you will find a traditional layout with generously sized bedrooms, a living room and dining room connected to your kitchen with tons of cabinet space and a large bar. The home retains its original character, making it the perfect canvas for a renovation or refresh. Outside, the large . 69-acre lot provides plenty of space for any activities and improvements and a large carport for c
Key facts
- Large lot
- Large carport
- 0.69 acre lot
Tags
Property features AI
Finance
- Other: Lot size approximately 0.69 acres
- Financial info: No financial details provided
- HOA & community: No HOA information provided
Exterior
- Parking: No parking details provided
- Security: No security features provided
- Utilities: Public water; Septic tank sewer
- Home design: Single family residence; Residential property
- Construction: Brick veneer construction; Built area above grade: 1,014
- Exterior features: Storage; Shingle roof
Interior
- Kitchen: Range
- Bedrooms: No bedroom level information provided
- Flooring: Carpet; Tile; Vinyl
- Bathrooms: 1 full bathroom
- Heating & cooling: Window unit(s); Ceiling fan(s)
- Interior features: Range; Ceiling fan(s)
- Laundry & utility: Crawl space
Neighborhood map
What this means for you Summary
Snapshot
- This is a 3-bed/1.5-bath single-family listed at $99k.
Deal economics
- At list price, monthly cash flow is $229 ($3k/yr) — positive.
- The deal already cash-flows at list — no discount required.
- Meets the 1% rule at list price ($1k rent vs $99k).
- Recommended offer: $87k (12.0% below list) — sets the bar for market timing.
Location & tenants
- Location reads 62/100 on livability (#186 in SC) — a middle-class / working-renter tenant base. Strengths: cost of living A+, housing A+, health & safety A+; Watch: crime F, amenities F, commute F.
- Florence 02 (rural): math 21% / reading 32% proficiency, ranked #61 of 80 in SC (top 76%) — low school quality limits family demand, transient renter base, plan for 1-2y turnover.
- Zoned schools: Hannah-Pamplico Elementary/Middle (math 21% / reading 28%, grade F, #452 of 597 statewide, top 78%, 761 students, 100% FRL); Hannah Pamplico High (math 75% / reading 95%, grade A, #11 of 196 statewide, top 5%, 307 students, 72% FRL) — zoned schools average 86% FRL vs 59% district-wide (27 pts higher); higher-poverty schools than district average — tighter screening recommended.
- Zoned-school proficiency averages 55% at this address vs 26% district-wide (+28 pts) — the actual schools serving this property are materially stronger than the Florence 02 average implies; a family-tenant draw the district grade alone would hide.
- Market conditions: 16 active listings in the ZIP; 657 units permitted in Florence County in 2024 (40 in 5+ unit buildings).
Forward outlook
- In year one you build about $11k of equity ($684 loan paydown + $10k appreciation (10.0% local appreciation)).
- At projected returns (10.0% appreciation + 3.0% rent growth), your $28k cash investment doubles in ~2 years — after that, you're playing with house money.
- By year 4, paydown + projected appreciation supports a ~$38k cash-out refi (75% LTV) — recoverable capital for the next deal without selling this one.
Negotiation context
- It's been on market 126 days — a 12% lower offer ($87k) is reasonable based on typical stale-listing flexibility.
Risks & watch-outs
- Climate carrying-cost: severe wind risk, 80% chance of damaging wind over 30y; major wildfire risk; extreme-heat days projected 7→16/yr by 2055 (HVAC capex compounding) — expect insurance premiums to compound above CPI over the hold.
Questions for the listing agent
- It's been on market 126 days. Have you received any prior offers? Is the seller open to a 12% concession, seller financing, or rate buy-down credit?
- Built in 1976 — when were the roof, HVAC, electrical panel, plumbing, and water heater last replaced?
- Why hasn't it sold? Are there any deal-killer items the seller is aware of (foundation, flood, title, zoning, code violations)?
- Is there a deadline driving the sale (1031 exchange, divorce, estate, relocation)? That informs how much negotiation room exists.
- Schools are D-rated, which usually means shorter tenancies and higher turnover. Who's the typical renter profile here, and what's been the actual vacancy rate?
- Crime grade is F in this area — have there been break-ins, vandalism, or insurance claims at this property in the last 3 years? What carrier currently insures it and at what premium?
- What's the average days-on-market for RENTAL listings here right now (not sales)? A rising rental-DOM trend means longer vacancies and softer asking-rent achievability than the comps imply.
- What's the recent tenant-quality profile in this submarket — average credit score on applications, eviction rate, late-payment / NSF rate, and stable-employment percentage? A property-management company in the area should have these aggregated.
- How much new for-sale + rental construction is in the pipeline within 1–3 miles? Heavy new supply typically softens prices + rents 12–24 months out; constrained supply supports both.
Investment metrics
- 1% rule
- 1.03% ✓
- Cap rate
- 9.06%
- Cash-on-cash
- 9.90%
- DSCR
- 1.44
- GRM
- 8.1
CMA / ARV
No comps found within radius.
Projected returns pro-forma
10.0% appreciation · 3.0% rent growth · sell at horizon
- IRR
- 31.5%
- Equity multiple
- 3.47×
- Total profit
- $68,429
- Equity at exit
- $89,187
- IRR
- 27.2%
- Equity multiple
- 7.85×
- Total profit
- $189,963
- Equity at exit
- $192,335
Cash invested: $27,720 (down + closing). Projections, not guarantees.
Landlord ↔ Tenant lean methodology
- Overall (STATE)
- 90 Strongly Landlord-Friendly
- State South Carolina
- 90 Strongly Landlord-Friendly · R+6
- County
- — inherits STATE
- City
- — inherits STATE
ZIP-level market 29583
- Home prices YoY
- 8.5%
- Active inventory
- 16
- Price-to-rent
- 8.1×
Monthly cashflow live
- Estimated rent
- $1,021 medium interval (Pro) →
- Mortgage (P&I)
- −$519
- Tax from tax record
- −$17 /mo · $210/yr
- Insurance
- −$41
- HOA
- −$0
- Vacancy / Maint / Mgmt
- −$214
- Net cashflow
- $229
Break-even live
UW: 25.0% down · 7.5% · 30yr · 1.5% tax · 5.0% vac · 8.0% maint · 8.0% mgmt
Financing live
Cash to close
- Down payment
- $24,750
- Closing costs
- $2,970
- Reserves months
- —
- Total cash needed
- —
Loan-product check · same deal, 3 products live
Conventional
25% down · 7.5% · 30yr
- Down + closing
- —
- Monthly P&I
- —
- Monthly cashflow
- —
- DSCR
- —
- Eligible?
- —
Personal DTI + credit; lowest rate.
DSCR
20% down · 8.5% · 30yr
- Down + closing
- —
- Monthly P&I
- —
- Monthly cashflow
- —
- DSCR
- —
- Eligible?
- —
No personal income docs; deal must DSCR.
Hard money
10% down · 12.0% · 12mo
- Down + closing
- —
- Monthly P&I
- —
- Monthly cashflow
- —
- DSCR
- —
- Eligible?
- —
Short-term bridge; refi at stabilization.
Listing history 19 events
-
2026-06-19days on market $99,000 Active 126 DOM
-
2026-06-18days on market $99,000 Active 125 DOM
-
2026-06-17days on market $99,000 Active 124 DOM
-
2026-06-16days on market $99,000 Active 123 DOM
-
2026-06-15days on market $99,000 Active 122 DOM
-
2026-06-14days on market $99,000 Active 120 DOM
-
2026-06-13days on market $99,000 Active 119 DOM
-
2026-06-10days on market $99,000 Active 117 DOM
-
2026-06-09days on market $99,000 Active 116 DOM
-
2026-06-08days on market $99,000 Active 115 DOM
-
2026-06-07days on market $99,000 Active 114 DOM
-
2026-06-05days on market $99,000 Active 111 DOM
-
2026-06-02days on market $99,000 Active 109 DOM
-
2026-06-01days on market $99,000 Active 108 DOM
-
2026-05-31days on market $99,000 Active 107 DOM
-
2026-05-30days on market $99,000 Active 106 DOM
-
2026-04-21price $99,000
-
2026-03-13price $103,000
-
2026-02-13$110,000 Active
ⓘ Source: listings_history table (triggers on properties + properties_extension) + one-shot
backfill from property_details.listing_events for pre-trigger history.
Tax reassessment forecast SC · Resets to sale price
- Current annual tax
- $210 · $17/mo
- Projected year-2 tax
- $564 · $47/mo
- Expected delta
- +$354/yr (+$30/mo · 168.9%)
ⓘ Screening estimate from a state-policy table — verify with the county assessor before closing.
Climate risk First Street
- Flood 1/10 Low FEMA zone X (unshaded) · 0% chance over 30 yrs
- Wildfire 6/10 Major
- Heat 7/10 Severe 7 d/yr ≥109°F today · 16 d/yr by 30 yrs out
- Wind 8/10 Severe 80% chance of damaging wind over 30 yrs
- Air quality 2/10 Low 1 unhealthy d/yr today · 1 by 30 yrs out
Nearby sold comps map
Loading sold comps map…
Walkable amenities ~0.75 mi
Loading nearby amenities…
Taxation est. · year 1
- Rental income
- $12,251
- − Mortgage interest
- −$5,546
- − Property taxes
- −$210
- − Insurance
- −$495
- − Repairs & maintenance
- −$980
- − Management
- −$980
- − Depreciation
- −$2,880
- Taxable income
- $1,160
- Est. tax owed @ 24.0%
- −$279
- After-tax cash flow
- $2,465/yr
For passive investors: Depreciation is non-cash, so a rental often shows a tax loss while cash-flowing — sheltering income. Rental losses are passive: they offset passive income freely, and up to $25,000/yr can offset ordinary (W-2) income if you actively participate and your MAGI is under $100k (phasing out to $0 by $150k); unused losses carry forward. On sale, claimed depreciation is recaptured at up to 25%, and gains may owe capital-gains tax (a 1031 exchange can defer both). Figures are a year-1 estimate at your 24.0% rate — not tax advice; consult a CPA.
Schools (NCES district)
- District
- Florence 02
- NCES district ID
- 4502160
- Math proficiency
- 21% ▼ -12.00%
- Reading proficiency
- 32% ▼ -8.00%
- Median HH income
- $37,185
- Composite
- 22.04/100
- National rank
- #8199
- State rank
- #61 of 80 in SC
Livability — Pamplico
- Score
- 62/100
- State rank
- #186
- US rank
- #16126
Category grades
Schools grade is shown separately in the Schools card above.
Census & demographics
- Population (ZIP)
- 5,318
Population outlook (Florence County) Hauer SSP2
- Today (2025)
- 141,714 people
- By 2030
- 142,121 · +0.3%
- By 2040
- 141,344 · -0.3%
- By 2050
- 139,478 · -1.6%
- By 2075
- 132,275 · -6.7%
- By 2100
- 118,374 · -16.5%
Race, ethnicity, and origin ACS 2023
- Neighborhood character
- Majority White (61%)
- Race & ethnicity
- White 61% Black 33% Two or more races 5% Hispanic / Latino 2%
- Common ancestry
- Serbian 2% Slovak 1%
- Foreign-born
- 2% · Canada, China
- Languages at home
- 97% English-only · Spanish 3%
Political lean MEDSL · Florence
- 2024 margin
- Lean R (+8.0) · D 45.3% · R 53.3% · Other 1.3%
- 2008→2024 swing
- -4.8pp toward R · 2008: -3.2pp · 2024: -8.0pp
- All cycles
- 2024: R+8.0 2020: R+2.3 2016: R+5.0 2012: R+0.5 2008: R+3.2
Not yet ingested
- Civics
- —
Market trends
- HPI YoY
- ▲ 19.96%
- Current HPI
- 255.8019
- Rent YoY
- —
- Metro
- —
- State GDP YoY
- ▲ 4.51%
- F500 in state
- 2
Industry mix (Fortune 500 HQ in SC)
| Industry | F500 HQs | Revenue |
|---|---|---|
| Packaging | 1 | $7B |
|
||
Price history
-10.0% since first listed3 events — show timeline
- 2026-04-21 Price Changed $99,000 RAGPD
- 2026-03-13 Price Changed $103,000 RAGPD
- 2026-02-13 Listed $110,000 RAGPD
Property tax history
+19.0%/yrLatest (2025): $210 · -1.3% YoY. Source: county tax records.
Cash-flow waterfall
monthlySold comps — $/sqft
last 12 mo · ≤1 miLoading sold comps…