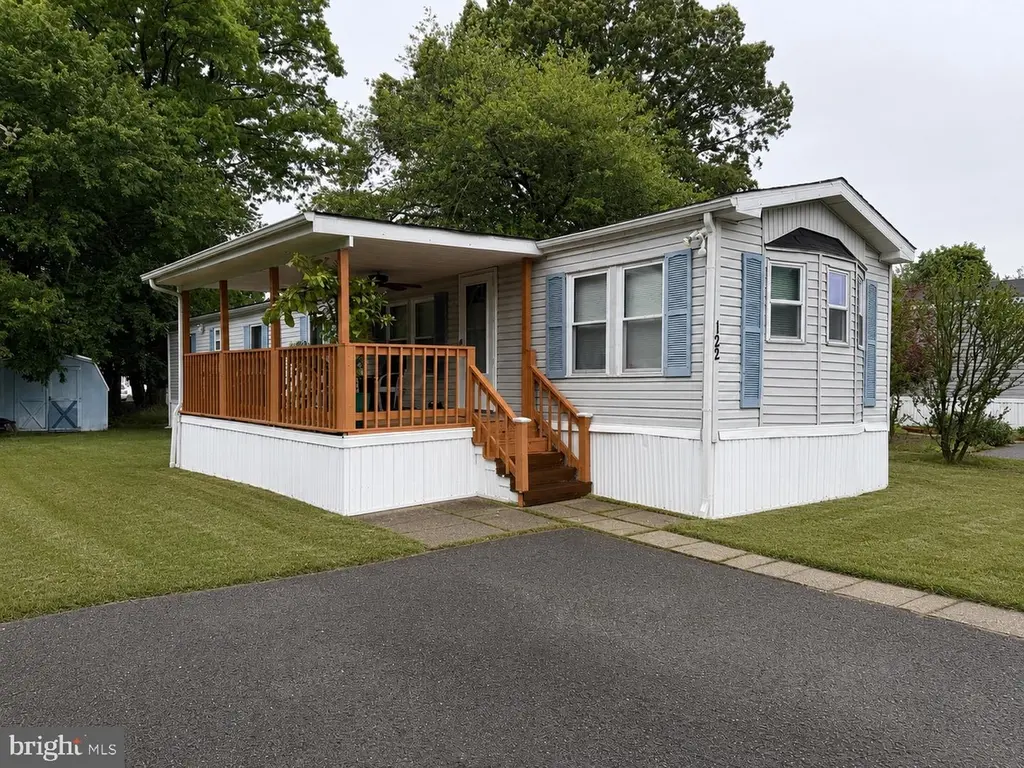
1976 N East Ave #122 · Vineland, NJ
Flood risk No data
- FEMA flood zone
- —
- Chance of flooding over 30 yrs
- —
- Est. flood insurance / yr
- —
Fire risk No data
- Est. fire insurance / yr
- —
Heat risk No data
- Hot days now (above threshold)
- —
- Hot days in 30 yrs
- —
Wind risk No data
- Chance of severe wind over 30 yrs
- —
Air-quality risk No data
- Unhealthy air days now
- —
- Unhealthy air days in 30 yrs
- —
Risk factors via First Street. Map © Google.
Why this score? — see what drove the B grade
The composite is a weighted blend of 9 inputs, each scored 0–100. Each bar is that input's sub-score; the figure is the points it added to the 100-point composite (weight × sub-score).
- Cash flow +30.0/30.0
- ARV discount +10.4/15.0
- 1% rule +10.0/10.0
- DSCR +10.0/10.0
- Condition / age +3.8/5.0
- Livability +3.3/5.0
- Rent growth +2.5/5.0
- Schools +1.9/10.0
- Appreciation +0.0/10.0
$80,000
🖨 Deal sheet 📄 Offer letter ✓ Due diligence
Listing remarks
Welcome to this well-maintained 3 bedroom, 1 bath manufactured home offering comfortable one- floor living and a bright open-concept layout. Step inside to an inviting eat-In kitchen that flows seamlessly into the main living area, creating the perfect space for everyday living and entertaining. All appliances are in as-is condition for added convenience. Recent updates include brand new roof installed in 2025. Enjoy relaxing outdoors on the spacious deck and take advantage of additional storage with the included shed. The community offers a clubhouse for homeowners along with a small park area to enjoy. This turn-key home is priced to sell and ready for its new owner. Sale is contingent up
Key facts
- Large deck
- Community clubhouse
- One-floor living
Tags
Property features AI
Finance
- Other: Land assessed value listed
- Financial info: Annual ground rent listed in income/expense items; Land lease amount $786 per month; Land lease years remaining: 0
- HOA & community: HOA/land-lease fee of $786 per month
Exterior
- Parking: Driveway
- Utilities: Public water; Public sewer
- Home design: Manufactured home; Land lease ownership
- Construction: Aluminum siding; Above-grade and below-grade structures included; Year built: estimated
- Exterior features: Ground rent exists (paid annually); Pet-friendly with breed restrictions
Interior
- Kitchen: Dishwasher; Gas range/oven; Refrigerator
- Bedrooms: 3 bedrooms on main level
- Bathrooms: 1 full bathroom on main level; 1 full bathroom total
- Heating & cooling: Forced air heating (natural gas); Central air conditioning
- Interior features: Open floor plan; Eat-in kitchen; No basement; Two or more exits for accessibility
- Laundry & utility: Electric dryer
Neighborhood map
What this means for you Summary
Snapshot
- This is a 3-bed/1.0-bath single-family listed at $80k. Condition is rated good.
Deal economics
- At list price, monthly cash flow is $1k ($13k/yr) — positive.
- The deal already cash-flows at list — no discount required.
- Meets the 1% rule at list price ($2k rent vs $80k).
- Cap rate 22.1% vs local median 4.5% in Vineland — top-decile yield for the area; either an underpriced asset or a hidden risk that comps aren't pricing in. Stress-test before assuming the spread holds.
Location & tenants
- Location reads 66/100 on livability (#363 in NJ) — a middle-class / working-renter tenant base. Strengths: housing A+, health & safety A+; Watch: employment D+, crime F, amenities F.
- Vineland Public School District (urban): math 9% / reading 34% proficiency, ranked #418 of 472 in NJ (top 89%) — low school quality limits family demand, transient renter base, plan for 1-2y turnover.
- Zoned schools: Vineland Senior High School (math 10% / reading 34%, grade F, #346 of 399 statewide, top 88%, 2,780 students, 0% FRL) — zoned schools average 0% FRL vs 53% district-wide (53 pts lower); this property's tenant base skews higher-income than the district average.
- Market conditions: 173 active listings in the ZIP; 216 units permitted in Cumberland County in 2024 (73 in 5+ unit buildings).
- This rent runs 37% of the median local income ($65k/yr) — at the standard rent-burdened threshold; future hikes will face affordability resistance.
Forward outlook
- Local home prices are declining (-3.0%/yr); year-one equity from $553 of loan paydown is wiped out by about $2k of value loss. Plan a longer hold.
- Cumberland County population projected to shrink 7% by 2050 — rents likely to lag national; underwrite the cash flow, not the appreciation.
- At projected returns (-3.0% appreciation + 3.0% rent growth), your $22k cash investment doubles in ~3 years — after that, you're playing with house money.
Negotiation context
- Only 4 days on market — expect competitive offers; lowballing is unlikely to land.
Questions for the listing agent
- Is there a deadline driving the sale (1031 exchange, divorce, estate, relocation)? That informs how much negotiation room exists.
- Schools are D-rated, which usually means shorter tenancies and higher turnover. Who's the typical renter profile here, and what's been the actual vacancy rate?
- Crime grade is F in this area — have there been break-ins, vandalism, or insurance claims at this property in the last 3 years? What carrier currently insures it and at what premium?
- What's the average days-on-market for RENTAL listings here right now (not sales)? A rising rental-DOM trend means longer vacancies and softer asking-rent achievability than the comps imply.
- What's the recent tenant-quality profile in this submarket — average credit score on applications, eviction rate, late-payment / NSF rate, and stable-employment percentage? A property-management company in the area should have these aggregated.
- How much new for-sale + rental construction is in the pipeline within 1–3 miles? Heavy new supply typically softens prices + rents 12–24 months out; constrained supply supports both.
Investment metrics
- 1% rule
- 2.54% ✓
- Cap rate
- 22.05%
- Cash-on-cash
- 56.29%
- DSCR
- 3.50
- GRM
- 3.3
CMA / ARV
- ARV (on-the-fly)
- $85,440
- Comps found
- 6
Show comp detail 6 sales within ~0.75 mi
| Address | Dist | Beds/Ba | Sqft | Sold | Price | $/sf | Match |
|---|---|---|---|---|---|---|---|
| 1976 N East Ave #238 | 0.16mi | 3/2.0 | 1,000 (+4%) | 21mo | $85,000 | $85 | 64 |
| 1976 Ne Ave #263 | 0.17mi | 2/2.0 (-1) | 970 (+1%) | 22mo | $86,500 | $89 | 63 |
| 1976 N East Ave Unit 115 (DARLENE DRIVE) | 0.17mi | 2/1.0 (-1) | 1,000 (+4%) | 22mo | $50,000 | $50 | 62 |
| 456 E Wheat Rd | 0.25mi | 3/1.0 | 1,008 (+5%) | 23mo | $315,000 | $313 | 60 |
| 1704 N Valley Ave | 0.61mi | 3/1.0 | 1,092 (+14%) | 2mo | $314,000 | $288 | 47 |
| 1976 N East Ave Ave #8 | 0.17mi | 2/2.0 (-1) | 1,088 (+13%) | 22mo | $79,000 | $73 | 43 |
Match score weights: distance 35% · size 25% · config 20% · recency 20%. Top-matched comps best support the ARV.
Projected returns pro-forma
-3.0% appreciation · 3.0% rent growth · sell at horizon
- IRR
- 54.7%
- Equity multiple
- 3.41×
- Total profit
- $53,992
- Equity at exit
- $11,928
- IRR
- 59.8%
- Equity multiple
- 6.95×
- Total profit
- $133,315
- Equity at exit
- $6,917
Cash invested: $22,400 (down + closing). Projections, not guarantees.
Landlord ↔ Tenant lean methodology
- Overall (STATE)
- 21 Tenant-Leaning
- State New Jersey
- 21 Tenant-Leaning · D+6
- County
- — inherits STATE
- City
- — inherits STATE
ZIP-level market 08360
- Active inventory
- 173
- Price-to-rent
- 3.3×
Monthly cashflow live
- Estimated rent
- $2,030 medium interval (Pro) →
- Mortgage (P&I)
- −$420
- Tax est. 1.5%
- −$100 /mo · $1,200/yr
- Insurance
- −$33
- HOA
- −$0
- Vacancy / Maint / Mgmt
- −$426
- Net cashflow
- $1,051
Break-even live
UW: 25.0% down · 7.5% · 30yr · 1.5% tax · 5.0% vac · 8.0% maint · 8.0% mgmt
Financing live
Cash to close
- Down payment
- $20,000
- Closing costs
- $2,400
- Reserves months
- —
- Total cash needed
- —
Loan-product check · same deal, 3 products live
Conventional
25% down · 7.5% · 30yr
- Down + closing
- —
- Monthly P&I
- —
- Monthly cashflow
- —
- DSCR
- —
- Eligible?
- —
Personal DTI + credit; lowest rate.
DSCR
20% down · 8.5% · 30yr
- Down + closing
- —
- Monthly P&I
- —
- Monthly cashflow
- —
- DSCR
- —
- Eligible?
- —
No personal income docs; deal must DSCR.
Hard money
10% down · 12.0% · 12mo
- Down + closing
- —
- Monthly P&I
- —
- Monthly cashflow
- —
- DSCR
- —
- Eligible?
- —
Short-term bridge; refi at stabilization.
Listing history 12 events
-
2026-06-09status $80,000 Pending 4 DOM
-
2026-06-03statusdays on market $80,000 Active Under Contract 4 DOM
-
2026-06-02days on market $80,000 Active 3 DOM
-
2026-06-01days on market $80,000 Active 2 DOM
-
2026-05-31days on market $80,000 Active 1 DOM
-
2026-05-30days on market $80,000 Active 2 DOM
-
2026-05-24historical $80,000
-
2025-12-18status Pending
-
2025-12-18historical
-
2025-10-27price $74,999
-
2025-10-10price $84,999
-
2025-08-14$89,900 Active
ⓘ Source: listings_history table (triggers on properties + properties_extension) + one-shot
backfill from property_details.listing_events for pre-trigger history.
Nearby sold comps map
Loading sold comps map…
Walkable amenities ~0.75 mi
Loading nearby amenities…
Taxation est. · year 1
- Rental income
- $24,359
- − Mortgage interest
- −$4,481
- − Property taxes
- −$1,200
- − Insurance
- −$400
- − Repairs & maintenance
- −$1,949
- − Management
- −$1,949
- − Depreciation
- −$2,327
- Taxable income
- $12,053
- Est. tax owed @ 24.0%
- −$2,893
- After-tax cash flow
- $9,717/yr
For passive investors: Depreciation is non-cash, so a rental often shows a tax loss while cash-flowing — sheltering income. Rental losses are passive: they offset passive income freely, and up to $25,000/yr can offset ordinary (W-2) income if you actively participate and your MAGI is under $100k (phasing out to $0 by $150k); unused losses carry forward. On sale, claimed depreciation is recaptured at up to 25%, and gains may owe capital-gains tax (a 1031 exchange can defer both). Figures are a year-1 estimate at your 24.0% rate — not tax advice; consult a CPA.
Condition & rehab AI · 2 photos
This well-maintained 1976 manufactured home is in good condition with recent roof work and a bright open-concept layout. It offers a good return on investment with minor updates that can significantly increase its value.
Value-add opportunities
- Resale Paint exterior trim — Enhances curb appeal and can increase property value.
- Resale Paint interior trim — Improves the home's appearance and can increase property value.
- Both Replace deck railings — Improves safety and enhances curb appeal, attracting more buyers and renters.
- Resale Upgrade appliances — Modern appliances can attract more buyers and increase property value.
- Both Landscaping improvements — Enhances curb appeal and can increase property value for both resale and rental purposes.
Renovation cost estimate screening
Value-add ROI direction
- Resale Paint exterior trim — Enhances curb appeal and can increase property value. ↑
- Resale Paint interior trim — Improves the home's appearance and can increase property value. ↑
- Both Replace deck railings — Improves safety and enhances curb appeal, attracting more buyers and renters. ↑
- Resale Upgrade appliances — Modern appliances can attract more buyers and increase property value. ↑
- Both Landscaping improvements — Enhances curb appeal and can increase property value for both resale and rental purposes. ↑
ⓘ Cost ranges are severity-bucket heuristics (US national rule-of-thumb). Get contractor quotes + a written scope before underwriting a rehab budget.
Schools (NCES district)
- District
- Vineland Public School District
- NCES district ID
- 3416800
- Math proficiency
- 9% ▼ -17.00%
- Reading proficiency
- 34% ▬ 0.00%
- Median HH income
- $51,168
- Composite
- 19.17/100
- National rank
- #8819
- State rank
- #418 of 472 in NJ
Livability — Vineland
- Score
- 66/100
- State rank
- #363
- US rank
- #12180
Category grades
Schools grade is shown separately in the Schools card above.
Census & demographics
- Census place
- Vineland, NJ
- County
- Cumberland County · 80,266 people
- City population
- 45,038
- Metro
- Vineland-Bridgeton, NJ
- Population (ZIP)
- 45,038
- Household income
- $65,359
- Rent vs Own
- Severe rent burden
- 1328.0
Population outlook (Cumberland County) Hauer SSP2
- Today (2025)
- 152,743 people
- By 2030
- 150,373 · -1.6%
- By 2040
- 146,881 · -3.8%
- By 2050
- 142,653 · -6.6%
- By 2075
- 129,468 · -15.2%
- By 2100
- 107,456 · -29.6%
Race, ethnicity, and origin ACS 2023
- Neighborhood character
- Diverse neighborhood (Simpson 0.62)
- Race & ethnicity
- Hispanic / Latino 51% White 32% Two or more races 17% Black 11% Asian 1%
- Hispanic origin (detail)
- Mexican 11% Puerto Rican 33% Dominican 2%
- Common ancestry
- Romanian 2% Subsaharan African 1% Scotch-Irish 1%
- Foreign-born
- 14% · Canada, Jamaica
- Languages at home
- 59% English-only · Spanish 37% Russian/Polish/Slavic 2% Other Indo-European 1%
Political lean MEDSL · Cumberland
- 2024 margin
- Toss-up / Even · D 47.6% · R 51.3% · Other 1.1%
- 2008→2024 swing
- -25.4pp toward R · 2008: 21.6pp · 2024: -3.8pp
- All cycles
- 2024: R+3.8 2020: D+6.0 2016: D+5.3 2012: D+23.1 2008: D+21.6
Not yet ingested
- Civics
- —
Market trends
- HPI YoY
- ▼ -320.06%
- Current HPI
- 278.786
- Rent YoY
- —
- Metro
- Vineland-Bridgeton, NJ
- State GDP YoY
- ▲ 2.05%
- F500 in state
- 34
Industry mix (Fortune 500 HQ in NJ)
| Industry | F500 HQs | Revenue |
|---|---|---|
| Consumer Goods | 3 | $31B |
|
||
| Pharmaceuticals | 2 | $153B |
|
||
| Technology | 2 | $21B |
|
||
| Insurance | 2 | $20B |
|
||
| Healthcare | 2 | $19B |
|
||
| Financial Services | 1 | $70B |
|
||
Price history
-11.0% since first listed6 events — show timeline
- 2026-05-24 Coming Soon $80,000 BRIGHT MLS
- 2025-12-18 Pending — BRIGHT MLS
- 2025-12-18 Listing Removed — BRIGHT MLS
- 2025-10-27 Price Changed $74,999 BRIGHT MLS
- 2025-10-10 Price Changed $84,999 BRIGHT MLS
- 2025-08-14 Listed $89,900 BRIGHT MLS
Cash-flow waterfall
monthlySold comps — $/sqft
last 12 mo · ≤1 miLoading sold comps…