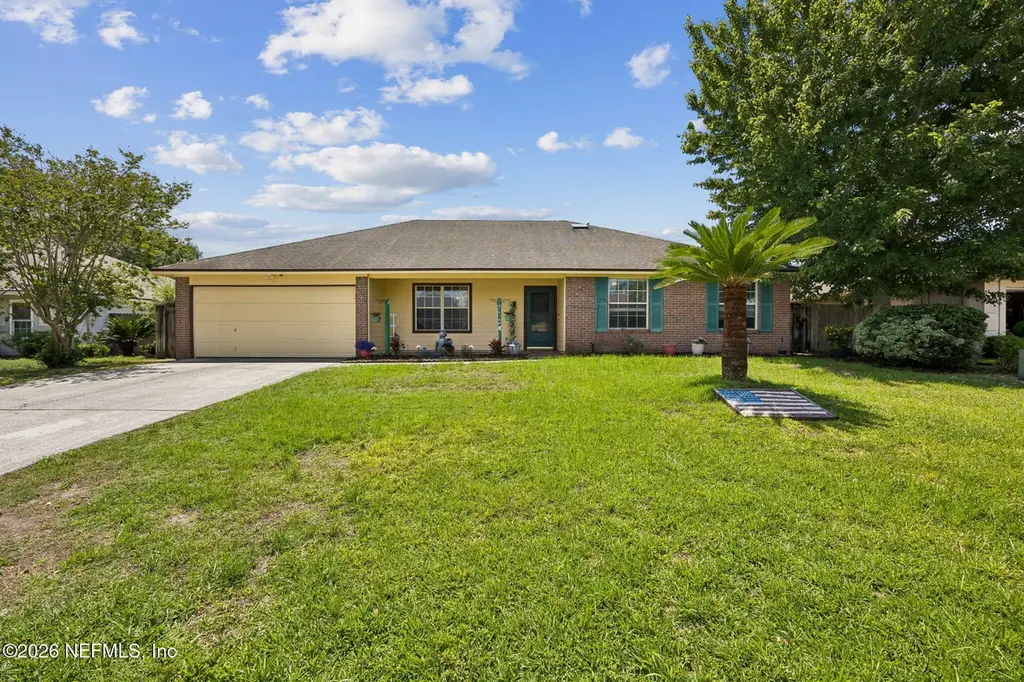
3277 Avalon Dr · Asbury Lake, FL
Flood risk 1/10 · Minimal
- FEMA flood zone
- X (unshaded)
- Chance of flooding over 30 yrs
- 0.0%
- Est. flood insurance / yr
- $507 – $1,088
Fire risk 6/10 · Moderate
- Est. fire insurance / yr
- $947 – $1,759
Heat risk 9/10 · Severe
- Hot days now (above 108°F)
- 7 days/yr
- Hot days in 30 yrs
- 20 days/yr
Wind risk 9/10 · Severe
- Chance of severe wind over 30 yrs
- 99.0%
Air-quality risk 3/10 · Minor
- Unhealthy air days now
- 3 days/yr
- Unhealthy air days in 30 yrs
- 3 days/yr
Risk factors via First Street. Map © Google.
Why this score? — see what drove the D+ grade
The composite is a weighted blend of 9 inputs, each scored 0–100. Each bar is that input's sub-score; the figure is the points it added to the 100-point composite (weight × sub-score).
- ARV discount +14.1/15.0
- Cash flow +13.6/30.0
- Schools +5.1/10.0
- DSCR +4.1/10.0
- Livability +3.1/5.0
- 1% rule +3.0/10.0
- Rent growth +2.6/5.0
- Condition / age +2.5/5.0
- Appreciation +0.0/10.0
$310,000
🖨 Deal sheet (PDF) 📄 Offer letter ✓ Due diligence
Listing remarks MLS
Cont. on financing. Beautiful spacious 4 Br 2 Ba with bonus room. Vaulted ceilings, gas fireplace, screened in patio, yard well & pump, detached work shop for the handy man and a fenced in back yard. A must see! Bring your picky buyers!
Key facts
- 8,712 sq ft lot
- 2 garage spots
- Built 2000
Property features AI
Finance
- HOA & community: Community association with an annual fee of $163; Not a senior community
Exterior
- Parking: Attached 2-car garage with garage door opener
- Utilities: Public sewer; Electricity connected; Water connected; Energy-efficient appliances
- Home design: Single-family residence; One story
- Construction: Brick and wood siding construction
- Exterior features: Front porch (screened); Wood privacy fencing in back yard; Lot approximately 0.2 acres
Interior
- Kitchen: Dishwasher; Electric oven; Electric range; Microwave; Refrigerator
- Bedrooms: 4 bedrooms
- Bathrooms: 2 full bathrooms
- Heating & cooling: Central heating (electric, heat pump); Central air conditioning (electric)
- Interior features: Fireplace (1)
- Laundry & utility: Washer hookup; Electric dryer hookup
Neighborhood map
What this means for you Summary
Snapshot
- This is a 4-bed/2.0-bath single-family listed at $310k.
Deal economics
- At list price, monthly cash flow is $18 ($217/yr) — positive.
- The deal already cash-flows at list — no discount required.
- To meet the 1% rule (rent ≥ 1% of price), the offer needs to be $247k (20.3% below list).
- Recommended offer: $247k (20.3% below list) — sets the bar for 1% rule.
- Cap rate 6.4% vs local median 4.3% in Asbury Lake — top-decile yield for the area; either an underpriced asset or a hidden risk that comps aren't pricing in. Stress-test before assuming the spread holds.
Location & tenants
- Location reads 61/100 on livability (#776 in FL) — a middle-class / working-renter tenant base. Strengths: housing A+, employment A, crime A-; Watch: amenities F, commute F, health & safety F.
- Clay (suburban): math 58% / reading 59% proficiency, ranked #14 of 73 in FL (top 19%) — acceptable for families but not a draw, mixed tenant base, ~2y average lease.
- Zoned schools: Lake Asbury Elementary School (math 69% / reading 64%, grade B+, #473 of 2,144 statewide, top 23%, 975 students, 38% FRL); Lake Asbury Junior High School (math 65% / reading 58%, grade B+, #124 of 571 statewide, top 22%, 1,037 students, 41% FRL); Clay High School (math 37% / reading 53%, grade D-, #228 of 667 statewide, top 35%, 1,666 students, 43% FRL).
- Market conditions: Rents flat; 891 active listings in the ZIP; 9 comparable units currently listed for rent nearby; rentals leasing fast (median 6d on market — plan ~1-2 weeks tenant-placement turnaround); solid renter incomes; 1,876 units permitted in Clay County in 2024 (14 in 5+ unit buildings).
- This rent runs 35% of the median local income ($84k/yr) — at the standard rent-burdened threshold; future hikes will face affordability resistance.
Forward outlook
- Local home prices are declining (-3.0%/yr); year-one equity from $2k of loan paydown is wiped out by about $9k of value loss. Plan a longer hold.
- Clay County population projected at +19% by 2050 — long-run rental-demand tailwind backs the buy-and-hold thesis.
Negotiation context
- Only 7 days on market — expect competitive offers; lowballing is unlikely to land.
- 2 sale attempts since 23y ago with the ask held roughly flat each time — persistent listings suggest the price (not the market) is what's stuck; bring a comps-based counter.
- Current owner paid $156k; list at $310k implies a 98% gain — meaningful room to come down on a strong offer.
Risks & watch-outs
- Climate carrying-cost: severe wind risk, 99% chance of damaging wind over 30y; major wildfire risk; extreme-heat days projected 7→20/yr by 2055 (HVAC capex compounding) — expect insurance premiums to compound above CPI over the hold.
Questions for the listing agent
- What does the HOA fee cover, when was the last increase, and are there any pending special assessments or reserve-fund shortfalls?
- Is there a deadline driving the sale (1031 exchange, divorce, estate, relocation)? That informs how much negotiation room exists.
- Schools are F-rated, which usually means shorter tenancies and higher turnover. Who's the typical renter profile here, and what's been the actual vacancy rate?
- The area grade is low — what's the realistic commute time and amenity access for the typical tenant pool here? Any planned neighborhood developments (good or bad) we should know about?
- What's the average days-on-market for RENTAL listings here right now (not sales)? A rising rental-DOM trend means longer vacancies and softer asking-rent achievability than the comps imply.
- What's the recent tenant-quality profile in this submarket — average credit score on applications, eviction rate, late-payment / NSF rate, and stable-employment percentage? A property-management company in the area should have these aggregated.
- How much new for-sale + rental construction is in the pipeline within 1–3 miles? Heavy new supply typically softens prices + rents 12–24 months out; constrained supply supports both.
Investment metrics
- 1% rule
- 0.80% ✗
- Cap rate
- 6.36%
- Cash-on-cash
- 0.25%
- DSCR
- 1.01
- GRM
- 10.4
CMA / ARV
- ARV (on-the-fly)
- $363,312
- Comps found
- 12
Show comp detail 12 sales within ~0.75 mi
| Address | Dist | Beds/Ba | Sqft | Sold | Price | $/sf | Match |
|---|---|---|---|---|---|---|---|
| 3277 Avalon Dr | 0.00mi | 4/2.0 | 2,088 (0%) | 1mo | $300,000 | $144 | 99 |
| 2474 Glenfield Dr | 0.41mi | 3/2.0 (-1) | 2,025 (-3%) | 1mo | $339,000 | $167 | 70 |
| 2624 Glen Oaks Dr | 0.30mi | 3/2.0 (-1) | 1,947 (-7%) | 2mo | $338,000 | $174 | 68 |
| 3280 Willowleaf Ln | 0.64mi | 4/3.0 | 2,153 (+3%) | 1mo | $389,190 | $181 | 60 |
| 3683 Zydeco Loop | 0.70mi | 4/3.0 | 2,153 (+3%) | 1mo | $408,120 | $190 | 57 |
| 3387 Americana Dr | 0.62mi | 4/3.0 | 2,204 (+6%) | 2mo | $432,990 | $196 | 56 |
| 3640 Zydeco Loop | 0.74mi | 4/2.0 | 1,914 (-8%) | 3mo | $349,990 | $183 | 49 |
| 3481 Americana Dr | 0.63mi | 4/2.0 | 1,775 (-15%) | 0mo | $339,590 | $191 | 45 |
| 3687 Zydeco Loop | 0.70mi | 5/3.0 (+1) | 2,266 (+8%) | 2mo | $378,000 | $167 | 43 |
| 3600 Americana Dr | 0.74mi | 5/3.0 (+1) | 2,266 (+8%) | 0mo | $381,500 | $168 | 42 |
| 3527 Americana Dr | 0.67mi | 5/3.0 (+1) | 2,289 (+10%) | 2mo | $392,990 | $172 | 42 |
| 3313 Willowleaf Ln | 0.70mi | 5/3.5 (+1) | 2,266 (+8%) | 2mo | $374,990 | $165 | 41 |
Match score weights: distance 35% · size 25% · config 20% · recency 20%. Top-matched comps best support the ARV.
Projected returns pro-forma
-3.0% appreciation · 0.46% rent growth · sell at horizon
- IRR
- -18.6%
- Equity multiple
- 0.36×
- Total profit
- $-55,332
- Equity at exit
- $46,222
- IRR
- -16.4%
- Equity multiple
- 0.18×
- Total profit
- $-71,095
- Equity at exit
- $26,803
Cash invested: $86,800 (down + closing). Projections, not guarantees.
Landlord ↔ Tenant lean methodology
- Overall (STATE)
- 87 Strongly Landlord-Friendly
- State Florida
- 87 Strongly Landlord-Friendly · R+3
- County
- — inherits STATE
- City
- — inherits STATE
ZIP-level market 32043
- Home prices YoY
- -26.3%
- Rents YoY
- 0.5%
- Active inventory
- 891
- Price-to-rent
- 10.4×
Monthly cashflow live
- Estimated rent
- $2,472 high interval (Pro) →
- Mortgage (P&I)
- −$1,626
- Tax from tax record
- −$166 /mo · $1,993/yr
- Insurance
- −$129
- HOA
- −$14
- Vacancy / Maint / Mgmt
- −$519
- Net cashflow
- $18
Break-even live
Sensitivity live
| Price | -10% $194 | -5% $106 | +0% $18 | +5% $-70 | +10% $-157 |
|---|---|---|---|---|---|
| Rent | -10% $-177 | -5% $-80 | +0% $18 | +5% $116 | +10% $213 |
| Rate | -1.0pp $174 | -0.5pp $97 | base $18 | +0.5pp $-62 | +1.0pp $-144 |
UW: 25.0% down · 7.5% · 30yr · 1.5% tax · 5.0% vac · 8.0% maint · 8.0% mgmt
Financing live
Cash to close
- Down payment
- $77,500
- Closing costs
- $9,300
- Reserves months
- —
- Total cash needed
- —
Loan-product check · same deal, 3 products live
Conventional
25% down · 7.5% · 30yr
- Down + closing
- —
- Monthly P&I
- —
- Monthly cashflow
- —
- DSCR
- —
- Eligible?
- —
Personal DTI + credit; lowest rate.
DSCR
20% down · 8.5% · 30yr
- Down + closing
- —
- Monthly P&I
- —
- Monthly cashflow
- —
- DSCR
- —
- Eligible?
- —
No personal income docs; deal must DSCR.
Hard money
10% down · 12.0% · 12mo
- Down + closing
- —
- Monthly P&I
- —
- Monthly cashflow
- —
- DSCR
- —
- Eligible?
- —
Short-term bridge; refi at stabilization.
Rent comps 9 comps
| Address | Beds | Baths | Sqft | Rent | $/sqft | DOM | Units | Dist |
|---|---|---|---|---|---|---|---|---|
| 3268 Avalon Dr Green Cove Springs, FL | 4.0 | 2.0 | 1761 | $2,230 | $1.27 | 4d | 1 | 0.06mi |
| 1111 Calla Glen Ln Green Cove Springs, FL | 4.0 | 2.0 | 1980 | $2,160 | $1.09 | 3d | 1 | 0.48mi |
| 2836 Cross Creek Dr Green Cove Springs, FL | 3.0 | 2.0 | 1453 | $1,880 | $1.29 | 13d | 1 | 0.95mi |
| 3349 Citation Dr Green Cove Springs, FL | 3.0 | 2.0 | 1420 | $2,010 | $1.42 | 3d | 1 | 1.06mi |
| 2621 Fernleaf Dr Green Cove Springs, FL | 4.0 | 2.0 | 1870 | $2,135 | $1.14 | 5d | 1 | 1.10mi |
| 2653 Fernleaf Dr Green Cove Springs, FL | 4.0 | 2.0 | 1638 | $2,005 | $1.22 | 9d | 1 | 1.13mi |
| 3664 Arava Dr Green Cove Springs, FL | 3.0 | 2.0 | 1480 | $2,065 | $1.40 | 16d | 1 | 1.18mi |
| 2506 Creekfront Dr Green Cove Springs, FL | 4.0 | 2.0 | 1638 | $2,554 | $1.56 | 25d | 1 | 1.19mi |
| 3445 Shelley Dr Green Cove Springs, FL | 3.0 | 2.0 | 1430 | $1,930 | $1.35 | 3d | 1 | 1.21mi |
HOA detail
- Monthly dues
- $14 · $168/yr
- Likely covers
- gas
Listing history 6 events
-
2026-05-04status Pending
-
2026-04-27$310,000 Active
-
2003-09-04soldstatus $156,500
-
2003-08-19historical 240-char remark
Show marketing remark (240 chars)
Cont. on financing. Beautiful spacious 4 Br 2 Ba with bonus room. Vaulted ceilings, gas fireplace, screened in patio, yard well & pump, detached work shop for the handy man and a fenced in back yard. A must see! Bring your picky buyers!
-
2003-08-18soldstatus $156,500 240-char remark
Show marketing remark (240 chars)
Cont. on financing. Beautiful spacious 4 Br 2 Ba with bonus room. Vaulted ceilings, gas fireplace, screened in patio, yard well & pump, detached work shop for the handy man and a fenced in back yard. A must see! Bring your picky buyers!
-
2003-07-02$157,900 240-char remark
Show marketing remark (240 chars)
Cont. on financing. Beautiful spacious 4 Br 2 Ba with bonus room. Vaulted ceilings, gas fireplace, screened in patio, yard well & pump, detached work shop for the handy man and a fenced in back yard. A must see! Bring your picky buyers!
ⓘ Source: listings_history table (triggers on properties + properties_extension) + one-shot
backfill from property_details.listing_events for pre-trigger history.
Tax reassessment forecast FL · Resets to sale price
- Current annual tax
- $1,993 · $166/mo
- Projected year-2 tax
- $2,573 · $214/mo
- Expected delta
- +$580/yr (+$48/mo · 29.1%)
ⓘ Screening estimate from a state-policy table — verify with the county assessor before closing.
Climate risk First Street
- Flood 1/10 Low FEMA zone X (unshaded) · 0% chance over 30 yrs
- Wildfire 6/10 Major
- Heat 9/10 Extreme 7 d/yr ≥108°F today · 20 d/yr by 30 yrs out
- Wind 9/10 Extreme 99% chance of damaging wind over 30 yrs
- Air quality 3/10 Moderate 3 unhealthy d/yr today · 3 by 30 yrs out
Nearby sold comps map
Loading sold comps map…
Walkable amenities ~0.75 mi
Loading nearby amenities…
Taxation est. · year 1
- Rental income
- $29,666
- − Mortgage interest
- −$17,365
- − Property taxes
- −$1,993
- − Insurance
- −$1,550
- − Repairs & maintenance
- −$2,373
- − Management
- −$2,373
- − HOA
- −$168
- − Depreciation
- −$9,018
- Taxable loss
- −$5,174
- Est. tax savings @ 24.0%
- +$1,242
- After-tax cash flow
- $1,459/yr
For passive investors: Depreciation is non-cash, so a rental often shows a tax loss while cash-flowing — sheltering income. Rental losses are passive: they offset passive income freely, and up to $25,000/yr can offset ordinary (W-2) income if you actively participate and your MAGI is under $100k (phasing out to $0 by $150k); unused losses carry forward. On sale, claimed depreciation is recaptured at up to 25%, and gains may owe capital-gains tax (a 1031 exchange can defer both). Figures are a year-1 estimate at your 24.0% rate — not tax advice; consult a CPA.
Schools (NCES district)
- District
- Clay
- NCES district ID
- 1200300
- Math proficiency
- 58% ▼ -8.00%
- Reading proficiency
- 59% ▼ -3.00%
- Median HH income
- $59,379
- Composite
- 50.73/100
- National rank
- #1815
- State rank
- #14 of 73 in FL
Livability — Asbury Lake
- Score
- 61/100
- State rank
- #776
- US rank
- #17575
Category grades
Schools grade is shown separately in the Schools card above.
Census & demographics
- Census place
- Asbury Lake, FL
- County
- Clay County · 208,450 people
- Metro
- Jacksonville, FL
- Population (ZIP)
- 34,562
- Household income
- $84,145
- Rent vs Own
- Severe rent burden
- 449.0
Population outlook (Clay County) Hauer SSP2
- Today (2025)
- 230,495 people
- By 2030
- 242,427 · +5.2%
- By 2040
- 262,244 · +13.8%
- By 2050
- 275,148 · +19.4%
- By 2075
- 295,397 · +28.2%
- By 2100
- 287,592 · +24.8%
Race, ethnicity, and origin ACS 2023
- Neighborhood character
- Predominantly White (77%)
- Race & ethnicity
- White 77% Black 10% Two or more races 7% Hispanic / Latino 6% Asian 2%
- Hispanic origin (detail)
- Mexican 2% Puerto Rican 1%
- Common ancestry
- Slovak 3% Romanian 2% Lithuanian 2%
- Foreign-born
- 5% · Canada
- Languages at home
- 92% English-only · Spanish 5% French/Haitian/Cajun 1% Other Indo-European 1%
Political lean MEDSL · Clay
- 2024 margin
- Solid R (+39.3) · D 29.9% · R 69.2%
- 2008→2024 swing
- +3.6pp toward D · 2008: -42.8pp · 2024: -39.3pp
- All cycles
- 2024: R+39.3 2020: R+37.1 2016: R+44.3 2012: R+45.8 2008: R+42.8
Not yet ingested
- Civics
- —
Market trends
- HPI YoY
- ▼ -107.34%
- Current HPI
- 301.3212
- Rent YoY
- ▲ 0.46%
- Metro
- Jacksonville, FL
- State GDP YoY
- ▲ 3.28%
- F500 in state
- 36
Industry mix (Fortune 500 HQ in FL)
| Industry | F500 HQs | Revenue |
|---|---|---|
| Industrial Technology | 2 | $29B |
|
||
| Insurance | 2 | $17B |
|
||
| Retail | 1 | $60B |
|
||
| Technology Distribution | 1 | $58B |
|
||
| Homebuilding | 1 | $35B |
|
||
| Technology Manufacturing | 1 | $35B |
|
||
Price history
+96.3% since first listed6 events — show timeline
- 2026-05-04 Pending — realMLS
- 2026-04-27 Listed $310,000 realMLS
- 2003-09-04 Sold (Public Records) $156,500 Public Records
- 2003-08-19 Listing Removed — realMLS
- 2003-08-18 Sold (MLS) $156,500 realMLS
- 2003-07-02 Listed $157,900 realMLS
Property tax history
+2.9%/yrLatest (2025): $1,993 · +4.2% YoY. Source: county tax records.
Cash-flow waterfall
monthlySold comps — $/sqft
last 12 mo · ≤1 miLoading sold comps…