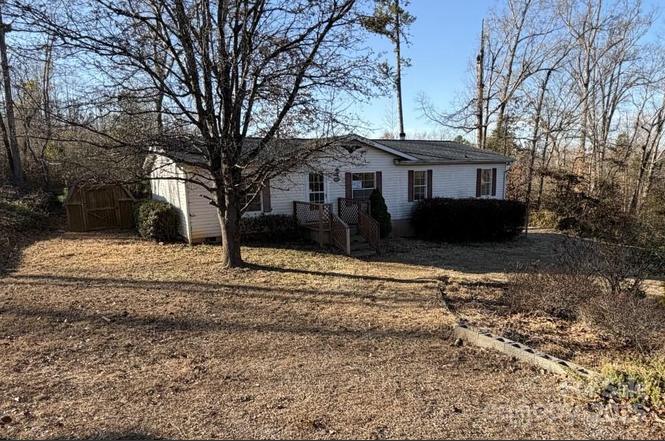
2687 1st Ave NW · Catawba, NC
Flood risk 1/10 · Minimal
- FEMA flood zone
- X (unshaded)
- Chance of flooding over 30 yrs
- 0.0%
- Est. flood insurance / yr
- $507 – $1,088
Fire risk 4/10 · Minor
- Est. fire insurance / yr
- $906 – $1,684
Heat risk 5/10 · Moderate
- Hot days now (above 103°F)
- 7 days/yr
- Hot days in 30 yrs
- 18 days/yr
Wind risk 2/10 · Minimal
- Chance of severe wind over 30 yrs
- 4.0%
Air-quality risk 2/10 · Minimal
- Unhealthy air days now
- 2 days/yr
- Unhealthy air days in 30 yrs
- 2 days/yr
Risk factors via First Street. Map © Google.
Why this score? — see what drove the B- grade
The composite is a weighted blend of 9 inputs, each scored 0–100. Each bar is that input's sub-score; the figure is the points it added to the 100-point composite (weight × sub-score).
- Cash flow +28.7/30.0
- DSCR +10.0/10.0
- ARV discount +7.5/15.0
- 1% rule +7.3/10.0
- Schools +4.5/10.0
- Livability +3.1/5.0
- Rent growth +2.5/5.0
- Condition / age +2.5/5.0
- Appreciation +0.0/10.0
$153,900
🖨 Deal sheet 📄 Offer letter ✓ Due diligence
Listing remarks
A practical single-story residence offering 3 bedrooms and 2 bathrooms with a straightforward layout designed for everyday use. Interior spaces are arranged with defined living and sleeping areas, supported by natural light throughout. The property includes outdoor space suitable for general use and flexibility over time. Conveniently located near Riverbend Park on Lake Hickory, Catawba Springs, and local shopping and dining along NC-16, with access to Hickory, Denver, and surrounding areas. A solid residential option with room to adapt and enhance.
Key facts
- Natural light
- Outdoor space
- Defined living areas
Tags
Property features AI
Finance
- Other: Lot size approximately 0.62 acres; Zoning: R-A; Land is included with the property; Restrictions described as 'Other - See Remarks'
- HOA & community: No HOA
Exterior
- Parking: Driveway (no main level garage)
- Utilities: Public water; Public sewer
- Home design: Manufactured single-family residence; One story; Residential property
- Construction: Vinyl exterior; Composition roof; Crawl space foundation; Construction type: Manufactured
- Exterior features: Back yard fencing; Shed(s) on the property; Cul-de-sac lot; Exterior noted as 'Other - See Remarks'; Road surface includes dirt and other; Publicly maintained road
Interior
- Kitchen: Electric range
- Bedrooms: 3 bedrooms on the main level (sizes: 12' x 16'; 10' x 12'; 10' x 12')
- Flooring: Carpet; Laminate
- Bathrooms: 2 full bathrooms on the main level
- Heating & cooling: Electric heating; Electric cooling
- Interior features: 5 total rooms; Wood-burning fireplace; Basement described as 'Other'; Entry level is main
- Laundry & utility: Laundry located in a common area
Neighborhood map
What this means for you Summary
Snapshot
- This is a 3-bed/2.0-bath manufactured listed at $154k.
Deal economics
- At list price, monthly cash flow is $511 ($6k/yr) — positive.
- The deal already cash-flows at list — no discount required.
- Meets the 1% rule at list price ($2k rent vs $154k).
- Recommended offer: $135k (12.0% below list) — sets the bar for market timing.
- Cap rate 10.3% vs local median 3.9% in Catawba — top-decile yield for the area; either an underpriced asset or a hidden risk that comps aren't pricing in. Stress-test before assuming the spread holds.
Location & tenants
- Location reads 61/100 on livability (#494 in NC) — a middle-class / working-renter tenant base. Strengths: cost of living A+, housing A-, health & safety B; Watch: crime F, amenities F, commute F.
- Catawba County Schools (rural): math 54% / reading 51% proficiency, ranked #54 of 178 in NC (top 30%) — acceptable for families but not a draw, mixed tenant base, ~2y average lease.
- Zoned schools: Catawba Elementary School (math 38% / reading 34%, grade F, #812 of 1,410 statewide, top 58%, 404 students, 70% FRL); Bunker Hill High (math 52% / reading 61%, grade C, #261 of 535 statewide, top 49%, 828 students, 56% FRL) — zoned schools average 63% FRL vs 43% district-wide (20 pts higher); higher-poverty schools than district average — tighter screening recommended.
- Market conditions: 92 active listings in the ZIP; 2,016 units permitted in Catawba County in 2024 (255 in 5+ unit buildings).
Forward outlook
- Local home prices are declining (-3.0%/yr); year-one equity from $1k of loan paydown is wiped out by about $5k of value loss. Plan a longer hold.
- Catawba County population projected to shrink 7% by 2050 — rents likely to lag national; underwrite the cash flow, not the appreciation.
- At projected returns (-3.0% appreciation + 3.0% rent growth), your $43k cash investment doubles in ~9 years — after that, you're playing with house money.
Negotiation context
- It's been on market 142 days — a 12% lower offer ($135k) is reasonable based on typical stale-listing flexibility.
- 4 sale attempts since 2y ago; this cycle's ask has dropped $36k (19%) from the opening price — seller is motivated, your offer sets the floor, not the list.
Risks & watch-outs
- Climate carrying-cost: extreme-heat days projected 7→18/yr by 2055 (HVAC capex compounding) — expect insurance premiums to compound above CPI over the hold.
Questions for the listing agent
- It's been on market 142 days. Have you received any prior offers? Is the seller open to a 12% concession, seller financing, or rate buy-down credit?
- Why hasn't it sold? Are there any deal-killer items the seller is aware of (foundation, flood, title, zoning, code violations)?
- Is there a deadline driving the sale (1031 exchange, divorce, estate, relocation)? That informs how much negotiation room exists.
- Crime grade is F in this area — have there been break-ins, vandalism, or insurance claims at this property in the last 3 years? What carrier currently insures it and at what premium?
- What's the average days-on-market for RENTAL listings here right now (not sales)? A rising rental-DOM trend means longer vacancies and softer asking-rent achievability than the comps imply.
- What's the recent tenant-quality profile in this submarket — average credit score on applications, eviction rate, late-payment / NSF rate, and stable-employment percentage? A property-management company in the area should have these aggregated.
- How much new for-sale + rental construction is in the pipeline within 1–3 miles? Heavy new supply typically softens prices + rents 12–24 months out; constrained supply supports both.
Investment metrics
- 1% rule
- 1.23% ✓
- Cap rate
- 10.28%
- Cash-on-cash
- 14.23%
- DSCR
- 1.63
- GRM
- 6.8
CMA / ARV
No comps found within radius.
Projected returns pro-forma
-3.0% appreciation · 3.0% rent growth · sell at horizon
- IRR
- 4.6%
- Equity multiple
- 1.18×
- Total profit
- $7,590
- Equity at exit
- $22,947
- IRR
- 14.0%
- Equity multiple
- 2.12×
- Total profit
- $48,444
- Equity at exit
- $13,306
Cash invested: $43,092 (down + closing). Projections, not guarantees.
Landlord ↔ Tenant lean methodology
- Overall (STATE)
- 85 Strongly Landlord-Friendly
- State North Carolina
- 85 Strongly Landlord-Friendly · R+3
- County
- — inherits STATE
- City
- — inherits STATE
ZIP-level market 28609
- Home prices YoY
- -9.6%
- Active inventory
- 92
- Price-to-rent
- 6.8×
Monthly cashflow live
- Estimated rent
- $1,897 medium interval (Pro) →
- Mortgage (P&I)
- −$807
- Tax from tax record
- −$117 /mo · $1,398/yr
- Insurance
- −$64
- HOA
- −$0
- Vacancy / Maint / Mgmt
- −$398
- Net cashflow
- $511
Break-even live
UW: 25.0% down · 7.5% · 30yr · 1.5% tax · 5.0% vac · 8.0% maint · 8.0% mgmt
Financing live
Cash to close
- Down payment
- $38,475
- Closing costs
- $4,617
- Reserves months
- —
- Total cash needed
- —
Loan-product check · same deal, 3 products live
Conventional
25% down · 7.5% · 30yr
- Down + closing
- —
- Monthly P&I
- —
- Monthly cashflow
- —
- DSCR
- —
- Eligible?
- —
Personal DTI + credit; lowest rate.
DSCR
20% down · 8.5% · 30yr
- Down + closing
- —
- Monthly P&I
- —
- Monthly cashflow
- —
- DSCR
- —
- Eligible?
- —
No personal income docs; deal must DSCR.
Hard money
10% down · 12.0% · 12mo
- Down + closing
- —
- Monthly P&I
- —
- Monthly cashflow
- —
- DSCR
- —
- Eligible?
- —
Short-term bridge; refi at stabilization.
Listing history 24 events
-
2026-06-18days on market $153,900 Active 142 DOM
-
2026-06-17days on market $153,900 Active 141 DOM
-
2026-06-16days on market $153,900 Active 140 DOM
-
2026-06-15days on market $153,900 Active 139 DOM
-
2026-06-13days on market $153,900 Active 137 DOM
-
2026-06-13days on market $153,900 Active 136 DOM
-
2026-06-09days on market $153,900 Active 133 DOM
-
2026-06-08days on market $153,900 Active 132 DOM
-
2026-06-07days on market $153,900 Active 131 DOM
-
2026-06-04days on market $153,900 Active 128 DOM
-
2026-06-03days on market $153,900 Active 127 DOM
-
2026-06-02days on market $153,900 Active 126 DOM
-
2026-06-01days on market $153,900 Active 125 DOM
-
2026-05-31days on market $153,900 Active 124 DOM
-
2026-05-05status Active
-
2026-04-14status Pending
-
2026-03-24price $153,900
-
2026-02-23price $171,000
-
2026-01-06$190,000 Active
-
2025-01-17price $209,500
-
2024-10-28price $216,500
-
2024-08-31price $219,000
-
2024-08-27status Active
-
2024-08-02$234,500 Active
ⓘ Source: listings_history table (triggers on properties + properties_extension) + one-shot
backfill from property_details.listing_events for pre-trigger history.
Tax reassessment forecast NC · Resets to sale price
- Current annual tax
- $1,398 · $117/mo
- Projected year-2 tax
- $1,398 · $117/mo
- Expected delta
- $0/yr ($0/mo · -0.0%)
ⓘ Screening estimate from a state-policy table — verify with the county assessor before closing.
Climate risk First Street
- Flood 1/10 Low FEMA zone X (unshaded) · 0% chance over 30 yrs
- Wildfire 4/10 Moderate
- Heat 5/10 Major 7 d/yr ≥103°F today · 18 d/yr by 30 yrs out
- Wind 2/10 Low 4% chance of damaging wind over 30 yrs
- Air quality 2/10 Low 2 unhealthy d/yr today · 2 by 30 yrs out
Nearby sold comps map
Loading sold comps map…
Walkable amenities ~0.75 mi
Loading nearby amenities…
Taxation est. · year 1
- Rental income
- $22,765
- − Mortgage interest
- −$8,621
- − Property taxes
- −$1,398
- − Insurance
- −$770
- − Repairs & maintenance
- −$1,821
- − Management
- −$1,821
- − Depreciation
- −$4,477
- Taxable income
- $3,857
- Est. tax owed @ 24.0%
- −$926
- After-tax cash flow
- $5,206/yr
For passive investors: Depreciation is non-cash, so a rental often shows a tax loss while cash-flowing — sheltering income. Rental losses are passive: they offset passive income freely, and up to $25,000/yr can offset ordinary (W-2) income if you actively participate and your MAGI is under $100k (phasing out to $0 by $150k); unused losses carry forward. On sale, claimed depreciation is recaptured at up to 25%, and gains may owe capital-gains tax (a 1031 exchange can defer both). Figures are a year-1 estimate at your 24.0% rate — not tax advice; consult a CPA.
Schools (NCES district)
- District
- Catawba County Schools
- NCES district ID
- 3700690
- Math proficiency
- 54% ▲ 9.00%
- Reading proficiency
- 51% ▲ 3.00%
- Median HH income
- $48,180
- Composite
- 44.71/100
- National rank
- #2754
- State rank
- #54 of 178 in NC
Livability — Catawba
- Score
- 61/100
- State rank
- #494
- US rank
- #18075
Category grades
Schools grade is shown separately in the Schools card above.
Census & demographics
- Census place
- Catawba, NC
- Population (ZIP)
- 6,617
Population outlook (Catawba County) Hauer SSP2
- Today (2025)
- 156,513 people
- By 2030
- 155,267 · -0.8%
- By 2040
- 151,110 · -3.5%
- By 2050
- 145,524 · -7.0%
- By 2075
- 134,047 · -14.4%
- By 2100
- 119,424 · -23.7%
Race, ethnicity, and origin ACS 2023
- Neighborhood character
- Predominantly White (78%)
- Race & ethnicity
- White 78% Hispanic / Latino 13% Two or more races 9% Black 5%
- Hispanic origin (detail)
- Mexican 9% Puerto Rican 2%
- Common ancestry
- Serbian 2% Italian 2% Romanian 2%
- Foreign-born
- 5% · Canada
- Languages at home
- 94% English-only · Spanish 5% Other Indo-European 1%
Political lean MEDSL · Catawba
- 2024 margin
- Solid R (+38.0) · D 30.6% · R 68.6%
- 2008→2024 swing
- -13.0pp toward R · 2008: -25.0pp · 2024: -38.0pp
- All cycles
- 2024: R+38.0 2020: R+37.0 2016: R+38.0 2012: R+29.6 2008: R+25.0
Not yet ingested
- Civics
- —
Market trends
- HPI YoY
- ▼ -29.61%
- Current HPI
- 277.7327
- Rent YoY
- —
- Metro
- —
- State GDP YoY
- ▲ 3.28%
- F500 in state
- 26
Industry mix (Fortune 500 HQ in NC)
| Industry | F500 HQs | Revenue |
|---|---|---|
| Financial Services | 2 | $213B |
|
||
| Retail | 2 | $95B |
|
||
| Industrial Conglomerate | 1 | $38B |
|
||
| Metals / Steel | 1 | $35B |
|
||
| Utilities | 1 | $30B |
|
||
| Industrial Machinery | 1 | $19B |
|
||
Price history
-34.4% since first listed10 events — show timeline
- 2026-05-05 Relisted — CANOPYMLS as Distributed by MLS Grid
- 2026-04-14 Pending — CANOPYMLS as Distributed by MLS Grid
- 2026-03-24 Price Changed $153,900 CANOPYMLS as Distributed by MLS Grid
- 2026-02-23 Price Changed $171,000 CANOPYMLS as Distributed by MLS Grid
- 2026-01-06 Listed $190,000 CANOPYMLS as Distributed by MLS Grid
- 2025-01-17 Price Changed $209,500 CANOPYMLS as Distributed by MLS Grid
- 2024-10-28 Price Changed $216,500 CANOPYMLS as Distributed by MLS Grid
- 2024-08-31 Price Changed $219,000 CANOPYMLS as Distributed by MLS Grid
- 2024-08-27 Relisted — CANOPYMLS as Distributed by MLS Grid
- 2024-08-02 Listed $234,500 CANOPYMLS as Distributed by MLS Grid
Property tax history
+6.2%/yrLatest (2024): $1,398 · +12.5% YoY. Source: county tax records.
Cash-flow waterfall
monthlySold comps — $/sqft
last 12 mo · ≤1 miLoading sold comps…