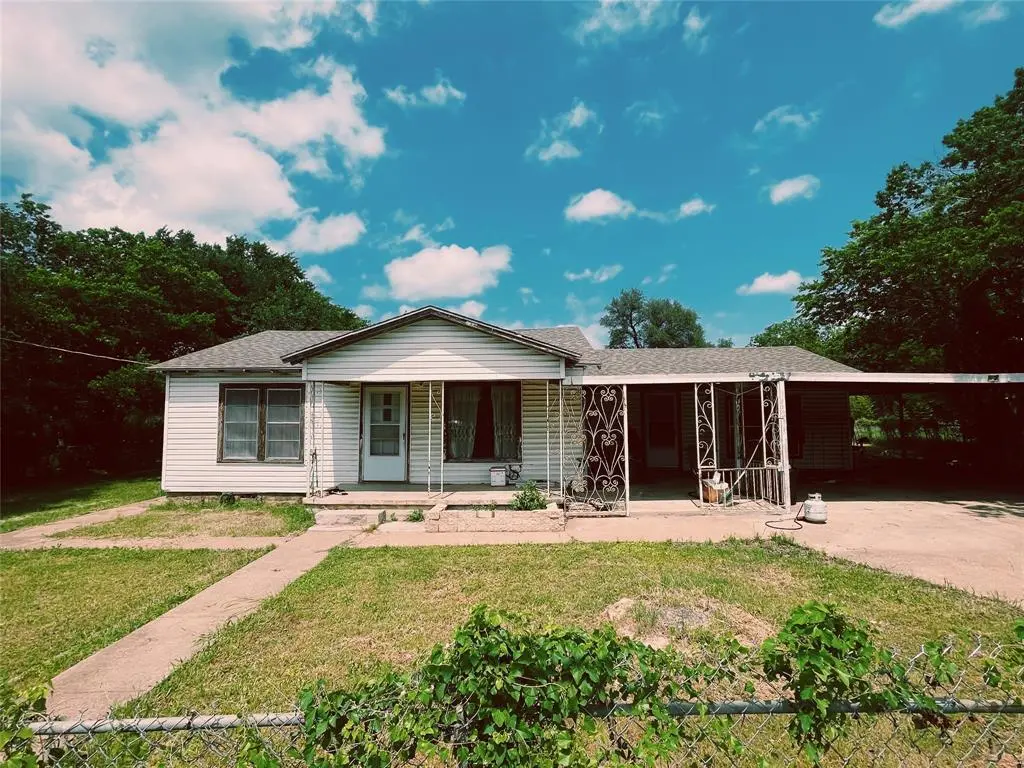
7008 Greenbriar Crescent St · Lake Worth, TX
Flood risk 1/10 · Minimal
- FEMA flood zone
- X (unshaded)
- Chance of flooding over 30 yrs
- 0.0%
- Est. flood insurance / yr
- $507 – $1,088
Fire risk 3/10 · Minor
- Est. fire insurance / yr
- $1,222 – $2,270
Heat risk 7/10 · Major
- Hot days now (above 109°F)
- 7 days/yr
- Hot days in 30 yrs
- 23 days/yr
Wind risk 4/10 · Minor
- Chance of severe wind over 30 yrs
- 24.0%
Air-quality risk 3/10 · Minor
- Unhealthy air days now
- 3 days/yr
- Unhealthy air days in 30 yrs
- 4 days/yr
Risk factors via First Street. Map © Google.
Why this score? — see what drove the C+ grade
The composite is a weighted blend of 9 inputs, each scored 0–100. Each bar is that input's sub-score; the figure is the points it added to the 100-point composite (weight × sub-score).
- Cash flow +24.9/30.0
- ARV discount +15.0/15.0
- DSCR +8.1/10.0
- 1% rule +5.8/10.0
- Livability +3.6/5.0
- Rent growth +2.6/5.0
- Condition / age +2.5/5.0
- Schools +1.4/10.0
- Appreciation +0.0/10.0
$180,000
🖨 Deal sheet 📄 Offer letter ✓ Due diligence
Listing remarks MLS
Great opportunity in an established Lake Worth neighborhood with strong underlying value in the layout, lot, and location. This home offers several features that are increasingly hard to find in this price range, including a split-bedroom arrangement, a large kitchen and dining area with abundant storage and workspace, and generously sized bedrooms and bathrooms with good storage throughout. The front living area is filled with natural light from its many windows, and the large hall bath adds to the home’s functional appeal. Outside, the property offers a secure fenced yard and driveway with gated access, a 3-car carport, a large backyard, and a back porch that is perfect for enjoying a quiet morning or evening outdoors. The home does need work, but the value here is clear: a spacious and practical layout, a useful lot, and a convenient Lake Worth location with access to Lake Worth ISD, nearby parks, and local recreation like nearby Lake Worth Park offers athletic fields, a playground, and a skate park. The home is conveniently located about one mile from major shopping and restaurants.
Key facts
- Secure fenced yard
- 0.37 acre lot
- 2 parking spots
Tags
Neighborhood map
What this means for you Summary
Snapshot
- This is a 3-bed/1.0-bath single-family listed at $180k.
Deal economics
- At list price, monthly cash flow is $384 ($5k/yr) — positive.
- The deal already cash-flows at list — no discount required.
- Meets the 1% rule at list price ($2k rent vs $180k).
- Recommended offer: $169k (6.0% below list) — sets the bar for market timing.
- Cap rate 8.9% vs local median 5.3% in Lake Worth — top-decile yield for the area; either an underpriced asset or a hidden risk that comps aren't pricing in. Stress-test before assuming the spread holds.
Location & tenants
- Location reads 72/100 on livability (#269 in TX) — a middle-class / working-renter tenant base. Strengths: cost of living A+, housing A+, health & safety A+; Watch: schools F, crime F, commute F.
- Lake Worth ISD (suburban): math 12% / reading 22% proficiency, ranked #801 of 826 in TX (top 97%) — low school quality limits family demand, transient renter base, plan for 1-2y turnover; 73% free/reduced lunch — lower-income household profile, screen leases tightly.
- Market conditions: Rents flat; 157 active listings in the ZIP; 27 comparable units currently listed for rent nearby; rentals at typical pace (median 21d on market — plan ~3-4 weeks tenant-placement turnaround); 18,938 units permitted in Tarrant County in 2024 (8,336 in 5+ unit buildings).
- This rent runs 31% of the median local income ($75k/yr) — at the standard rent-burdened threshold; future hikes will face affordability resistance.
Forward outlook
- Local home prices are declining (-3.0%/yr); year-one equity from $1k of loan paydown is wiped out by about $5k of value loss. Plan a longer hold.
- Tarrant County population projected at +41% by 2050 — long-run rental-demand tailwind backs the buy-and-hold thesis.
Negotiation context
- It's been on market 63 days — a 6% lower offer ($169k) is reasonable based on typical stale-listing flexibility.
Risks & watch-outs
- Watch-outs: built in 1948 — expect roof / HVAC / electrical / plumbing capex.
- Climate carrying-cost: extreme-heat days projected 7→23/yr by 2055 (HVAC capex compounding) — expect insurance premiums to compound above CPI over the hold.
Questions for the listing agent
- It's been on market 63 days. Have you received any prior offers? Is the seller open to a 6% concession, seller financing, or rate buy-down credit?
- Built in 1948 — when were the roof, HVAC, electrical panel, plumbing, and water heater last replaced?
- Why hasn't it sold? Are there any deal-killer items the seller is aware of (foundation, flood, title, zoning, code violations)?
- Is there a deadline driving the sale (1031 exchange, divorce, estate, relocation)? That informs how much negotiation room exists.
- Schools are F-rated, which usually means shorter tenancies and higher turnover. Who's the typical renter profile here, and what's been the actual vacancy rate?
- Crime grade is F in this area — have there been break-ins, vandalism, or insurance claims at this property in the last 3 years? What carrier currently insures it and at what premium?
- What's the average days-on-market for RENTAL listings here right now (not sales)? A rising rental-DOM trend means longer vacancies and softer asking-rent achievability than the comps imply.
- What's the recent tenant-quality profile in this submarket — average credit score on applications, eviction rate, late-payment / NSF rate, and stable-employment percentage? A property-management company in the area should have these aggregated.
- How much new for-sale + rental construction is in the pipeline within 1–3 miles? Heavy new supply typically softens prices + rents 12–24 months out; constrained supply supports both.
Investment metrics
- 1% rule
- 1.08% ✓
- Cap rate
- 8.85%
- Cash-on-cash
- 9.14%
- DSCR
- 1.41
- GRM
- 7.7
CMA / ARV
- ARV (median comp)
- $222,448
- List price
- $180,000
- Delta
- -19.08%
- Verdict
- UNDERPRICED
- Comps
- 20 within 1.0 mi
Show comp detail 12 sales within ~0.75 mi
| Address | Dist | Beds/Ba | Sqft | Sold | Price | $/sf | Match |
|---|---|---|---|---|---|---|---|
| 4536 Hodgkins Rd | 0.22mi | 3/2.0 | 1,442 (-2%) | 5mo | $269,900 | $187 | 79 |
| 7000 Alice Rd | 0.06mi | 3/2.0 | 1,589 (+8%) | 5mo | $250,000 | $157 | 75 |
| 3900 Caddo Trl | 0.62mi | 3/1.0 | 1,414 (-3%) | 1mo | $249,900 | $177 | 65 |
| 4809 Maryannes Meadow Dr | 0.68mi | 3/2.0 | 1,418 (-3%) | 1mo | $199,900 | $141 | 58 |
| 4012 Tejas Trl | 0.49mi | 4/2.0 (+1) | 1,410 (-4%) | 6mo | $244,985 | $174 | 57 |
| 3908 Tejas Trl | 0.59mi | 2/2.0 (-1) | 1,410 (-4%) | 0mo | $219,750 | $156 | 57 |
| 4236 Sue Ct | 0.58mi | 3/2.0 | 1,341 (-8%) | 9mo | $257,000 | $192 | 47 |
| 6500 Chapel Ln | 0.61mi | 3/2.0 | 1,610 (+10%) | 8mo | $230,000 | $143 | 44 |
| 4501 Norris Valley Dr | 0.66mi | 3/2.0 | 1,291 (-12%) | 2mo | $208,000 | $161 | 44 |
| 7517 Katie Joyce Ct | 0.60mi | 3/2.0 | 1,308 (-11%) | 10mo | $280,000 | $214 | 42 |
| 4233 Ridgecrest Cir | 0.67mi | 3/2.0 | 1,253 (-14%) | 9mo | $189,900 | $152 | 33 |
| 3904 Caddo Trl | 0.61mi | 2/2.0 (-1) | 1,654 (+13%) | 10mo | $249,000 | $151 | 32 |
Match score weights: distance 35% · size 25% · config 20% · recency 20%. Top-matched comps best support the ARV.
Projected returns pro-forma
-3.0% appreciation · 0.48% rent growth · sell at horizon
- IRR
- -5.2%
- Equity multiple
- 0.81×
- Total profit
- $-9,549
- Equity at exit
- $26,839
- IRR
- 1.4%
- Equity multiple
- 1.09×
- Total profit
- $4,331
- Equity at exit
- $15,563
Cash invested: $50,400 (down + closing). Projections, not guarantees.
Landlord ↔ Tenant lean methodology
- Overall (STATE)
- 87 Strongly Landlord-Friendly
- State Texas
- 87 Strongly Landlord-Friendly · R+5
- County
- — inherits STATE
- City
- — inherits STATE
ZIP-level market 76135
- Home prices YoY
- -17.3%
- Rents YoY
- 0.5%
- Active inventory
- 157
- Price-to-rent
- 7.7×
Monthly cashflow live
- Estimated rent
- $1,939 high interval (Pro) →
- Mortgage (P&I)
- −$944
- Tax from tax record
- −$129 /mo · $1,545/yr
- Insurance
- −$75
- HOA
- −$0
- Vacancy / Maint / Mgmt
- −$407
- Net cashflow
- $384
Break-even live
UW: 25.0% down · 7.5% · 30yr · 1.5% tax · 5.0% vac · 8.0% maint · 8.0% mgmt
Financing live
Cash to close
- Down payment
- $45,000
- Closing costs
- $5,400
- Reserves months
- —
- Total cash needed
- —
Loan-product check · same deal, 3 products live
Conventional
25% down · 7.5% · 30yr
- Down + closing
- —
- Monthly P&I
- —
- Monthly cashflow
- —
- DSCR
- —
- Eligible?
- —
Personal DTI + credit; lowest rate.
DSCR
20% down · 8.5% · 30yr
- Down + closing
- —
- Monthly P&I
- —
- Monthly cashflow
- —
- DSCR
- —
- Eligible?
- —
No personal income docs; deal must DSCR.
Hard money
10% down · 12.0% · 12mo
- Down + closing
- —
- Monthly P&I
- —
- Monthly cashflow
- —
- DSCR
- —
- Eligible?
- —
Short-term bridge; refi at stabilization.
Rent comps 27 comps
| Address | Beds | Baths | Sqft | Rent | $/sqft | DOM | Units | Dist |
|---|---|---|---|---|---|---|---|---|
| 4400 Hodgkins Rd Lake Worth, TX | 4.0 | 1.0 | 1788 | $2,000 | $1.12 | 20d | 1 | 0.17mi |
| 7104 Foster Dr Fort Worth, TX | 4.0 | 2.0 | 1476 | $1,925 | $1.30 | 7d | 1 | 0.40mi |
| 4025 Caddo Trl Fort Worth, TX | 3.0 | 2.0 | 1382 | $1,750 | $1.27 | 43d | 1 | 0.46mi |
| 4009 Caddo Trl Fort Worth, TX | 3.0 | 1.0 | 1237 | $1,850 | $1.50 | 43d | 1 | 0.51mi |
| 4009 Shawnee Trl Fort Worth, TX | 3.0 | 2.0 | 1496 | $1,801 | $1.20 | 43d | 1 | 0.53mi |
| 3901 Dakota Trl Fort Worth, TX | 3.0 | 2.0 | 1481 | $1,990 | $1.34 | 43d | 1 | 0.61mi |
| 4920 Lemon Grove Dr Fort Worth, TX | 3.0 | 2.0 | 1608 | $2,075 | $1.29 | 20d | 1 | 0.62mi |
| 4804 Deal Dr Fort Worth, TX | 3.0 | 2.0 | 1325 | $1,995 | $1.51 | 6d | 1 | 0.63mi |
| 4809 Maryannes Meadow Dr Fort Worth, TX | 3.0 | 2.5 | 1418 | $2,200 | $1.55 | 7d | 1 | 0.68mi |
| 6424 Canyon Trl Fort Worth, TX | 3.0 | 2.0 | 1801 | $2,160 | $1.20 | 12d | 1 | 0.70mi |
| 4109 Ridgecrest Cir Lake Worth, TX | 3.0 | 2.0 | 1640 | $1,850 | $1.13 | 20d | 1 | 0.78mi |
| 6251 Shadydell Dr Fort Worth, TX | 2.0 | 1.0 | 1009 | $1,695 | $1.68 | 17d | 1 | 0.98mi |
| 6721 Lake Overlook Dr Fort Worth, TX | 3.0 | 2.0 | 1602 | $2,400 | $1.50 | 43d | 1 | 1.01mi |
| 3465 Vista Highlands Ln Fort Worth, TX | 3.0 | 2.5 | 1708 | $2,200 | $1.29 | 43d | 1 | 1.03mi |
| 6655 Calgary Ln Fort Worth, TX | 1.0–3.0 | 1.0–2.0 | 949 | $1,359 | $1.43 | 43d | 1 | 1.13mi |
| 6201 Azle Ave Fort Worth, TX | 1.0–3.0 | 1.0–2.0 | 1039 | $2,176 | $2.09 | 1d | 23 | 1.18mi |
| 3217 Huron Trl Fort Worth, TX | 3.0 | 2.0 | 1108 | $1,850 | $1.67 | 43d | 1 | 1.20mi |
| 5947 Shadydell Dr Fort Worth, TX | 2.0 | 1.5 | 1088 | $1,350 | $1.24 | 20d | 1 | 1.30mi |
| 5935 Shadydell Dr Fort Worth, TX | 2.0 | 1.5 | 1088 | $1,300 | $1.19 | 24d | 1 | 1.32mi |
| 4729 Oarlock Dr Fort Worth, TX | 3.0 | 2.0 | 1384 | $1,700 | $1.23 | 12d | 1 | 1.32mi |
| 4517 Compass Ct Fort Worth, TX | 2.0 | 2.0 | 981 | $1,700 | $1.73 | 2d | 1 | 1.35mi |
| 4517 Compass Ct Fort Worth, TX | 2.0 | 2.0 | 1012 | $1,700 | $1.68 | 18d | 1 | 1.35mi |
| 7521 Pawnee Trl Lake Worth, TX | 2.0 | 2.0 | 972 | $1,600 | $1.65 | 2d | 1 | 1.37mi |
| 5911 Shadydell Dr Fort Worth, TX | 2.0 | 1.5 | 1088 | $1,350 | $1.24 | 24d | 1 | 1.38mi |
| 5837 Shadydell Dr Fort Worth, TX | 2.0 | 1.5 | 1155 | $1,500 | $1.30 | 22d | 1 | 1.46mi |
| 5829 Shadydell Dr Fort Worth, TX | 2.0 | 1.5 | 1088 | $1,400 | $1.29 | 24d | 1 | 1.48mi |
| 5825 Shadydell Dr #5829 Fort Worth, TX | 2.0 | 1.5 | 1088 | $1,400 | $1.29 | 24d | 1 | 1.48mi |
Listing history 16 events
-
2026-06-18days on market $180,000 Active 63 DOM
-
2026-06-17days on market $180,000 Active 62 DOM
-
2026-06-16days on market $180,000 Active 61 DOM
-
2026-06-15days on market $180,000 Active 60 DOM
-
2026-06-13days on market $180,000 Active 58 DOM
-
2026-06-13days on market $180,000 Active 57 DOM
-
2026-06-09days on market $180,000 Active 54 DOM
-
2026-06-08days on market $180,000 Active 53 DOM
-
2026-06-07pricedays on market $180,000 Active 52 DOM
-
2026-06-04days on market $199,900 Active 49 DOM
-
2026-06-03days on market $199,900 Active 48 DOM
-
2026-06-02days on market $199,900 Active 47 DOM
-
2026-06-01days on market $199,900 Active 46 DOM
-
2026-05-31days on market $199,900 Active 45 DOM
-
2026-04-16$199,900 Active 1109-char remark
Show marketing remark (1109 chars)
Great opportunity in an established Lake Worth neighborhood with strong underlying value in the layout, lot, and location. This home offers several features that are increasingly hard to find in this price range, including a split-bedroom arrangement, a large kitchen and dining area with abundant storage and workspace, and generously sized bedrooms and bathrooms with good storage throughout. The front living area is filled with natural light from its many windows, and the large hall bath adds to the home’s functional appeal. Outside, the property offers a secure fenced yard and driveway with gated access, a 3-car carport, a large backyard, and a back porch that is perfect for enjoying a quiet morning or evening outdoors. The home does need work, but the value here is clear: a spacious and practical layout, a useful lot, and a convenient Lake Worth location with access to Lake Worth ISD, nearby parks, and local recreation like nearby Lake Worth Park offers athletic fields, a playground, and a skate park. The home is conveniently located about one mile from major shopping and restaurants.
-
1989-08-22soldstatus
ⓘ Source: listings_history table (triggers on properties + properties_extension) + one-shot
backfill from property_details.listing_events for pre-trigger history.
Tax reassessment forecast TX · Resets to sale price
- Current annual tax
- $1,545 · $129/mo
- Projected year-2 tax
- $3,294 · $274/mo
- Expected delta
- +$1,749/yr (+$146/mo · 113.2%)
ⓘ Screening estimate from a state-policy table — verify with the county assessor before closing.
Climate risk First Street
- Flood 1/10 Low FEMA zone X (unshaded) · 0% chance over 30 yrs
- Wildfire 3/10 Moderate
- Heat 7/10 Severe 7 d/yr ≥109°F today · 23 d/yr by 30 yrs out
- Wind 4/10 Moderate 24% chance of damaging wind over 30 yrs
- Air quality 3/10 Moderate 3 unhealthy d/yr today · 4 by 30 yrs out
Nearby sold comps map
Loading sold comps map…
Walkable amenities ~0.75 mi
Loading nearby amenities…
Taxation est. · year 1
- Rental income
- $23,263
- − Mortgage interest
- −$10,083
- − Property taxes
- −$1,545
- − Insurance
- −$900
- − Repairs & maintenance
- −$1,861
- − Management
- −$1,861
- − Depreciation
- −$5,236
- Taxable income
- $1,777
- Est. tax owed @ 24.0%
- −$426
- After-tax cash flow
- $4,179/yr
For passive investors: Depreciation is non-cash, so a rental often shows a tax loss while cash-flowing — sheltering income. Rental losses are passive: they offset passive income freely, and up to $25,000/yr can offset ordinary (W-2) income if you actively participate and your MAGI is under $100k (phasing out to $0 by $150k); unused losses carry forward. On sale, claimed depreciation is recaptured at up to 25%, and gains may owe capital-gains tax (a 1031 exchange can defer both). Figures are a year-1 estimate at your 24.0% rate — not tax advice; consult a CPA.
Schools (NCES district)
- District
- Lake Worth ISD
- NCES district ID
- 4826490
- Math proficiency
- 12% ▼ -13.00%
- Reading proficiency
- 22% ▼ -5.00%
- Median HH income
- $39,451
- Composite
- 14.38/100
- National rank
- #9436
- State rank
- #801 of 826 in TX
Livability — Lake Worth
- Score
- 72/100
- State rank
- #269
- US rank
- #6300
Category grades
Schools grade is shown separately in the Schools card above.
Census & demographics
- Census place
- Lake Worth, TX
- County
- Tarrant County · 2,033,669 people
- Metro
- Dallas-Fort Worth-Arlington, TX
- Population (ZIP)
- 19,445
- Household income
- $74,621
- Rent vs Own
- Severe rent burden
- 798.0
Population outlook (Tarrant County) Hauer SSP2
- Today (2025)
- 2,380,417 people
- By 2030
- 2,578,900 · +8.3%
- By 2040
- 2,974,995 · +25.0%
- By 2050
- 3,350,489 · +40.8%
- By 2075
- 4,216,909 · +77.2%
- By 2100
- 4,741,527 · +99.2%
Race, ethnicity, and origin ACS 2023
- Neighborhood character
- Majority White (63%)
- Race & ethnicity
- White 63% Hispanic / Latino 26% Two or more races 11% Black 8%
- Hispanic origin (detail)
- Mexican 22%
- Common ancestry
- Italian 2% Romanian 2% Russian 2%
- Foreign-born
- 7% · Canada, Jamaica
- Languages at home
- 80% English-only · Spanish 19% Russian/Polish/Slavic 1%
Political lean MEDSL · Tarrant
- 2024 margin
- Lean R (+5.1) · D 46.7% · R 51.9% · Other 1.4%
- 2008→2024 swing
- +6.6pp toward D · 2008: -11.7pp · 2024: -5.1pp
- All cycles
- 2024: R+5.1 2020: D+0.2 2016: R+8.7 2012: R+15.7 2008: R+11.7
Not yet ingested
- Civics
- —
Market trends
- HPI YoY
- ▼ -63.93%
- Current HPI
- 305.0929
- Rent YoY
- ▲ 0.48%
- Metro
- Dallas-Fort Worth-Arlington, TX
- State GDP YoY
- ▲ 3.95%
- F500 in state
- 110
Industry mix (Fortune 500 HQ in TX)
| Industry | F500 HQs | Revenue |
|---|---|---|
| Energy | 16 | $1,198B |
|
||
| Technology | 5 | $198B |
|
||
| Engineering / Construction | 4 | $72B |
|
||
| Energy Services | 3 | $60B |
|
||
| Utilities | 3 | $41B |
|
||
| Healthcare | 2 | $330B |
|
||
Price history
2 events — show timeline
- 2026-04-16 Listed $199,900 NTREIS
- 1989-08-22 Sold (Public Records) — Public Records
Property tax history
-1.1%/yrLatest (2025): $1,545 · +32.0% YoY. Source: county tax records.
Cash-flow waterfall
monthlySold comps — $/sqft
last 12 mo · ≤1 miLoading sold comps…