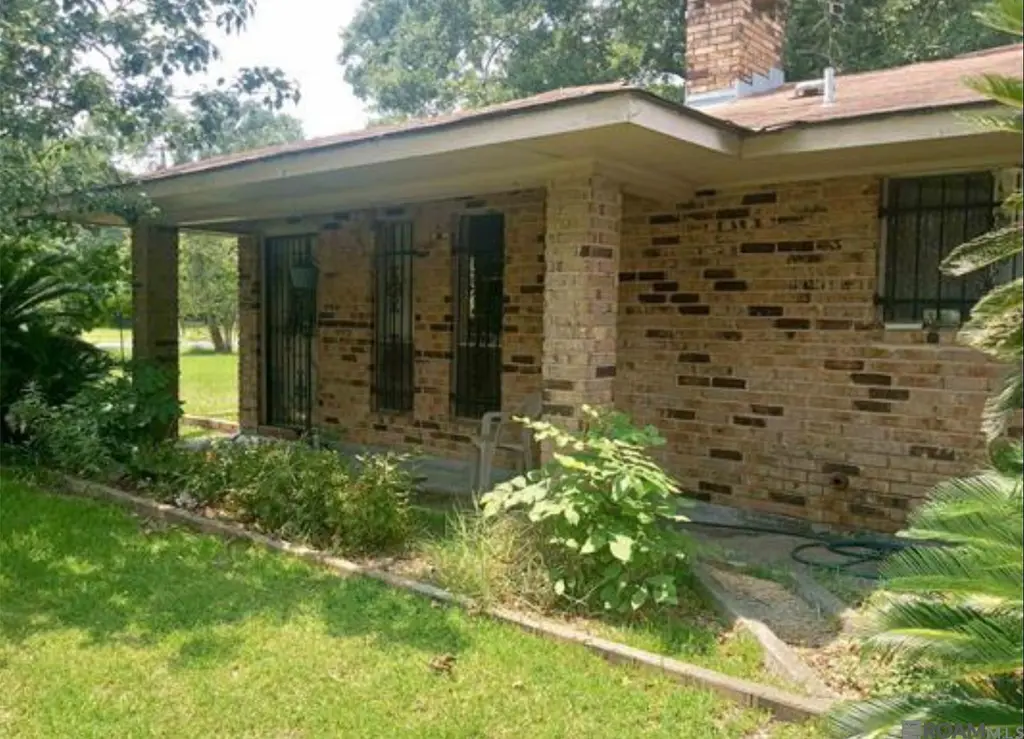
211 Lakecrest Ave · Baton Rouge, LA
Flood risk 1/10 · Minimal
- FEMA flood zone
- X (unshaded)
- Chance of flooding over 30 yrs
- 0.0%
- Est. flood insurance / yr
- $507 – $1,088
Fire risk 1/10 · Minimal
- Est. fire insurance / yr
- $1,269 – $2,357
Heat risk 8/10 · Major
- Hot days now (above 108°F)
- 7 days/yr
- Hot days in 30 yrs
- 21 days/yr
Wind risk 9/10 · Severe
- Chance of severe wind over 30 yrs
- 99.0%
Air-quality risk 2/10 · Minimal
- Unhealthy air days now
- 1 days/yr
- Unhealthy air days in 30 yrs
- 1 days/yr
Risk factors via First Street. Map © Google.
Why this score? — see what drove the B- grade
The composite is a weighted blend of 9 inputs, each scored 0–100. Each bar is that input's sub-score; the figure is the points it added to the 100-point composite (weight × sub-score).
- Cash flow +24.8/30.0
- ARV discount +13.8/15.0
- DSCR +8.0/10.0
- 1% rule +6.4/10.0
- Appreciation +4.6/10.0
- Livability +3.7/5.0
- Rent growth +2.5/5.0
- Condition / age +2.5/5.0
- Schools +2.4/10.0
$127,500
🖨 Deal sheet 📄 Offer letter ✓ Due diligence
Listing remarks MLS
THIS HOME IS A 3 BEDROOM / 2 BATH HOME POSSESSING TONS OF POTENTIAL FOR ITS NEXT INVESTOR. IF YOU ARE READY TO TAKE ON THIS HOME AND BRING YOUR VISION TO LIFE, PLEASE DON'T HESITATE TO SCHEDULE YOUR VIEWING.
Key facts
- 7,797 sq ft lot
- 2 parking spots
- Built 1970
Neighborhood map
What this means for you Summary
Snapshot
- This is a 3-bed/2.0-bath single-family listed at $128k.
Deal economics
- At list price, monthly cash flow is $270 ($3k/yr) — positive.
- The deal already cash-flows at list — no discount required.
- Meets the 1% rule at list price ($1k rent vs $128k).
- Recommended offer: $116k (9.0% below list) — sets the bar for market timing.
- Cap rate 8.8% vs local median 4.3% in Baton Rouge — top-decile yield for the area; either an underpriced asset or a hidden risk that comps aren't pricing in. Stress-test before assuming the spread holds.
Location & tenants
- Location reads 74/100 on livability (#24 in LA, #4,535 nationally) — a middle-class / working-renter tenant base. Strengths: commute A+, cost of living A+, health & safety A+; Watch: amenities D, crime F, employment D-.
- East Baton Rouge Parish (urban): math 22% / reading 34% proficiency, ranked #47 of 98 in LA (top 48%) — low school quality limits family demand, transient renter base, plan for 1-2y turnover; 77% free/reduced lunch — lower-income household profile, screen leases tightly.
- Market conditions: 101 active listings in the ZIP; lower-income renter base — watch delinquency; 2,252 units permitted in East Baton Rouge Parish in 2024 (440 in 5+ unit buildings).
- At $1,457/mo this rent would consume 63% of the median local household income ($28k/yr) (locally 1092% of renters already pay >50% of income on rent) — very limited rent-growth headroom before tenants either downsize or default.
Forward outlook
- Local home prices are declining (-0.9%/yr); year-one equity from $882 of loan paydown is wiped out by about $1k of value loss. Plan a longer hold.
- East Baton Rouge County population projected at +4% by 2050 — modest demand growth; plan on rents tracking national, not racing it.
- At projected returns (-0.9% appreciation + 3.0% rent growth), your $36k cash investment doubles in ~8 years — after that, you're playing with house money.
Negotiation context
- It's been on market 108 days — a 9% lower offer ($116k) is reasonable based on typical stale-listing flexibility.
- 10 sale attempts since 22y ago; this cycle's ask has dropped $10k (8%) from the opening price — seller is motivated, your offer sets the floor, not the list.
Risks & watch-outs
- Climate carrying-cost: severe wind risk, 99% chance of damaging wind over 30y; extreme-heat days projected 7→21/yr by 2055 (HVAC capex compounding) — expect insurance premiums to compound above CPI over the hold.
Questions for the listing agent
- It's been on market 108 days. Have you received any prior offers? Is the seller open to a 9% concession, seller financing, or rate buy-down credit?
- Built in 1970 — when were the roof, HVAC, electrical panel, plumbing, and water heater last replaced?
- Why hasn't it sold? Are there any deal-killer items the seller is aware of (foundation, flood, title, zoning, code violations)?
- Is there a deadline driving the sale (1031 exchange, divorce, estate, relocation)? That informs how much negotiation room exists.
- Crime grade is F in this area — have there been break-ins, vandalism, or insurance claims at this property in the last 3 years? What carrier currently insures it and at what premium?
- What's the average days-on-market for RENTAL listings here right now (not sales)? A rising rental-DOM trend means longer vacancies and softer asking-rent achievability than the comps imply.
- What's the recent tenant-quality profile in this submarket — average credit score on applications, eviction rate, late-payment / NSF rate, and stable-employment percentage? A property-management company in the area should have these aggregated.
- How much new for-sale + rental construction is in the pipeline within 1–3 miles? Heavy new supply typically softens prices + rents 12–24 months out; constrained supply supports both.
Investment metrics
- 1% rule
- 1.14% ✓
- Cap rate
- 8.83%
- Cash-on-cash
- 9.07%
- DSCR
- 1.40
- GRM
- 7.3
CMA / ARV
- ARV (median comp)
- $148,296
- List price
- $127,500
- Delta
- -14.02%
- Verdict
- UNDERPRICED
- Comps
- 12 within 1.0 mi
Show comp detail 1 sale within ~0.75 mi
| Address | Dist | Beds/Ba | Sqft | Sold | Price | $/sf | Match |
|---|---|---|---|---|---|---|---|
| 414 Elmer Ave | 0.43mi | 3/2.0 | 2,127 (-7%) | 17mo | $145,000 | $68 | 54 |
Match score weights: distance 35% · size 25% · config 20% · recency 20%. Top-matched comps best support the ARV.
Projected returns pro-forma
-0.87% appreciation · 3.0% rent growth · sell at horizon
- IRR
- 5.2%
- Equity multiple
- 1.23×
- Total profit
- $8,340
- Equity at exit
- $31,566
- IRR
- 11.4%
- Equity multiple
- 2.14×
- Total profit
- $40,625
- Equity at exit
- $33,824
Cash invested: $35,700 (down + closing). Projections, not guarantees.
Landlord ↔ Tenant lean methodology
- Overall (STATE)
- 90 Strongly Landlord-Friendly
- State Louisiana
- 90 Strongly Landlord-Friendly · R+12
- County
- — inherits STATE
- City
- — inherits STATE
ZIP-level market 70807
- Home prices YoY
- -1.1%
- Active inventory
- 101
- Price-to-rent
- 7.3×
Monthly cashflow live
- Estimated rent
- $1,457 medium interval (Pro) →
- Mortgage (P&I)
- −$669
- Tax est. 1.5%
- −$159 /mo · $1,912/yr
- Insurance
- −$53
- HOA
- −$0
- Vacancy / Maint / Mgmt
- −$306
- Net cashflow
- $270
Break-even live
UW: 25.0% down · 7.5% · 30yr · 1.5% tax · 5.0% vac · 8.0% maint · 8.0% mgmt
Financing live
Cash to close
- Down payment
- $31,875
- Closing costs
- $3,825
- Reserves months
- —
- Total cash needed
- —
Loan-product check · same deal, 3 products live
Conventional
25% down · 7.5% · 30yr
- Down + closing
- —
- Monthly P&I
- —
- Monthly cashflow
- —
- DSCR
- —
- Eligible?
- —
Personal DTI + credit; lowest rate.
DSCR
20% down · 8.5% · 30yr
- Down + closing
- —
- Monthly P&I
- —
- Monthly cashflow
- —
- DSCR
- —
- Eligible?
- —
No personal income docs; deal must DSCR.
Hard money
10% down · 12.0% · 12mo
- Down + closing
- —
- Monthly P&I
- —
- Monthly cashflow
- —
- DSCR
- —
- Eligible?
- —
Short-term bridge; refi at stabilization.
Listing history 35 events
-
2026-06-18days on market $127,500 Active 108 DOM
-
2026-06-17days on market $127,500 Active 107 DOM
-
2026-06-16days on market $127,500 Active 106 DOM
-
2026-06-15days on market $127,500 Active 105 DOM
-
2026-06-14days on market $127,500 Active 103 DOM
-
2026-06-10days on market $127,500 Active 100 DOM
-
2026-06-09days on market $127,500 Active 99 DOM
-
2026-06-08days on market $127,500 Active 98 DOM
-
2026-06-07days on market $127,500 Active 97 DOM
-
2026-06-05days on market $127,500 Active 94 DOM
-
2026-06-03days on market $127,500 Active 93 DOM
-
2026-06-02days on market $127,500 Active 92 DOM
-
2026-06-01days on market $127,500 Active 91 DOM
-
2026-05-31days on market $127,500 Active 90 DOM
-
2026-05-31days on market $127,500 Active 89 DOM
-
2026-05-19price $127,500 207-char remark
Show marketing remark (207 chars)
THIS HOME IS A 3 BEDROOM / 2 BATH HOME POSSESSING TONS OF POTENTIAL FOR ITS NEXT INVESTOR. IF YOU ARE READY TO TAKE ON THIS HOME AND BRING YOUR VISION TO LIFE, PLEASE DON'T HESITATE TO SCHEDULE YOUR VIEWING.
-
2026-05-19price $127,500 207-char remark
Show marketing remark (207 chars)
THIS HOME IS A 3 BEDROOM / 2 BATH HOME POSSESSING TONS OF POTENTIAL FOR ITS NEXT INVESTOR. IF YOU ARE READY TO TAKE ON THIS HOME AND BRING YOUR VISION TO LIFE, PLEASE DON'T HESITATE TO SCHEDULE YOUR VIEWING.
-
2026-03-02$137,900 Active 207-char remark
Show marketing remark (207 chars)
THIS HOME IS A 3 BEDROOM / 2 BATH HOME POSSESSING TONS OF POTENTIAL FOR ITS NEXT INVESTOR. IF YOU ARE READY TO TAKE ON THIS HOME AND BRING YOUR VISION TO LIFE, PLEASE DON'T HESITATE TO SCHEDULE YOUR VIEWING.
-
2026-03-02$137,900 Active 207-char remark
Show marketing remark (207 chars)
THIS HOME IS A 3 BEDROOM / 2 BATH HOME POSSESSING TONS OF POTENTIAL FOR ITS NEXT INVESTOR. IF YOU ARE READY TO TAKE ON THIS HOME AND BRING YOUR VISION TO LIFE, PLEASE DON'T HESITATE TO SCHEDULE YOUR VIEWING.
-
2024-12-26price $137,900
-
2024-12-11$137,900 Active
-
2024-12-11historical
-
2024-11-13price $137,900
-
2024-08-29status Active
-
2024-02-25status Pending
-
2024-02-14$139,900 Active
-
2024-02-14$139,900 Active
-
2023-10-20soldstatus Sold
-
2023-07-19price $90,000
-
2023-06-23status Pending
-
2023-06-22$80,000 Active
-
2023-06-22$90,000
-
2004-09-30soldstatus
-
2004-06-14$95,000
-
2004-06-14$95,000
ⓘ Source: listings_history table (triggers on properties + properties_extension) + one-shot
backfill from property_details.listing_events for pre-trigger history.
Climate risk First Street
- Flood 1/10 Low FEMA zone X (unshaded) · 0% chance over 30 yrs
- Wildfire 1/10 Low
- Heat 8/10 Severe 7 d/yr ≥108°F today · 21 d/yr by 30 yrs out
- Wind 9/10 Extreme 99% chance of damaging wind over 30 yrs
- Air quality 2/10 Low 1 unhealthy d/yr today · 1 by 30 yrs out
Nearby sold comps map
Loading sold comps map…
Walkable amenities ~0.75 mi
Loading nearby amenities…
Taxation est. · year 1
- Rental income
- $17,481
- − Mortgage interest
- −$7,142
- − Property taxes
- −$1,912
- − Insurance
- −$638
- − Repairs & maintenance
- −$1,398
- − Management
- −$1,398
- − Depreciation
- −$3,709
- Taxable income
- $1,283
- Est. tax owed @ 24.0%
- −$308
- After-tax cash flow
- $2,928/yr
For passive investors: Depreciation is non-cash, so a rental often shows a tax loss while cash-flowing — sheltering income. Rental losses are passive: they offset passive income freely, and up to $25,000/yr can offset ordinary (W-2) income if you actively participate and your MAGI is under $100k (phasing out to $0 by $150k); unused losses carry forward. On sale, claimed depreciation is recaptured at up to 25%, and gains may owe capital-gains tax (a 1031 exchange can defer both). Figures are a year-1 estimate at your 24.0% rate — not tax advice; consult a CPA.
Schools (NCES district)
- District
- East Baton Rouge Parish
- NCES district ID
- 2200540
- Math proficiency
- 22% ▼ -36.00%
- Reading proficiency
- 34% ▼ -31.00%
- Median HH income
- $46,263
- Composite
- 24.14/100
- National rank
- #7745
- State rank
- #47 of 98 in LA
Livability — Baton Rouge
- Score
- 74/100
- State rank
- #24
- US rank
- #4535
Category grades
Schools grade is shown separately in the Schools card above.
Census & demographics
- Census place
- Baton Rouge, LA
- County
- East Baton Rouge Parish · 399,686 people
- City population
- 351,868
- Metro
- Baton Rouge, LA
- Population (ZIP)
- 15,300
- Household income
- $27,534
- Rent vs Own
- Severe rent burden
- 1092.0
Population outlook (East Baton Rouge County) Hauer SSP2
- Today (2025)
- 464,810 people
- By 2030
- 472,137 · +1.6%
- By 2040
- 480,243 · +3.3%
- By 2050
- 484,422 · +4.2%
- By 2075
- 492,069 · +5.9%
- By 2100
- 476,347 · +2.5%
Race, ethnicity, and origin ACS 2023
- Neighborhood character
- Predominantly Black (91%)
- Race & ethnicity
- Black 91% Two or more races 6% White 3%
- Common ancestry
- Lithuanian 1%
- Foreign-born
- 1% · Canada
Political lean MEDSL · East Baton Rouge
- 2024 margin
- D (+11.1) · D 54.5% · R 43.4% · Other 2.1%
- 2008→2024 swing
- +8.9pp toward D · 2008: 2.2pp · 2024: 11.1pp
- All cycles
- 2024: D+11.1 2020: D+13.1 2016: D+9.2 2012: D+5.2 2008: D+2.2
Not yet ingested
- Civics
- —
Market trends
- HPI YoY
- ▼ -0.87%
- Current HPI
- 78.3629
- Rent YoY
- —
- Metro
- Baton Rouge, LA
- State GDP YoY
- ▲ 3.29%
- F500 in state
- 10
Industry mix (Fortune 500 HQ in LA)
| Industry | F500 HQs | Revenue |
|---|---|---|
| Telecommunications | 2 | $23B |
|
||
| Utilities | 1 | $12B |
|
||
| Wholesale / Distribution | 1 | $5B |
|
||
| Advertising | 1 | $2B |
|
||
Price history
+34.2% since first listed20 events — show timeline
- 2026-05-19 Price Changed $127,500 AcadianaMLS
- 2026-05-19 Price Changed $127,500 GBRMLS
- 2026-03-02 Listed $137,900 GBRMLS
- 2026-03-02 Listed $137,900 AcadianaMLS
- 2024-12-26 Price Changed $137,900 AcadianaMLS
- 2024-12-11 Listed $137,900 GBRMLS
- 2024-12-11 Delisted — GBRMLS
- 2024-11-13 Price Changed $137,900 GBRMLS
- 2024-08-29 Relisted — GBRMLS
- 2024-02-25 Pending — GBRMLS
- 2024-02-14 Listed $139,900 AcadianaMLS
- 2024-02-14 Listed $139,900 GBRMLS
- 2023-10-20 Sold (MLS) — GBRMLS
- 2023-07-19 Price Changed $90,000 GBRMLS
- 2023-06-23 Pending — GBRMLS
- 2023-06-22 Listed $90,000 AcadianaMLS
- 2023-06-22 Listed $80,000 GBRMLS
- 2004-09-30 Sold (MLS) — GBRMLS
- 2004-06-14 Listed $95,000 AcadianaMLS
- 2004-06-14 Listed $95,000 GBRMLS
Property tax history
-2.5%/yrLatest (2025): $159 · +4.7% YoY. Source: county tax records.
Cash-flow waterfall
monthlySold comps — $/sqft
last 12 mo · ≤1 miLoading sold comps…