 🏗️ New Construction
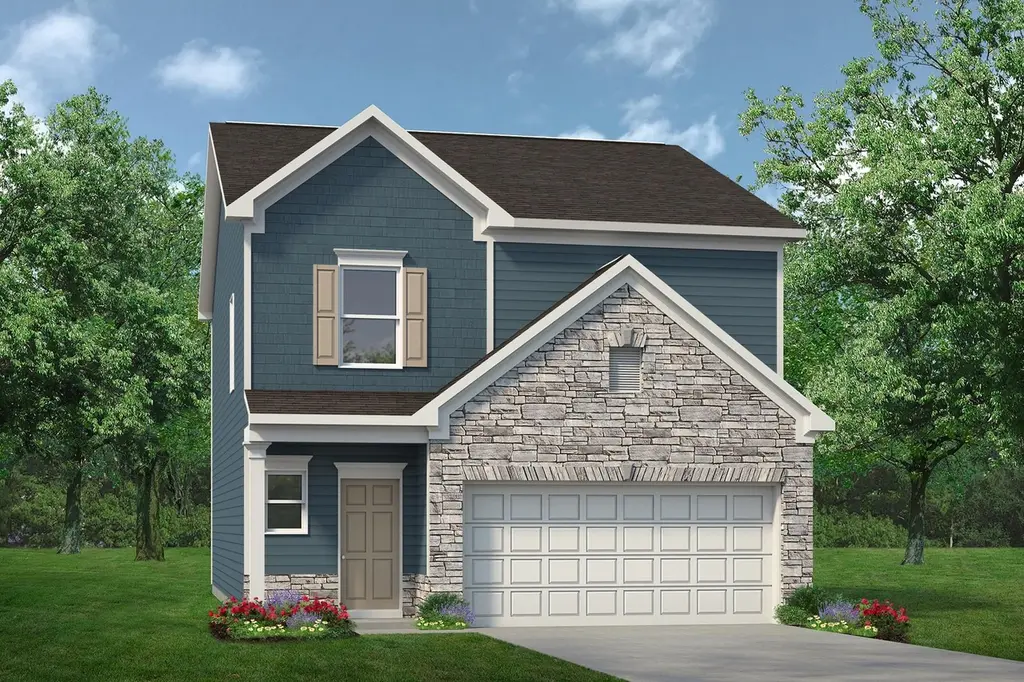
The Buford II Plan · Indian Springs, GA
Flood risk No data
- FEMA flood zone
- —
- Chance of flooding over 30 yrs
- —
- Est. flood insurance / yr
- —
Fire risk No data
- Est. fire insurance / yr
- —
Heat risk No data
- Hot days now (above threshold)
- —
- Hot days in 30 yrs
- —
Wind risk No data
- Chance of severe wind over 30 yrs
- —
Air-quality risk No data
- Unhealthy air days now
- —
- Unhealthy air days in 30 yrs
- —
Risk factors via First Street. Map © Google.
Why this score? — see what drove the F grade
The composite is a weighted blend of 9 inputs, each scored 0–100. Each bar is that input's sub-score; the figure is the points it added to the 100-point composite (weight × sub-score).
- ARV discount +7.5/15.0
- Cash flow +6.1/30.0
- Rent growth +4.2/5.0
- Condition / age +4.0/5.0
- Schools +3.3/10.0
- Livability +3.2/5.0
- 1% rule +1.4/10.0
- DSCR +0.4/10.0
- Appreciation +0.0/10.0
$259,900
🖨 Deal sheet 📄 Offer letter ✓ Due diligence
Listing remarks MLS
The Buford II features a central family room with easy access to the covered patio. An efficiently laid-out kitchen with a peninsula and adjacent breakfast nook provide ample cooking and dining space. Upstairs, you'll find a versatile loft with space for a fitness room, playroom, or home office. A private owner's suite features a compartmentalized bath and a large walk-in closet. Two secondary bedrooms, a full bath, and a convenient laundry room complete the second floor.
Key facts
- Breakfast nook
- Central family room
- Covered patio
Tags
Neighborhood map
What this means for you Summary
Snapshot
- This is a 3-bed/2.5-bath single-family listed at $260k. Condition is rated good.
Deal economics
- At list price, monthly cash flow is $-578 ($-7k/yr) — negative.
- To cash-flow at today's rent, offer at most $226k (13.0% below list).
- To meet the 1% rule (rent ≥ 1% of price), the offer needs to be $198k (23.9% below list).
- Recommended offer: $198k (23.9% below list) — sets the bar for 1% rule.
Location & tenants
- Location reads 63/100 on livability (#283 in GA) — a middle-class / working-renter tenant base. Strengths: crime A+, cost of living A+, housing A+; Watch: schools F, amenities F, commute F.
- Catoosa County (suburban): math 36% / reading 41% proficiency, ranked #49 of 174 in GA (top 28%) — families likely to look elsewhere, expect single-tenant / working-renter base with shorter leases.
- Market conditions: Rents rising fast (+6.8%/yr); 353 active listings in the ZIP; 6 comparable units currently listed for rent nearby; rentals at typical pace (median 23d on market — plan ~3-4 weeks tenant-placement turnaround); solid renter incomes; 848 units permitted in Catoosa County in 2024 (256 in 5+ unit buildings).
Forward outlook
- Local home prices are declining (-3.0%/yr); year-one equity from $2k of loan paydown is wiped out by about $9k of value loss. Plan a longer hold.
- Catoosa County population projected at +5% by 2050 — modest demand growth; plan on rents tracking national, not racing it.
Negotiation context
- It's been on market 272 days — a 12% lower offer ($229k) is reasonable based on typical stale-listing flexibility.
Questions for the listing agent
- What do current leases actually rent for vs. the listed asking? Can we see a recent rent roll and the last 12 months of T-12 income?
- It's been on market 272 days. Have you received any prior offers? Is the seller open to a 24% concession, seller financing, or rate buy-down credit?
- Why hasn't it sold? Are there any deal-killer items the seller is aware of (foundation, flood, title, zoning, code violations)?
- Is there a deadline driving the sale (1031 exchange, divorce, estate, relocation)? That informs how much negotiation room exists.
- Schools are F-rated, which usually means shorter tenancies and higher turnover. Who's the typical renter profile here, and what's been the actual vacancy rate?
- The area grade is low — what's the realistic commute time and amenity access for the typical tenant pool here? Any planned neighborhood developments (good or bad) we should know about?
- What's the average days-on-market for RENTAL listings here right now (not sales)? A rising rental-DOM trend means longer vacancies and softer asking-rent achievability than the comps imply.
- What's the recent tenant-quality profile in this submarket — average credit score on applications, eviction rate, late-payment / NSF rate, and stable-employment percentage? A property-management company in the area should have these aggregated.
- How much new for-sale + rental construction is in the pipeline within 1–3 miles? Heavy new supply typically softens prices + rents 12–24 months out; constrained supply supports both.
Investment metrics
- 1% rule
- 0.64% ✗
- Cap rate
- 4.05%
- Cash-on-cash
- -8.00%
- DSCR
- 0.64
- GRM
- 13.0
CMA / ARV
- ARV (median comp)
- $309,615
- List price
- $259,900
- Delta
- -16.06%
- Verdict
- UNDERPRICED
- Comps
- 20 within 1.0 mi
Show comp detail 12 sales within ~0.75 mi
| Address | Dist | Beds/Ba | Sqft | Sold | Price | $/sf | Match |
|---|---|---|---|---|---|---|---|
| 20 Robert Ln | 0.41mi | 3/2.0 | 1,850 (-3%) | 9mo | $246,500 | $133 | 66 |
| 155 Williams Dr | 0.25mi | 3/2.5 | 1,748 (-8%) | 11mo | $320,000 | $183 | 65 |
| 135 Foster Ln | 0.52mi | 3/2.0 | 1,934 (+1%) | 11mo | $243,000 | $126 | 63 |
| 14 Williams Dr | 0.42mi | 3/2.5 | 1,844 (-3%) | 21mo | $370,000 | $201 | 58 |
| 200 Bridlewood Dr | 0.66mi | 3/2.0 | 1,827 (-4%) | 4mo | $535,000 | $293 | 57 |
| 40 Ridgeside Dr | 0.47mi | 4/2.5 (+1) | 1,816 (-5%) | 11mo | $294,500 | $162 | 56 |
| 18 Silver Spur Rd | 0.64mi | 3/2.0 | 1,827 (-4%) | 17mo | $385,000 | $211 | 47 |
| 546 Indian Springs Rd | 0.59mi | 3/2.0 | 1,659 (-13%) | 2mo | $293,000 | $177 | 47 |
| 66 Silver Spur Rd | 0.63mi | 3/2.5 | 2,010 (+5%) | 19mo | $449,000 | $223 | 46 |
| 200 Bridlewood Dr #14 | 0.61mi | 3/2.0 | 1,827 (-4%) | 22mo | $424,900 | $233 | 44 |
| 236 Foster Ln | 0.69mi | 3/2.0 | 1,757 (-8%) | 10mo | $432,000 | $246 | 44 |
| 129 Indian Springs Rd | 0.37mi | 4/2.0 (+1) | 1,637 (-14%) | 13mo | $260,000 | $159 | 41 |
Match score weights: distance 35% · size 25% · config 20% · recency 20%. Top-matched comps best support the ARV.
Projected returns pro-forma
-3.0% appreciation · 6.84% rent growth · sell at horizon
- IRR
- -26.2%
- Equity multiple
- 0.09×
- Total profit
- $-79,000
- Equity at exit
- $46,165
- IRR
- -13.9%
- Equity multiple
- 0.07×
- Total profit
- $-80,808
- Equity at exit
- $26,770
Cash invested: $86,692 (down + closing). Projections, not guarantees.
Landlord ↔ Tenant lean methodology
- Overall (STATE)
- 90 Strongly Landlord-Friendly
- State Georgia
- 90 Strongly Landlord-Friendly · R+3
- County
- — inherits STATE
- City
- — inherits STATE
ZIP-level market 30736
- Home prices YoY
- -21.9%
- Rents YoY
- 6.8%
- Active inventory
- 353
- Price-to-rent
- 11.0×
Monthly cashflow live
- Estimated rent
- $1,977 high interval (Pro) →
- Mortgage (P&I)
- −$1,624
- Tax est. 1.5%
- −$387 /mo · $4,644/yr
- Insurance
- −$129
- HOA
- −$0
- Vacancy / Maint / Mgmt
- −$415
- Net cashflow
- $-578
Break-even live
UW: 25.0% down · 7.5% · 30yr · 1.5% tax · 5.0% vac · 8.0% maint · 8.0% mgmt
Financing live
Cash to close
- Down payment
- $77,404
- Closing costs
- $9,288
- Reserves months
- —
- Total cash needed
- —
Loan-product check · same deal, 3 products live
Conventional
25% down · 7.5% · 30yr
- Down + closing
- —
- Monthly P&I
- —
- Monthly cashflow
- —
- DSCR
- —
- Eligible?
- —
Personal DTI + credit; lowest rate.
DSCR
20% down · 8.5% · 30yr
- Down + closing
- —
- Monthly P&I
- —
- Monthly cashflow
- —
- DSCR
- —
- Eligible?
- —
No personal income docs; deal must DSCR.
Hard money
10% down · 12.0% · 12mo
- Down + closing
- —
- Monthly P&I
- —
- Monthly cashflow
- —
- DSCR
- —
- Eligible?
- —
Short-term bridge; refi at stabilization.
Rent comps 6 comps
| Address | Beds | Baths | Sqft | Rent | $/sqft | DOM | Units | Dist |
|---|---|---|---|---|---|---|---|---|
| 37 Mohawk Trl Ringgold, GA | 4.0 | 2.0 | 1296 | $1,823 | $1.41 | 13d | 1 | 0.34mi |
| 165 Duke Ln Ringgold, GA | 2.0 | 2.0 | 1264 | $1,850 | $1.46 | 43d | 1 | 1.14mi |
| 169 Duke Ln Ringgold, GA | 2.0 | 2.0 | 1271 | $1,900 | $1.49 | 13d | 1 | 1.14mi |
| 192 Clear Creek Dr Ringgold, GA | 2.0 | 2.0 | 1640 | $1,900 | $1.16 | 23d | 1 | 1.18mi |
| 192 Clear Creek Dr #190 Ringgold, GA | 2.0 | 2.0 | 1640 | $2,400 | $1.46 | 43d | 1 | 1.18mi |
| 37 Anderson Rd Ringgold, GA | 3.0 | 2.0 | 1500 | $1,699 | $1.13 | 23d | 1 | 1.19mi |
Listing history 15 events
-
2026-06-18days on market $259,900 Active 272 DOM
-
2026-06-17days on market $259,900 Active 271 DOM
-
2026-06-16days on market $259,900 Active 270 DOM
-
2026-06-15days on market $259,900 Active 269 DOM
-
2026-06-14days on market $259,900 Active 267 DOM
-
2026-06-10days on market $259,900 Active 264 DOM
-
2026-06-09days on market $259,900 Active 263 DOM
-
2026-06-08days on market $259,900 Active 262 DOM
-
2026-06-07days on market $259,900 Active 261 DOM
-
2026-06-03days on market $259,900 Active 257 DOM
-
2026-06-02days on market $259,900 Active 256 DOM
-
2026-06-01days on market $259,900 Active 255 DOM
-
2026-05-31days on market $259,900 Active 254 DOM
-
2026-05-30days on market $259,900 Active 253 DOM
-
2025-09-20$282,900 Active 476-char remark
Show marketing remark (476 chars)
The Buford II features a central family room with easy access to the covered patio. An efficiently laid-out kitchen with a peninsula and adjacent breakfast nook provide ample cooking and dining space. Upstairs, you'll find a versatile loft with space for a fitness room, playroom, or home office. A private owner's suite features a compartmentalized bath and a large walk-in closet. Two secondary bedrooms, a full bath, and a convenient laundry room complete the second floor.
ⓘ Source: listings_history table (triggers on properties + properties_extension) + one-shot
backfill from property_details.listing_events for pre-trigger history.
Nearby sold comps map
Loading sold comps map…
Walkable amenities ~0.75 mi
Loading nearby amenities…
Taxation est. · year 1
- Rental income
- $23,727
- − Mortgage interest
- −$17,343
- − Property taxes
- −$4,644
- − Insurance
- −$1,548
- − Repairs & maintenance
- −$1,898
- − Management
- −$1,898
- − Depreciation
- −$9,007
- Taxable loss
- −$12,612
- Est. tax savings @ 24.0%
- +$3,027
- After-tax cash flow
- $-3,905/yr
For passive investors: Depreciation is non-cash, so a rental often shows a tax loss while cash-flowing — sheltering income. Rental losses are passive: they offset passive income freely, and up to $25,000/yr can offset ordinary (W-2) income if you actively participate and your MAGI is under $100k (phasing out to $0 by $150k); unused losses carry forward. On sale, claimed depreciation is recaptured at up to 25%, and gains may owe capital-gains tax (a 1031 exchange can defer both). Figures are a year-1 estimate at your 24.0% rate — not tax advice; consult a CPA.
Condition & rehab AI · 1 photo
The Buford II Plan is in excellent condition with no visible repairs needed. It offers a good return on investment with updates focusing on curb appeal and enhancing its visual appeal.
Value-add opportunities
- Both Painting the exterior — Enhances curb appeal and can increase both resale and rental value
- Both Landscaping improvements — Enhances curb appeal and can increase both resale and rental value
Renovation cost estimate screening
Value-add ROI direction
- Both Painting the exterior — Enhances curb appeal and can increase both resale and rental value ↑
- Both Landscaping improvements — Enhances curb appeal and can increase both resale and rental value ↑
ⓘ Cost ranges are severity-bucket heuristics (US national rule-of-thumb). Get contractor quotes + a written scope before underwriting a rehab budget.
Schools (NCES district)
- District
- Catoosa County
- NCES district ID
- 1300930
- Math proficiency
- 36% ▼ -15.00%
- Reading proficiency
- 41% ▼ -8.00%
- Median HH income
- $48,913
- Composite
- 33.13/100
- National rank
- #5558
- State rank
- #49 of 174 in GA
Livability — Indian Springs
- Score
- 63/100
- State rank
- #283
- US rank
- #15251
Category grades
Schools grade is shown separately in the Schools card above.
Census & demographics
- Census place
- Indian Springs, GA
- County
- Catoosa County · 52,244 people
- Metro
- Chattanooga, TN-GA
- Population (ZIP)
- 44,499
- Household income
- $83,821
- Rent vs Own
- Severe rent burden
- 559.0
Population outlook (Catoosa County) Hauer SSP2
- Today (2025)
- 70,112 people
- By 2030
- 71,621 · +2.2%
- By 2040
- 73,595 · +5.0%
- By 2050
- 73,921 · +5.4%
- By 2075
- 72,135 · +2.9%
- By 2100
- 65,979 · -5.9%
Race, ethnicity, and origin ACS 2023
- Neighborhood character
- Predominantly White (89%)
- Race & ethnicity
- White 89% Two or more races 5% Hispanic / Latino 3% Black 2% Asian 1%
- Common ancestry
- Slovak 2% Italian 2% Serbian 2%
- Foreign-born
- 2% · Canada
- Languages at home
- 96% English-only · Spanish 2% Russian/Polish/Slavic 1%
Political lean MEDSL · Catoosa
- 2024 margin
- Solid R (+55.5) · D 22.0% · R 77.5%
- 2008→2024 swing
- -5.7pp toward R · 2008: -49.8pp · 2024: -55.5pp
- All cycles
- 2024: R+55.5 2020: R+56.0 2016: R+60.7 2012: R+52.8 2008: R+49.8
Not yet ingested
- Civics
- —
Market trends
- HPI YoY
- ▼ -70.42%
- Current HPI
- 251.8824
- Rent YoY
- ▲ 6.84%
- Metro
- Chattanooga, TN-GA
- State GDP YoY
- ▲ 2.66%
- F500 in state
- 28
Industry mix (Fortune 500 HQ in GA)
| Industry | F500 HQs | Revenue |
|---|---|---|
| Paper / Packaging | 2 | $29B |
|
||
| Retail | 1 | $160B |
|
||
| Transportation / Logistics | 1 | $91B |
|
||
| Airlines | 1 | $62B |
|
||
| Consumer Goods | 1 | $47B |
|
||
| Utilities | 1 | $25B |
|
||
Price history
1 event — show timeline
- 2025-09-20 Listed $282,900 Zillow
Cash-flow waterfall
monthlySold comps — $/sqft
last 12 mo · ≤1 miLoading sold comps…