 Multi-family
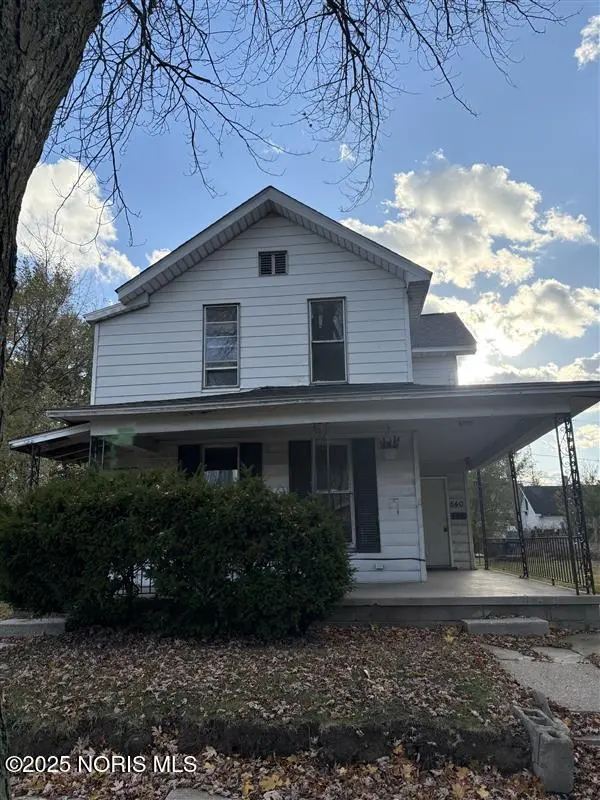
540 Church St · Toledo, OH
Flood risk 1/10 · Minimal
- FEMA flood zone
- X (unshaded)
- Chance of flooding over 30 yrs
- 0.0%
- Est. flood insurance / yr
- $507 – $1,088
Fire risk 1/10 · Minimal
- Est. fire insurance / yr
- $713 – $1,323
Heat risk 3/10 · Minor
- Hot days now (above 100°F)
- 7 days/yr
- Hot days in 30 yrs
- 16 days/yr
Wind risk 2/10 · Minimal
- Chance of severe wind over 30 yrs
- —
Air-quality risk 2/10 · Minimal
- Unhealthy air days now
- 1 days/yr
- Unhealthy air days in 30 yrs
- 2 days/yr
Risk factors via First Street. Map © Google.
Why this score? — see what drove the C+ grade
The composite is a weighted blend of 9 inputs, each scored 0–100. Each bar is that input's sub-score; the figure is the points it added to the 100-point composite (weight × sub-score).
- Cash flow +30.0/30.0
- 1% rule +10.0/10.0
- DSCR +10.0/10.0
- Rent growth +3.8/5.0
- Livability +3.3/5.0
- Condition / age +2.5/5.0
- Schools +1.6/10.0
- ARV discount +0.2/15.0
- Appreciation +0.0/10.0
$84,900
🖨 Deal sheet (PDF) 📄 Offer letter ✓ Due diligence
Multi-family units
County records classify this as Multi-Family (2-4 Unit). Listing-text estimate: 1 unit. estimate disagrees with records
Listing remarks MLS
Make this your next investment property! The lower unit is currently vacant and freshly renovated, nearly ready for a new resident, with average rents for similar units in the area coming in at around $750 per month. The upper unit is already rented on a brand new one year lease, offering immediate rental income. The upper unit also features an in-unit washer and dryer, and both units boast newer vinyl flooring throughout.
Key facts
- Newer vinyl flooring
- 5,700 sq ft lot
- 2 parking spots
Tags
Neighborhood map
What this means for you Summary
Snapshot
- This is a 5-bed/2.0-bath multifamily listed at $85k.
Deal economics
- At list price, monthly cash flow is $857 ($10k/yr) — positive.
- The deal already cash-flows at list — no discount required.
- Meets the 1% rule at list price ($2k rent vs $85k).
- Recommended offer: $75k (12.0% below list) — sets the bar for market timing.
- Cap rate 18.4% vs local median 7.7% in Toledo — top-decile yield for the area; either an underpriced asset or a hidden risk that comps aren't pricing in. Stress-test before assuming the spread holds.
Location & tenants
- Location reads 66/100 on livability (#645 in OH) — a middle-class / working-renter tenant base. Strengths: cost of living A+, housing A+, health & safety A+; Watch: amenities C-, crime F, commute F.
- Toledo City (urban): math 15% / reading 24% proficiency, ranked #634 of 656 in OH (top 97%) — low school quality limits family demand, transient renter base, plan for 1-2y turnover; 72% free/reduced lunch — lower-income household profile, screen leases tightly.
- Zoned schools: Grove Patterson Academy Elementary School (math 47% / reading 66%, grade C+, #761 of 1,584 statewide, top 48%, 403 students, 38% FRL); Waite High School (math 12% / reading 24%, grade F, #687 of 781 statewide, top 88%, 997 students, 0% FRL) — zoned schools average 19% FRL vs 72% district-wide (53 pts lower); this property's tenant base skews higher-income than the district average.
- Zoned-school proficiency averages 37% at this address vs 20% district-wide (+18 pts) — the actual schools serving this property are materially stronger than the Toledo City average implies; a family-tenant draw the district grade alone would hide.
- Market conditions: Rents rising fast (+5.4%/yr); 118 active listings in the ZIP; lower-income renter base — watch delinquency; 415 units permitted in Lucas County in 2024 (122 in 5+ unit buildings).
Forward outlook
- Local home prices are declining (-3.0%/yr); year-one equity from $587 of loan paydown is wiped out by about $3k of value loss. Plan a longer hold.
- Lucas County population projected at -16% by 2050 — secular population decline; favor cash flow + early exit over multi-decade hold.
- At projected returns (-3.0% appreciation + 5.4% rent growth), your $24k cash investment doubles in ~3 years — after that, you're playing with house money.
Negotiation context
- It's been on market 191 days — a 12% lower offer ($75k) is reasonable based on typical stale-listing flexibility.
- 11 sale attempts since 25y ago; this cycle's ask has dropped $5k (6%) from the opening price — seller is motivated, your offer sets the floor, not the list.
- Current owner paid $62k; 37% above their basis — modest negotiation headroom, anchor on the comps not their cost.
Risks & watch-outs
- Watch-outs: built in 1894 — expect roof / HVAC / electrical / plumbing capex.
Questions for the listing agent
- It's been on market 191 days. Have you received any prior offers? Is the seller open to a 12% concession, seller financing, or rate buy-down credit?
- Built in 1894 — when were the roof, HVAC, electrical panel, plumbing, and water heater last replaced?
- Why hasn't it sold? Are there any deal-killer items the seller is aware of (foundation, flood, title, zoning, code violations)?
- Is there a deadline driving the sale (1031 exchange, divorce, estate, relocation)? That informs how much negotiation room exists.
- Schools are D-rated, which usually means shorter tenancies and higher turnover. Who's the typical renter profile here, and what's been the actual vacancy rate?
- Crime grade is F in this area — have there been break-ins, vandalism, or insurance claims at this property in the last 3 years? What carrier currently insures it and at what premium?
- What's the average days-on-market for RENTAL listings here right now (not sales)? A rising rental-DOM trend means longer vacancies and softer asking-rent achievability than the comps imply.
- What's the recent tenant-quality profile in this submarket — average credit score on applications, eviction rate, late-payment / NSF rate, and stable-employment percentage? A property-management company in the area should have these aggregated.
- How much new apartment / multifamily construction is in the pipeline within 1–3 miles? Heavy new supply (>2% of stock underway) typically softens rents 12–24 months out; light construction supports rent growth.
Investment metrics
- 1% rule
- 2.18% ✓
- Cap rate
- 18.41%
- Cash-on-cash
- 43.28%
- DSCR
- 2.93
- GRM
- 3.8
CMA / ARV
- ARV (median comp)
- $72,985
- List price
- $84,900
- Delta
- 16.33%
- Verdict
- OVERPRICED
- Comps
- 20 within 1.0 mi
Show comp detail 9 sales within ~0.75 mi
| Address | Dist | Beds/Ba | Sqft | Sold | Price | $/sf | Match |
|---|---|---|---|---|---|---|---|
| 702 Clark St | 0.13mi | 4/2.0 (-1) | 2,242 (+3%) | 11mo | $62,500 | $28 | 74 |
| 507 Walden Ave | 0.21mi | 4/2.0 (-1) | 2,100 (-3%) | 23mo | $53,000 | $25 | 60 |
| 912 E Broadway St | 0.54mi | 4/2.0 (-1) | 2,160 (-0%) | 14mo | $67,500 | $31 | 58 |
| 810 Euclid Ave | 0.31mi | 4/2.0 (-1) | 2,396 (+10%) | 11mo | $62,500 | $26 | 53 |
| 425 Arden Pl | 0.34mi | 4/2.0 (-1) | 1,936 (-11%) | 13mo | $60,000 | $31 | 50 |
| 1030 E Broadway St | 0.66mi | 4/2.0 (-1) | 2,095 (-3%) | 12mo | $105,000 | $50 | 48 |
| 969 Berry St | 0.55mi | 5/2.0 | 2,354 (+9%) | 16mo | $122,500 | $52 | 47 |
| 349 Parker Ave | 0.66mi | 4/2.0 (-1) | 2,468 (+14%) | 2mo | $79,900 | $32 | 40 |
| 1326 Idaho St | 0.68mi | 4/2.0 (-1) | 1,854 (-14%) | 24mo | $70,000 | $38 | 19 |
Match score weights: distance 35% · size 25% · config 20% · recency 20%. Top-matched comps best support the ARV.
Projected returns pro-forma
-3.0% appreciation · 5.37% rent growth · sell at horizon
- IRR
- 42.8%
- Equity multiple
- 2.91×
- Total profit
- $45,403
- Equity at exit
- $12,659
- IRR
- 50.0%
- Equity multiple
- 6.45×
- Total profit
- $129,450
- Equity at exit
- $7,341
Cash invested: $23,772 (down + closing). Projections, not guarantees.
Landlord ↔ Tenant lean methodology
- Overall (STATE)
- 73 Landlord-Friendly
- State Ohio
- 73 Landlord-Friendly · R+6
- County
- — inherits STATE
- City
- — inherits STATE
ZIP-level market 43605
- Home prices YoY
- -25.6%
- Rents YoY
- 5.4%
- Active inventory
- 118
- Price-to-rent
- 7.7×
Monthly cashflow live
- Estimated rent
- $1,849 high interval (Pro) →
- Mortgage (P&I)
- −$445
- Tax from tax record
- −$123 /mo · $1,472/yr
- Insurance
- −$35
- HOA
- −$0
- Vacancy / Maint / Mgmt
- −$388
- Net cashflow
- $857
Break-even live
Sensitivity live
| Price | -10% $905 | -5% $881 | +0% $857 | +5% $833 | +10% $809 |
|---|---|---|---|---|---|
| Rent | -10% $711 | -5% $784 | +0% $857 | +5% $930 | +10% $1,003 |
| Rate | -1.0pp $900 | -0.5pp $879 | base $857 | +0.5pp $835 | +1.0pp $813 |
2-unit breakdown (identical units grouped — click to expand)
| Units | Beds | Baths | Est. rent |
|---|---|---|---|
| 2× units | 2 | 1 | $1,850 |
| #1 | 2 | 1 | $925 |
| #2 | 2 | 1 | $925 |
| Total (2 units) | $1,849 | ||
UW: 25.0% down · 7.5% · 30yr · 1.5% tax · 5.0% vac · 8.0% maint · 8.0% mgmt
Financing live
Cash to close
- Down payment
- $21,225
- Closing costs
- $2,547
- Reserves months
- —
- Total cash needed
- —
Loan-product check · same deal, 3 products live
Conventional
25% down · 7.5% · 30yr
- Down + closing
- —
- Monthly P&I
- —
- Monthly cashflow
- —
- DSCR
- —
- Eligible?
- —
Personal DTI + credit; lowest rate.
DSCR
20% down · 8.5% · 30yr
- Down + closing
- —
- Monthly P&I
- —
- Monthly cashflow
- —
- DSCR
- —
- Eligible?
- —
No personal income docs; deal must DSCR.
Hard money
10% down · 12.0% · 12mo
- Down + closing
- —
- Monthly P&I
- —
- Monthly cashflow
- —
- DSCR
- —
- Eligible?
- —
Short-term bridge; refi at stabilization.
Listing history 48 events
-
2026-06-21days on market $84,900 Active 191 DOM
-
2026-06-18days on market $84,900 Active 188 DOM
-
2026-06-17days on market $84,900 Active 187 DOM
-
2026-06-16days on market $84,900 Active 186 DOM
-
2026-06-15days on market $84,900 Active 185 DOM
-
2026-06-14days on market $84,900 Active 183 DOM
-
2026-06-10days on market $84,900 Active 180 DOM
-
2026-06-09days on market $84,900 Active 179 DOM
-
2026-06-08days on market $84,900 Active 178 DOM
-
2026-06-07days on market $84,900 Active 177 DOM
-
2026-06-05days on market $84,900 Active 174 DOM
-
2026-06-03days on market $84,900 Active 173 DOM
-
2026-06-02days on market $84,900 Active 172 DOM
-
2026-06-01days on market $84,900 Active 171 DOM
-
2026-05-31days on market $84,900 Active 170 DOM
-
2026-05-30days on market $84,900 Active 169 DOM
-
2026-04-09price $84,900 426-char remark
Show marketing remark (426 chars)
Make this your next investment property! The lower unit is currently vacant and freshly renovated, nearly ready for a new resident, with average rents for similar units in the area coming in at around $750 per month. The upper unit is already rented on a brand new one year lease, offering immediate rental income. The upper unit also features an in-unit washer and dryer, and both units boast newer vinyl flooring throughout.
-
2025-11-12$89,900 Active 426-char remark
Show marketing remark (426 chars)
Make this your next investment property! The lower unit is currently vacant and freshly renovated, nearly ready for a new resident, with average rents for similar units in the area coming in at around $750 per month. The upper unit is already rented on a brand new one year lease, offering immediate rental income. The upper unit also features an in-unit washer and dryer, and both units boast newer vinyl flooring throughout.
-
2025-10-14price $28,000 101-char remark
Show marketing remark (101 chars)
Investors delight. Seperate utilities, 2 beds each unit. Roof 10 years old, fenced yard 2 car garage.
-
2025-10-14price $62,000
Show marketing remark (101 chars)
Investors delight. Seperate utilities, 2 beds each unit. Roof 10 years old, fenced yard 2 car garage.
-
2025-10-14price $10,000
Show marketing remark (101 chars)
Investors delight. Seperate utilities, 2 beds each unit. Roof 10 years old, fenced yard 2 car garage.
-
2024-03-14historical $700
-
2024-02-04$700
-
2023-08-03soldstatus $62,000
-
2023-07-28soldstatus $62,000 Closed
-
2023-06-20historical Contingent
-
2023-06-14$79,000 Active
-
2023-01-18historical
-
2022-07-18$79,900 Active
-
2022-02-27price $575
-
2020-10-09soldstatus $24,900
-
2014-07-16soldstatus $10,000
-
2014-04-11$11,000
-
2014-03-29historical
-
2014-01-29$11,000
-
2013-10-03historical
-
2013-03-08$11,000
-
2013-03-06historical
-
2012-11-07$19,900
-
2012-11-07historical
-
2012-05-07$40,000
-
2012-04-05historical
-
2010-10-15$33,900
-
2002-03-19soldstatus $28,000
-
2002-03-14soldstatus $28,000 101-char remark
Show marketing remark (101 chars)
Investors delight. Seperate utilities, 2 beds each unit. Roof 10 years old, fenced yard 2 car garage.
-
2001-09-09$30,000 101-char remark
Show marketing remark (101 chars)
Investors delight. Seperate utilities, 2 beds each unit. Roof 10 years old, fenced yard 2 car garage.
-
1989-01-13soldstatus $29,000
-
1976-05-26soldstatus $25,900
ⓘ Source: listings_history table (triggers on properties + properties_extension) + one-shot
backfill from property_details.listing_events for pre-trigger history.
Tax reassessment forecast OH · Partial reset (capped growth)
- Current annual tax
- $1,472 · $123/mo
- Projected year-2 tax
- $1,472 · $123/mo
- Expected delta
- $0/yr ($0/mo · 0.0%)
ⓘ Screening estimate from a state-policy table — verify with the county assessor before closing.
Climate risk First Street
- Flood 1/10 Low FEMA zone X (unshaded) · 0% chance over 30 yrs
- Wildfire 1/10 Low
- Heat 3/10 Moderate 7 d/yr ≥100°F today · 16 d/yr by 30 yrs out
- Wind 2/10 Low
- Air quality 2/10 Low 1 unhealthy d/yr today · 2 by 30 yrs out
Nearby sold comps map
Loading sold comps map…
Walkable amenities ~0.75 mi
Loading nearby amenities…
Taxation est. · year 1
- Rental income
- $22,188
- − Mortgage interest
- −$4,756
- − Property taxes
- −$1,472
- − Insurance
- −$424
- − Repairs & maintenance
- −$1,775
- − Management
- −$1,775
- − Depreciation
- −$2,470
- Taxable income
- $9,515
- Est. tax owed @ 24.0%
- −$2,284
- After-tax cash flow
- $8,005/yr
For passive investors: Depreciation is non-cash, so a rental often shows a tax loss while cash-flowing — sheltering income. Rental losses are passive: they offset passive income freely, and up to $25,000/yr can offset ordinary (W-2) income if you actively participate and your MAGI is under $100k (phasing out to $0 by $150k); unused losses carry forward. On sale, claimed depreciation is recaptured at up to 25%, and gains may owe capital-gains tax (a 1031 exchange can defer both). Figures are a year-1 estimate at your 24.0% rate — not tax advice; consult a CPA.
Schools (NCES district)
- District
- Toledo City
- NCES district ID
- 3904490
- Math proficiency
- 15% ▼ -16.00%
- Reading proficiency
- 24% ▼ -13.00%
- Median HH income
- $32,137
- Composite
- 15.76/100
- National rank
- #9276
- State rank
- #634 of 656 in OH
Livability — Toledo
- Score
- 66/100
- State rank
- #645
- US rank
- #11442
Category grades
Schools grade is shown separately in the Schools card above.
Census & demographics
- Census place
- Toledo, OH
- County
- Lucas County · 380,724 people
- City population
- 280,811
- Metro
- Toledo, OH
- Population (ZIP)
- 24,441
- Household income
- $39,118
- Rent vs Own
- Severe rent burden
- 1257.0
Population outlook (Lucas County) Hauer SSP2
- Today (2025)
- 420,751 people
- By 2030
- 410,187 · -2.5%
- By 2040
- 384,019 · -8.7%
- By 2050
- 355,125 · -15.6%
- By 2075
- 291,683 · -30.7%
- By 2100
- 233,670 · -44.5%
Race, ethnicity, and origin ACS 2023
- Neighborhood character
- Diverse neighborhood (Simpson 0.61)
- Race & ethnicity
- White 57% Hispanic / Latino 21% Black 14% Two or more races 14%
- Hispanic origin (detail)
- Mexican 17% Puerto Rican 2%
- Common ancestry
- Romanian 3% Lithuanian 2% Portuguese 1%
- Foreign-born
- 3% · Canada
- Languages at home
- 91% English-only · Spanish 7% Arabic 1%
Political lean MEDSL · Lucas
- 2024 margin
- D (+12.6) · D 55.8% · R 43.2%
- 2008→2024 swing
- -18.9pp toward R · 2008: 31.4pp · 2024: 12.6pp
- All cycles
- 2024: D+12.6 2020: D+16.8 2016: D+17.4 2012: D+30.4 2008: D+31.4
Not yet ingested
- Civics
- —
Market trends
- HPI YoY
- ▼ -47.85%
- Current HPI
- 138.6894
- Rent YoY
- ▲ 5.37%
- Metro
- Toledo, OH
- State GDP YoY
- ▲ 1.98%
- F500 in state
- 48
Industry mix (Fortune 500 HQ in OH)
| Industry | F500 HQs | Revenue |
|---|---|---|
| Insurance | 3 | $145B |
|
||
| Industrial Machinery | 3 | $49B |
|
||
| Financial Services | 3 | $24B |
|
||
| Consumer Goods | 2 | $93B |
|
||
| Aerospace / Defense | 2 | $47B |
|
||
| Utilities | 2 | $33B |
|
||
Price history
+227.8% since first listed32 events — show timeline
- 2026-04-09 Price Changed $84,900 NORIS
- 2025-11-12 Listed $89,900 NORIS
- 2025-10-14 Price Changed $28,000 NORIS
- 2025-10-14 Price Changed $62,000 NORIS
- 2025-10-14 Price Changed $10,000 NORIS
- 2024-03-14 Rental Removed $700 APPFOLIO
- 2024-02-04 Listed for Rent $700 APPFOLIO
- 2023-08-03 Sold (Public Records) $62,000 Public Records
- 2023-07-28 Sold (MLS) $62,000 NORIS
- 2023-06-20 Contingent — NORIS
- 2023-06-14 Listed $79,000 NORIS
- 2023-01-18 Listing Removed — NORIS
- 2022-07-18 Listed $79,900 NORIS
- 2022-02-27 Price Changed $575 RENT.
- 2020-10-09 Sold (Public Records) $24,900 Public Records
- 2014-07-16 Sold (MLS) $10,000 NORIS
- 2014-04-11 Listed $11,000 NORIS
- 2014-03-29 Listing Removed — NORIS
- 2014-01-29 Listed $11,000 NORIS
- 2013-10-03 Listing Removed — NORIS
- 2013-03-08 Listed $11,000 NORIS
- 2013-03-06 Listing Removed — NORIS
- 2012-11-07 Listing Removed — NORIS
- 2012-11-07 Listed $19,900 NORIS
- 2012-05-07 Listed $40,000 NORIS
- 2012-04-05 Listing Removed — NORIS
- 2010-10-15 Listed $33,900 NORIS
- 2002-03-19 Sold (Public Records) $28,000 Public Records
- 2002-03-14 Sold (MLS) $28,000 NORIS
- 2001-09-09 Listed $30,000 NORIS
- 1989-01-13 Sold (Public Records) $29,000 Public Records
- 1976-05-26 Sold (Public Records) $25,900 Public Records
Property tax history
+2.9%/yrLatest (2025): $1,472 · -4.3% YoY. Source: county tax records.
Cash-flow waterfall
monthlySold comps — $/sqft
last 12 mo · ≤1 miLoading sold comps…