3 Parkland Dr · Kalama, WA
Flood risk 1/10 · Minimal
- FEMA flood zone
- X (unshaded)
- Chance of flooding over 30 yrs
- 0.0%
- Est. flood insurance / yr
- $507 – $1,088
Fire risk 4/10 · Minor
- Est. fire insurance / yr
- $604 – $1,122
Heat risk 2/10 · Minimal
- Hot days now (above 88°F)
- 7 days/yr
- Hot days in 30 yrs
- 14 days/yr
Wind risk 1/10 · Minimal
- Chance of severe wind over 30 yrs
- —
Air-quality risk 7/10 · Major
- Unhealthy air days now
- 8 days/yr
- Unhealthy air days in 30 yrs
- 8 days/yr
Risk factors via First Street. Map © Google.
Why this score? — see what drove the C+ grade
The composite is a weighted blend of 9 inputs, each scored 0–100. Each bar is that input's sub-score; the figure is the points it added to the 100-point composite (weight × sub-score).
- Cash flow +25.6/30.0
- DSCR +8.5/10.0
- ARV discount +7.5/15.0
- 1% rule +6.6/10.0
- Schools +4.7/10.0
- Livability +3.6/5.0
- Rent growth +2.5/5.0
- Condition / age +2.5/5.0
- Appreciation +0.0/10.0
$179,900
🖨 Deal sheet (PDF) 📄 Offer letter ✓ Due diligence
Listing remarks MLS
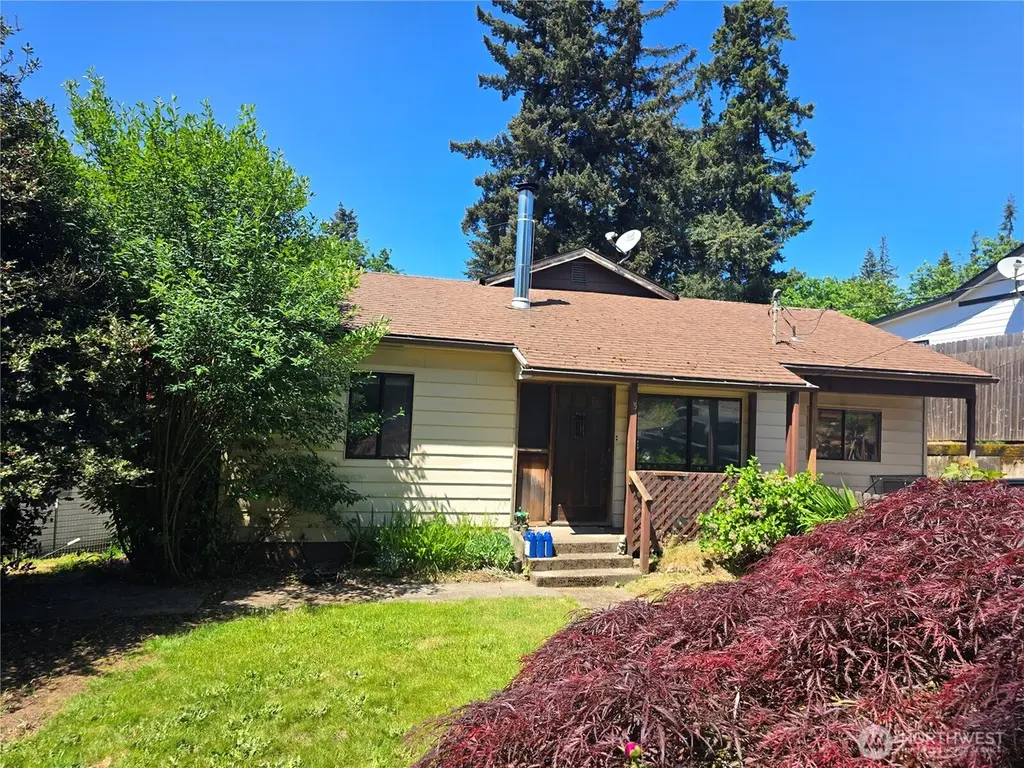
Investor special! Located in the desired Kalama area this 3 bed 2 bath single level home has so much potential. Bring your tool belt and restore this home to its full potential, 2 living spaces, 2 fireplaces and a large backyard! Close to downtown Kalama. 30 min to Vancouver, 15 minutes to Longview! Cash only!
Key facts
- 2 fireplaces
- Large backyard
- 2 living spaces
Tags
Property features AI
Finance
- Other: Living area approximately 1,670 square feet; Lot about 0.2149 acres; Level topography
- Financial info: Listing terms: Cash
Exterior
- Parking: Driveway
- Security: Partially fenced (security feature)
- Utilities: Electric energy source; Public water; Sewer connected
- Home design: Single-family residence, one story; Built on lot; House structure; Entry level: main level living
- Construction: Wood construction; Composition roof; Poured concrete foundation; Built on lot
- Exterior features: Partially fenced yard; Wood exterior
Interior
- Bedrooms: Three bedrooms (all on the main level)
- Flooring: Hardwood flooring; Carpet flooring
- Bathrooms: One full bathroom; One three-quarter bathroom; Two showers; One bathtub; Two main-level bathrooms
- Heating & cooling: Wall furnace heating; No central air
- Interior features: Two wood-burning fireplaces; Fireplace present
Neighborhood map
What this means for you Summary
Snapshot
- This is a 3-bed/1.5-bath single-family listed at $180k.
Deal economics
- At list price, monthly cash flow is $427 ($5k/yr) — positive.
- The deal already cash-flows at list — no discount required.
- Meets the 1% rule at list price ($2k rent vs $180k).
- Cap rate 9.1% vs local median 1.9% in Kalama — top-decile yield for the area; either an underpriced asset or a hidden risk that comps aren't pricing in. Stress-test before assuming the spread holds.
Location & tenants
- Location reads 72/100 on livability (#217 in WA) — a middle-class / working-renter tenant base. Strengths: employment A+, housing A+, crime A; Watch: health & safety C-, cost of living D+, amenities F.
- Kalama School District (rural): math 46% / reading 56% proficiency, ranked #124 of 291 in WA (top 43%) — acceptable for families but not a draw, mixed tenant base, ~2y average lease.
- Zoned schools: Kalama Elem School (562 students, 42% FRL).
- Market conditions: 150 active listings in the ZIP; 1 comparable units currently listed for rent nearby; 348 units permitted in Cowlitz County in 2024 (40 in 5+ unit buildings).
Forward outlook
- Local home prices are declining (-3.0%/yr); year-one equity from $1k of loan paydown is wiped out by about $5k of value loss. Plan a longer hold.
- Cowlitz County population projected to shrink 8% by 2050 — rents likely to lag national; underwrite the cash flow, not the appreciation.
Negotiation context
- Only 4 days on market — expect competitive offers; lowballing is unlikely to land.
- 2 sale attempts with the ask held roughly flat each time — persistent listings suggest the price (not the market) is what's stuck; bring a comps-based counter.
Risks & watch-outs
- Watch-outs: built in 1950 — expect roof / HVAC / electrical / plumbing capex.
Questions for the listing agent
- Built in 1950 — when were the roof, HVAC, electrical panel, plumbing, and water heater last replaced?
- Is there a deadline driving the sale (1031 exchange, divorce, estate, relocation)? That informs how much negotiation room exists.
- What's the average days-on-market for RENTAL listings here right now (not sales)? A rising rental-DOM trend means longer vacancies and softer asking-rent achievability than the comps imply.
- What's the recent tenant-quality profile in this submarket — average credit score on applications, eviction rate, late-payment / NSF rate, and stable-employment percentage? A property-management company in the area should have these aggregated.
- How much new for-sale + rental construction is in the pipeline within 1–3 miles? Heavy new supply typically softens prices + rents 12–24 months out; constrained supply supports both.
Investment metrics
- 1% rule
- 1.16% ✓
- Cap rate
- 9.14%
- Cash-on-cash
- 10.17%
- DSCR
- 1.45
- GRM
- 7.2
CMA / ARV
- ARV (median comp)
- $484,833
- List price
- $179,900
- Delta
- -62.89%
- Verdict
- UNDERPRICED
- Comps
- 20 within 1.0 mi
Show comp detail 12 sales within ~0.75 mi
| Address | Dist | Beds/Ba | Sqft | Sold | Price | $/sf | Match |
|---|---|---|---|---|---|---|---|
| 3 Parkland Dr | 0.00mi | 3/2.0 | 1,670 (0%) | 1mo | $215,000 | $129 | 97 |
| 323 Stone Park | 0.29mi | 3/2.0 | 1,721 (+3%) | 1mo | $525,000 | $305 | 79 |
| 126 Stone Ct | 0.36mi | 3/2.5 | 1,687 (+1%) | 3mo | $472,800 | $280 | 75 |
| 411 Stepping Stone St | 0.34mi | 3/2.0 | 1,640 (-2%) | 6mo | $474,900 | $290 | 74 |
| 617 Stone Park | 0.42mi | 3/2.0 | 1,868 (+12%) | 0mo | $519,900 | $278 | 58 |
| 113 Cedar Springs Loop | 0.20mi | 3/2.0 | 1,435 (-14%) | 12mo | $489,500 | $341 | 55 |
| 612 Stone View Way | 0.43mi | 3/2.0 | 1,470 (-12%) | 6mo | $485,000 | $330 | 52 |
| 614 Stone Park | 0.40mi | 3/1.5 | 1,571 (-6%) | 23mo | $495,000 | $315 | 52 |
| 800 China Garden Rd | 0.49mi | 3/2.5 | 1,825 (+9%) | 13mo | $499,900 | $274 | 46 |
| 316 N 3rd St | 0.70mi | 4/1.0 (+1) | 1,497 (-10%) | 14mo | $466,000 | $311 | 32 |
| 6931 Old Pacific Hwy S | 0.62mi | 3/2.5 | 1,441 (-14%) | 15mo | $499,000 | $346 | 31 |
| 323 Taylor Rd | 0.70mi | 2/2.0 (-1) | 1,425 (-15%) | 12mo | $445,000 | $312 | 26 |
Match score weights: distance 35% · size 25% · config 20% · recency 20%. Top-matched comps best support the ARV.
Projected returns pro-forma
-3.0% appreciation · 3.0% rent growth · sell at horizon
- IRR
- -1.0%
- Equity multiple
- 0.96×
- Total profit
- $-1,930
- Equity at exit
- $26,824
- IRR
- 8.7%
- Equity multiple
- 1.66×
- Total profit
- $33,433
- Equity at exit
- $15,554
Cash invested: $50,372 (down + closing). Projections, not guarantees.
Landlord ↔ Tenant lean methodology
- Overall (STATE)
- 28 Tenant-Leaning
- State Washington
- 28 Tenant-Leaning · D+8
- County
- — inherits STATE
- City
- — inherits STATE
ZIP-level market 98625
- Home prices YoY
- -26.0%
- Active inventory
- 150
- Price-to-rent
- 7.2×
Monthly cashflow live
- Estimated rent
- $2,095 medium interval (Pro) →
- Mortgage (P&I)
- −$943
- Tax from tax record
- −$210 /mo · $2,515/yr
- Insurance
- −$75
- HOA
- −$0
- Vacancy / Maint / Mgmt
- −$440
- Net cashflow
- $427
Break-even live
Sensitivity live
| Price | -10% $529 | -5% $478 | +0% $427 | +5% $376 | +10% $325 |
|---|---|---|---|---|---|
| Rent | -10% $262 | -5% $344 | +0% $427 | +5% $510 | +10% $593 |
| Rate | -1.0pp $518 | -0.5pp $473 | base $427 | +0.5pp $380 | +1.0pp $333 |
UW: 25.0% down · 7.5% · 30yr · 1.5% tax · 5.0% vac · 8.0% maint · 8.0% mgmt
Financing live
Cash to close
- Down payment
- $44,975
- Closing costs
- $5,397
- Reserves months
- —
- Total cash needed
- —
Loan-product check · same deal, 3 products live
Conventional
25% down · 7.5% · 30yr
- Down + closing
- —
- Monthly P&I
- —
- Monthly cashflow
- —
- DSCR
- —
- Eligible?
- —
Personal DTI + credit; lowest rate.
DSCR
20% down · 8.5% · 30yr
- Down + closing
- —
- Monthly P&I
- —
- Monthly cashflow
- —
- DSCR
- —
- Eligible?
- —
No personal income docs; deal must DSCR.
Hard money
10% down · 12.0% · 12mo
- Down + closing
- —
- Monthly P&I
- —
- Monthly cashflow
- —
- DSCR
- —
- Eligible?
- —
Short-term bridge; refi at stabilization.
Rent comps 1 comps
| Address | Beds | Baths | Sqft | Rent | $/sqft | DOM | Units | Dist |
|---|---|---|---|---|---|---|---|---|
| 193 Cloverdale Rd Unit C Kalama, WA | 3.0 | 2.5 | 1400 | $2,095 | $1.50 | 24d | 1 | 0.10mi |
Listing history 2 events
-
2026-05-15$179,900 Active
Show marketing remark (317 chars)
Investor special! Located in the desired Kalama area this 3 bed 2 bath single level home has so much potential. Bring your tool belt and restore this home to its full potential, 2 living spaces, 2 fireplaces and a large backyard! Close to downtown Kalama. 30 min to Vancouver, 15 minutes to Longview! Cash only!
-
2026-05-15$179,900 Active 317-char remark
Show marketing remark (317 chars)
Investor special! Located in the desired Kalama area this 3 bed 2 bath single level home has so much potential. Bring your tool belt and restore this home to its full potential, 2 living spaces, 2 fireplaces and a large backyard! Close to downtown Kalama. 30 min to Vancouver, 15 minutes to Longview! Cash only!
ⓘ Source: listings_history table (triggers on properties + properties_extension) + one-shot
backfill from property_details.listing_events for pre-trigger history.
Tax reassessment forecast WA · Resets to sale price
- Current annual tax
- $2,515 · $210/mo
- Projected year-2 tax
- $2,515 · $210/mo
- Expected delta
- $0/yr ($0/mo · 0.0%)
ⓘ Screening estimate from a state-policy table — verify with the county assessor before closing.
Climate risk First Street
- Flood 1/10 Low FEMA zone X (unshaded) · 0% chance over 30 yrs
- Wildfire 4/10 Moderate
- Heat 2/10 Low 7 d/yr ≥88°F today · 14 d/yr by 30 yrs out
- Wind 1/10 Low
- Air quality 7/10 Severe 8 unhealthy d/yr today · 8 by 30 yrs out
Nearby sold comps map
Loading sold comps map…
Walkable amenities ~0.75 mi
Loading nearby amenities…
Taxation est. · year 1
- Rental income
- $25,140
- − Mortgage interest
- −$10,077
- − Property taxes
- −$2,515
- − Insurance
- −$900
- − Repairs & maintenance
- −$2,011
- − Management
- −$2,011
- − Depreciation
- −$5,233
- Taxable income
- $2,392
- Est. tax owed @ 24.0%
- −$574
- After-tax cash flow
- $4,551/yr
For passive investors: Depreciation is non-cash, so a rental often shows a tax loss while cash-flowing — sheltering income. Rental losses are passive: they offset passive income freely, and up to $25,000/yr can offset ordinary (W-2) income if you actively participate and your MAGI is under $100k (phasing out to $0 by $150k); unused losses carry forward. On sale, claimed depreciation is recaptured at up to 25%, and gains may owe capital-gains tax (a 1031 exchange can defer both). Figures are a year-1 estimate at your 24.0% rate — not tax advice; consult a CPA.
Schools (NCES district)
- District
- Kalama School District
- NCES district ID
- 5303810
- Math proficiency
- 46% ▲ 3.00%
- Reading proficiency
- 56% ▼ -2.00%
- Median HH income
- $62,351
- Composite
- 46.75/100
- National rank
- #5238
- State rank
- #124 of 291 in WA
Livability — Kalama
- Score
- 72/100
- State rank
- #217
- US rank
- #6179
Category grades
Schools grade is shown separately in the Schools card above.
Census & demographics
- Census place
- Kalama, WA
- Population (ZIP)
- 7,020
Population outlook (Cowlitz County) Hauer SSP2
- Today (2025)
- 104,780 people
- By 2030
- 103,980 · -0.8%
- By 2040
- 100,769 · -3.8%
- By 2050
- 96,685 · -7.7%
- By 2075
- 86,454 · -17.5%
- By 2100
- 74,052 · -29.3%
Race, ethnicity, and origin ACS 2023
- Neighborhood character
- Predominantly White (87%)
- Race & ethnicity
- White 87% Two or more races 9% Hispanic / Latino 6%
- Hispanic origin (detail)
- Mexican 6%
- Common ancestry
- Italian 7% Iranian 5% Portuguese 3%
- Foreign-born
- 4% · Canada
- Languages at home
- 94% English-only · Spanish 5% Russian/Polish/Slavic 1%
Political lean MEDSL · Cowlitz
- 2024 margin
- R (+19.9) · D 38.7% · R 58.6% · Other 2.7%
- 2008→2024 swing
- -31.1pp toward R · 2008: 11.2pp · 2024: -19.9pp
- All cycles
- 2024: R+19.9 2020: R+17.4 2016: R+13.7 2012: D+4.4 2008: D+11.2
Not yet ingested
- Civics
- —
Market trends
- HPI YoY
- ▼ -89.34%
- Current HPI
- 253.7882
- Rent YoY
- —
- Metro
- —
- State GDP YoY
- ▲ 4.65%
- F500 in state
- 22
Industry mix (Fortune 500 HQ in WA)
| Industry | F500 HQs | Revenue |
|---|---|---|
| Retail | 2 | $269B |
|
||
| Technology / Retail | 1 | $638B |
|
||
| Technology | 1 | $245B |
|
||
| Telecommunications | 1 | $38B |
|
||
| Food / Beverage | 1 | $36B |
|
||
| Automotive / Trucks | 1 | $34B |
|
||
Price history
+19.5% since first listed7 events — show timeline
- 2026-05-28 Sold (Public Records) $215,000 Public Records
- 2026-05-28 Sold (MLS) $215,000 RMLS
- 2026-05-28 Sold (MLS) $215,000 NWMLS as Distributed by MLS Grid
- 2026-05-20 Pending — NWMLS as Distributed by MLS Grid
- 2026-05-19 Pending — RMLS
- 2026-05-15 Listed $179,900 RMLS
- 2026-05-15 Listed $179,900 NWMLS as Distributed by MLS Grid
Property tax history
+4.9%/yrLatest (2026): $2,515 · +8.1% YoY. Source: county tax records.
Cash-flow waterfall
monthlySold comps — $/sqft
last 12 mo · ≤1 miLoading sold comps…