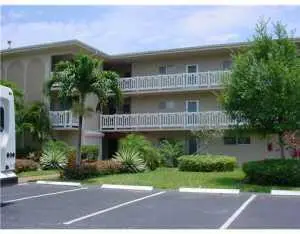
2687 Garden Dr N #108 · Palm Springs, FL
Flood risk 1/10 · Minimal
- FEMA flood zone
- X (unshaded)
- Chance of flooding over 30 yrs
- 0.0%
- Est. flood insurance / yr
- $507 – $1,088
Fire risk 1/10 · Minimal
- Est. fire insurance / yr
- $947 – $1,759
Heat risk 10/10 · Severe
- Hot days now (above 105°F)
- 7 days/yr
- Hot days in 30 yrs
- 27 days/yr
Wind risk 10/10 · Severe
- Chance of severe wind over 30 yrs
- 99.0%
Air-quality risk 2/10 · Minimal
- Unhealthy air days now
- 0 days/yr
- Unhealthy air days in 30 yrs
- 2 days/yr
Risk factors via First Street. Map © Google.
Why this score? — see what drove the B- grade
The composite is a weighted blend of 9 inputs, each scored 0–100. Each bar is that input's sub-score; the figure is the points it added to the 100-point composite (weight × sub-score).
- Cash flow +28.7/30.0
- 1% rule +10.0/10.0
- DSCR +10.0/10.0
- ARV discount +7.5/15.0
- Schools +4.3/10.0
- Livability +3.7/5.0
- Condition / age +2.5/5.0
- Rent growth +1.9/5.0
- Appreciation +0.0/10.0
$69,500
🖨 Deal sheet 📄 Offer letter ✓ Due diligence
Listing remarks MLS
bank owned foreclosure
Key facts
- New a/c
- Updated kitchen
- Updated bathroom
Tags
Property features AI
Finance
- Other: Number of units in community: 855
- HOA & community: Community has an association; Monthly association fee (includes cable TV, internet, water); Community amenities: billiard room, clubhouse, fitness center, laundry, pool, heated pool, sauna, shuffleboard court, workshop area, trash chute, bocce ball, courtesy bus, internet included, library, putting green, street lights; Senior community; Pets not allowed
Exterior
- Parking: 1 parking space (asphalt surface)
- Utilities: Public water; Public sewer; Cable available; Propane; Sewer connected; Water connected; Electricity not available
- Home design: Condominium; One level; Resale property; Faces west
- Construction: Block/CBS construction; Tar and gravel roof; Block foundation; Building has 3 stories
- Exterior features: Asphalt road surface; Not waterfront
Interior
- Kitchen: Dishwasher; Electric range; Refrigerator
- Bedrooms: 2 bedrooms on the main level
- Flooring: Laminate flooring; Tile flooring
- Bathrooms: 1 full bathroom on the main level
- Heating & cooling: Central heating; Central air conditioning
- Interior features: Bedroom layout is stacked; Furnished
- Laundry & utility: Laundry in common area
Neighborhood map
What this means for you Summary
Snapshot
- This is a 2-bed/1.0-bath condo listed at $70k.
Deal economics
- At list price, monthly cash flow is $231 ($3k/yr) — positive.
- The deal already cash-flows at list — no discount required.
- Meets the 1% rule at list price ($2k rent vs $70k).
- Recommended offer: $65k (6.0% below list) — sets the bar for market timing.
Location & tenants
- Location reads 73/100 on livability (#297 in FL) — a middle-class / working-renter tenant base. Strengths: cost of living A+, housing A+, health & safety A; Watch: employment D+, amenities F, commute F.
- Palm Beach (suburban): math 46% / reading 53% proficiency, ranked #34 of 73 in FL (top 47%) — families likely to look elsewhere, expect single-tenant / working-renter base with shorter leases.
- Zoned schools: Meadow Park Elementary School (math 64% / reading 73%, grade B+, #409 of 2,144 statewide, top 20%, 809 students, 65% FRL); Forest Hill Community High School (math 20% / reading 41%, grade F, #434 of 667 statewide, top 66%, 2,407 students, 66% FRL).
- Market conditions: Rents soft (-2.5%/yr); 274 active listings in the ZIP; 40 comparable units currently listed for rent nearby; rentals at typical pace (median 22d on market — plan ~3-4 weeks tenant-placement turnaround); 3,974 units permitted in Palm Beach County in 2024 (1,012 in 5+ unit buildings).
- This rent runs 36% of the median local income ($62k/yr) — at the standard rent-burdened threshold; future hikes will face affordability resistance.
Forward outlook
- Local home prices are declining (-3.0%/yr); year-one equity from $481 of loan paydown is wiped out by about $2k of value loss. Plan a longer hold.
- Palm Beach County population projected at +30% by 2050 — long-run rental-demand tailwind backs the buy-and-hold thesis.
Negotiation context
- It's been on market 88 days — a 6% lower offer ($65k) is reasonable based on typical stale-listing flexibility.
- 6 sale attempts since 15y ago; this cycle's ask has dropped $15k (18%) from the opening price — seller is motivated, your offer sets the floor, not the list.
- Current owner paid $23k; list at $70k implies a 202% gain — meaningful room to come down on a strong offer.
Risks & watch-outs
- Watch-outs: HOA is 39% of rent.
- Climate carrying-cost: severe wind risk, 99% chance of damaging wind over 30y; extreme-heat days projected 7→27/yr by 2055 (HVAC capex compounding) — expect insurance premiums to compound above CPI over the hold.
Questions for the listing agent
- It's been on market 88 days. Have you received any prior offers? Is the seller open to a 6% concession, seller financing, or rate buy-down credit?
- Built in 1968 — when were the roof, HVAC, electrical panel, plumbing, and water heater last replaced?
- What does the HOA fee cover, when was the last increase, and are there any pending special assessments or reserve-fund shortfalls?
- Any open or pending special assessments — roof, HVAC, plumbing, elevator, façade? What's the per-unit balance and payoff schedule, and is the seller paying it off at close or rolling it to the buyer?
- Why hasn't it sold? Are there any deal-killer items the seller is aware of (foundation, flood, title, zoning, code violations)?
- Is there a deadline driving the sale (1031 exchange, divorce, estate, relocation)? That informs how much negotiation room exists.
- Schools are D-rated, which usually means shorter tenancies and higher turnover. Who's the typical renter profile here, and what's been the actual vacancy rate?
- What's the average days-on-market for RENTAL listings here right now (not sales)? A rising rental-DOM trend means longer vacancies and softer asking-rent achievability than the comps imply.
- What's the recent tenant-quality profile in this submarket — average credit score on applications, eviction rate, late-payment / NSF rate, and stable-employment percentage? A property-management company in the area should have these aggregated.
- How much new apartment / multifamily construction is in the pipeline within 1–3 miles? Heavy new supply (>2% of stock underway) typically softens rents 12–24 months out; light construction supports rent growth.
Investment metrics
- 1% rule
- 2.68% ✓
- Cap rate
- 10.28%
- Cash-on-cash
- 14.24%
- DSCR
- 1.63
- GRM
- 3.1
CMA / ARV
No comps found within radius.
Projected returns pro-forma
-3.0% appreciation · 0.0% rent growth · sell at horizon
- IRR
- -2.2%
- Equity multiple
- 0.92×
- Total profit
- $-1,510
- Equity at exit
- $10,363
- IRR
- -1.5%
- Equity multiple
- 0.93×
- Total profit
- $-1,443
- Equity at exit
- $6,009
Cash invested: $19,460 (down + closing). Projections, not guarantees.
Landlord ↔ Tenant lean methodology
- Overall (STATE)
- 87 Strongly Landlord-Friendly
- State Florida
- 87 Strongly Landlord-Friendly · R+3
- County
- — inherits STATE
- City
- — inherits STATE
ZIP-level market 33461
- Rents YoY
- -2.5%
- Active inventory
- 274
- Price-to-rent
- 3.1×
Monthly cashflow live
- Estimated rent
- $1,862 high interval (Pro) →
- Mortgage (P&I)
- −$364
- Tax from tax record
- −$120 /mo · $1,442/yr
- Insurance
- −$29
- HOA
- −$726
- Vacancy / Maint / Mgmt
- −$391
- Net cashflow
- $231
Break-even live
UW: 25.0% down · 7.5% · 30yr · 1.5% tax · 5.0% vac · 8.0% maint · 8.0% mgmt
Financing live
Cash to close
- Down payment
- $17,375
- Closing costs
- $2,085
- Reserves months
- —
- Total cash needed
- —
Loan-product check · same deal, 3 products live
Conventional
25% down · 7.5% · 30yr
- Down + closing
- —
- Monthly P&I
- —
- Monthly cashflow
- —
- DSCR
- —
- Eligible?
- —
Personal DTI + credit; lowest rate.
DSCR
20% down · 8.5% · 30yr
- Down + closing
- —
- Monthly P&I
- —
- Monthly cashflow
- —
- DSCR
- —
- Eligible?
- —
No personal income docs; deal must DSCR.
Hard money
10% down · 12.0% · 12mo
- Down + closing
- —
- Monthly P&I
- —
- Monthly cashflow
- —
- DSCR
- —
- Eligible?
- —
Short-term bridge; refi at stabilization.
Rent comps 40 comps
| Address | Beds | Baths | Sqft | Rent | $/sqft | DOM | Units | Dist |
|---|---|---|---|---|---|---|---|---|
| 2668 Garden Dr N #312 Lake Worth, FL | 2.0 | 2.0 | 1080 | $1,500 | $1.39 | 1d | 1 | 0.04mi |
| 2668 Garden Dr N #312 Lake Worth, FL | 2.0 | 2.0 | 1080 | $1,500 | $1.39 | 4d | 1 | 0.04mi |
| 2721 Garden Dr N #105 Lake Worth, FL | 2.0 | 1.0 | 894 | $1,800 | $2.01 | 20d | 1 | 0.06mi |
| 2581 Garden Dr N #203 Lake Worth, FL | 2.0 | 2.0 | 894 | $1,650 | $1.85 | 15d | 1 | 0.10mi |
| 2581 Garden Dr N #203 Lake Worth, FL | 2.0 | 2.0 | 894 | $1,650 | $1.85 | 7d | 1 | 0.10mi |
| 2791 S Florida Mango Rd Lake Worth, FL | 2.0 | 2.0 | 1100 | $1,995 | $1.81 | 20d | 1 | 0.13mi |
| 2566 Garden Dr S Lake Worth Beach, FL | 1.0 | 1.0 | 744 | $1,395 | $1.88 | 24d | 1 | 0.20mi |
| 2856 Garden Dr S #112 Lake Worth, FL | 2.0 | 1.0 | 894 | $1,800 | $2.01 | 24d | 1 | 0.25mi |
| 100 Rex Ave Palm Springs, FL | 2.0 | 2.0 | 1000 | $1,850 | $1.85 | 24d | 3 | 0.46mi |
| 2901 10th Ave N Palm Springs, FL | 2.0 | 1.0 | 900 | $1,795 | $1.99 | 24d | 1 | 0.52mi |
| 910 Rudolf Rd Lake Worth, FL | 3.0 | 1.0 | 1000 | $2,500 | $2.50 | 24d | 1 | 0.52mi |
| 2508 10th Ave N Lake Worth Beach, FL | 2.0 | 1.0 | 800 | $1,672 | $2.09 | 10d | 1 | 0.52mi |
| 2508 10th Ave N Lake Worth Beach, FL | 2.0 | 1.0 | 800 | $1,746 | $2.18 | 14d | 1 | 0.52mi |
| 2508 10th Ave N Lake Worth Beach, FL | 3.0 | 2.0 | 1025 | $2,557 | $2.49 | 24d | 1 | 0.52mi |
| 220 Henthorne Dr Palm Springs, FL | 1.0–2.0 | 1.5–2.0 | 900 | $1,850 | $2.06 | 24d | 4 | 0.57mi |
| 3386 Rudolph Rd Lake Worth Beach, FL | 2.0 | 1.0 | 840 | $2,100 | $2.50 | 3d | 1 | 0.59mi |
| 124 Abaco Dr Palm Springs, FL | 3.0 | 2.0 | 988 | $2,900 | $2.94 | 15d | 1 | 0.66mi |
| 3440 Rudolph Rd Unit 3440-03 Lake Worth Beach, FL | 2.0 | 2.0 | 935 | $2,100 | $2.25 | 18d | 1 | 0.67mi |
| 3431 Helena Dr Lake Worth, FL | 2.0 | 2.0 | 935 | $2,075 | $2.22 | 14d | 2 | 0.69mi |
| 3431 Helena Dr Unit 3481-11 Lake Worth Beach, FL | 2.0 | 2.0 | 935 | $2,050 | $2.19 | 24d | 1 | 0.69mi |
| 3481 Helena Dr Unit 11 Lake Worth Beach, FL | 2.0 | 2.0 | 935 | $2,050 | $2.19 | 24d | 1 | 0.70mi |
| 3300 Boutwell Rd Lake Worth Beach, FL | 1.0–2.0 | 1.0–2.0 | 765 | $2,720 | $3.56 | 24d | 1 | 0.71mi |
| 965 Manor Dr Palm Springs, FL | 2.0 | 1.0 | 687 | $1,995 | $2.90 | 1d | 5 | 0.77mi |
| 3031 French Ave Lake Worth, FL | 3.0 | 1.0 | 840 | $2,400 | $2.86 | 7d | 1 | 0.77mi |
| 1065 Manor Dr Palm Springs, FL | 2.0 | 2.0 | 1098 | $2,100 | $1.91 | 3d | 1 | 0.77mi |
| 1742 W Terrace Dr Lake Worth Beach, FL | 2.0 | 1.5 | 1000 | $2,700 | $2.70 | 24d | 1 | 0.79mi |
| 3017 Buckley Ave Lake Worth, FL | 2.0 | 1.0 | 720 | $2,200 | $3.06 | 24d | 1 | 0.81mi |
| 1020 Manor Dr Palm Springs, FL | 2.0 | 2.0 | 1098 | $2,200 | $2.00 | 22d | 1 | 0.83mi |
| 1755 Forest Hill Blvd Lake Clarke Shores, FL | 1.0 | 1.0 | 662 | $1,595 | $2.41 | 7d | 1 | 0.84mi |
| 1016 Manor Dr Unit 5c Palm Springs, FL | 2.0 | 2.0 | 1098 | $2,256 | $2.05 | 24d | 1 | 0.84mi |
| 2085 S Congress Ave Palm Springs, FL | 1.0–3.0 | 1.0–2.0 | 963 | $2,558 | $2.65 | 1d | 14 | 0.86mi |
| 225 Bonnie Blvd #116 Palm Springs, FL | 2.0 | 2.0 | 988 | $1,850 | $1.87 | 18d | 1 | 0.88mi |
| 225 Bonnie Blvd Palm Springs, FL | 1.0–2.0 | 1.5–2.0 | 944 | $1,850 | $1.96 | 24d | 2 | 0.88mi |
| 246 Cypress Ln Lake Worth Beach, FL | 1.0–2.0 | 1.0 | 850 | $1,750 | $2.06 | 24d | 2 | 0.91mi |
| 240 Alemeda Dr Palm Springs, FL | 1.0–2.0 | 1.0–2.0 | 825 | $1,850 | $2.24 | 24d | 3 | 0.92mi |
| 247 Cypress Ln Unit 246-C12 Palm Springs, FL | 2.0 | 1.0 | 850 | $1,750 | $2.06 | 5d | 1 | 0.92mi |
| 247 Cypress Ln Unit 246-C06 Palm Springs, FL | 2.0 | 1.0 | 850 | $1,750 | $2.06 | 24d | 1 | 0.92mi |
| 200 Bonnie Blvd #132 Palm Springs, FL | 1.0 | 1.0 | 577 | $1,500 | $2.60 | 22d | 1 | 0.96mi |
| 500 Bonnie Blvd #165 Palm Springs, FL | 1.0 | 1.5 | 782 | $1,350 | $1.73 | 24d | 1 | 0.97mi |
| 1802 Waterview Cir #1802 Palm Springs, FL | 2.0 | 2.0 | 951 | $1,925 | $2.02 | 24d | 1 | 0.99mi |
HOA detail condo
- Monthly dues
- $726 · $8,712/yr
- Assessments
- None detected in remarks — confirm with the listing agent.
Listing history 27 events
-
2026-06-18days on market $69,500 Active 88 DOM
-
2026-06-17days on market $69,500 Active 87 DOM
-
2026-06-16days on market $69,500 Active 86 DOM
-
2026-06-15days on market $69,500 Active 85 DOM
-
2026-06-13days on market $69,500 Active 83 DOM
-
2026-06-09days on market $69,500 Active 79 DOM
-
2026-06-08days on market $69,500 Active 78 DOM
-
2026-06-07days on market $69,500 Active 77 DOM
-
2026-06-04days on market $69,500 Active 74 DOM
-
2026-06-03days on market $69,500 Active 73 DOM
-
2026-06-02days on market $69,500 Active 72 DOM
-
2026-06-02price $69,500 Active 71 DOM
-
2026-06-01days on market $84,900 Active 71 DOM
-
2026-05-31days on market $84,900 Active 70 DOM
-
2026-03-21$84,900 Active
-
2023-08-27historical
-
2023-04-06status Active
-
2023-03-11historical Active Under Contract
-
2023-03-07status Active
-
2023-03-03historical Active Under Contract
-
2023-02-27$119,900 Active
-
2012-01-20soldstatus $23,000 22-char remark
Show marketing remark (22 chars)
bank owned foreclosure
-
2012-01-16historical 22-char remark
Show marketing remark (22 chars)
bank owned foreclosure
-
2011-10-05$23,000 22-char remark
Show marketing remark (22 chars)
bank owned foreclosure
-
2011-09-03historical
-
2011-04-20$25,000
-
2004-04-06soldstatus $44,000
ⓘ Source: listings_history table (triggers on properties + properties_extension) + one-shot
backfill from property_details.listing_events for pre-trigger history.
Tax reassessment forecast FL · Resets to sale price
- Current annual tax
- $1,442 · $120/mo
- Projected year-2 tax
- $1,442 · $120/mo
- Expected delta
- $0/yr ($0/mo · 0.0%)
ⓘ Screening estimate from a state-policy table — verify with the county assessor before closing.
Climate risk First Street
- Flood 1/10 Low FEMA zone X (unshaded) · 0% chance over 30 yrs
- Wildfire 1/10 Low
- Heat 10/10 Extreme 7 d/yr ≥105°F today · 27 d/yr by 30 yrs out
- Wind 10/10 Extreme 99% chance of damaging wind over 30 yrs
- Air quality 2/10 Low 0 unhealthy d/yr today · 2 by 30 yrs out
Nearby sold comps map
Loading sold comps map…
Walkable amenities ~0.75 mi
Loading nearby amenities…
Taxation est. · year 1
- Rental income
- $22,338
- − Mortgage interest
- −$3,893
- − Property taxes
- −$1,442
- − Insurance
- −$348
- − Repairs & maintenance
- −$1,787
- − Management
- −$1,787
- − HOA
- −$8,712
- − Depreciation
- −$2,022
- Taxable income
- $2,348
- Est. tax owed @ 24.0%
- −$563
- After-tax cash flow
- $2,209/yr
For passive investors: Depreciation is non-cash, so a rental often shows a tax loss while cash-flowing — sheltering income. Rental losses are passive: they offset passive income freely, and up to $25,000/yr can offset ordinary (W-2) income if you actively participate and your MAGI is under $100k (phasing out to $0 by $150k); unused losses carry forward. On sale, claimed depreciation is recaptured at up to 25%, and gains may owe capital-gains tax (a 1031 exchange can defer both). Figures are a year-1 estimate at your 24.0% rate — not tax advice; consult a CPA.
Schools (NCES district)
- District
- Palm Beach
- NCES district ID
- 1201500
- Math proficiency
- 46% ▼ -16.00%
- Reading proficiency
- 53% ▼ -4.00%
- Median HH income
- $53,943
- Composite
- 42.72/100
- National rank
- #3160
- State rank
- #34 of 73 in FL
Livability — Palm Springs
- Score
- 73/100
- State rank
- #297
- US rank
- #5045
Category grades
Schools grade is shown separately in the Schools card above.
Census & demographics
- County
- Palm Beach County · 1,438,312 people
- City population
- 49,443
- Metro
- Miami-Fort Lauderdale-Pompano Beach, FL
- Population (ZIP)
- 49,443
- Household income
- $61,963
- Rent vs Own
- Severe rent burden
- 2663.0
Population outlook (Palm Beach County) Hauer SSP2
- Today (2025)
- 1,637,487 people
- By 2030
- 1,743,255 · +6.5%
- By 2040
- 1,948,712 · +19.0%
- By 2050
- 2,132,979 · +30.3%
- By 2075
- 2,530,027 · +54.5%
- By 2100
- 2,706,979 · +65.3%
Race, ethnicity, and origin ACS 2023
- Neighborhood character
- Diverse neighborhood (Simpson 0.59)
- Race & ethnicity
- Hispanic / Latino 59% Two or more races 26% White 20% Black 17% Asian 2%
- Hispanic origin (detail)
- Mexican 11% Puerto Rican 6% Cuban 16% Dominican 2%
- Common ancestry
- Hispanic 9% Romanian 1% Lithuanian 1%
- Foreign-born
- 52% · Canada, Jamaica
- Languages at home
- 31% English-only · Spanish 54% French/Haitian/Cajun 10% Other Indo-European 2%
Political lean MEDSL · Palm Beach
- 2024 margin
- Toss-up / Even · D 50.0% · R 49.2%
- 2008→2024 swing
- -22.1pp toward R · 2008: 22.9pp · 2024: 0.8pp
- All cycles
- 2024: D+0.8 2020: D+12.8 2016: D+15.3 2012: D+17.0 2008: D+22.9
Not yet ingested
- Civics
- —
Market trends
- HPI YoY
- ▼ -269.03%
- Current HPI
- 493.0041
- Rent YoY
- ▼ -2.47%
- Metro
- Miami-Fort Lauderdale-Pompano Beach, FL
- State GDP YoY
- ▲ 3.28%
- F500 in state
- 36
Industry mix (Fortune 500 HQ in FL)
| Industry | F500 HQs | Revenue |
|---|---|---|
| Industrial Technology | 2 | $29B |
|
||
| Insurance | 2 | $17B |
|
||
| Retail | 1 | $60B |
|
||
| Technology Distribution | 1 | $58B |
|
||
| Homebuilding | 1 | $35B |
|
||
| Technology Manufacturing | 1 | $35B |
|
||
Price history
+93.0% since first listed13 events — show timeline
- 2026-03-21 Listed $84,900 Beaches MLS
- 2023-08-27 Listing Removed — Beaches MLS
- 2023-04-06 Relisted — Beaches MLS
- 2023-03-11 Contingent — Beaches MLS
- 2023-03-07 Relisted — Beaches MLS
- 2023-03-03 Contingent — Beaches MLS
- 2023-02-27 Listed $119,900 Beaches MLS
- 2012-01-20 Sold (MLS) $23,000 Beaches MLS
- 2012-01-16 Listing Removed — Beaches MLS
- 2011-10-05 Listed $23,000 Beaches MLS
- 2011-09-03 Listing Removed — Beaches MLS
- 2011-04-20 Listed $25,000 Beaches MLS
- 2004-04-06 Sold (Public Records) $44,000 Public Records
Property tax history
+5.2%/yrLatest (2025): $1,442 · -3.2% YoY. Source: county tax records.
Cash-flow waterfall
monthlySold comps — $/sqft
last 12 mo · ≤1 miLoading sold comps…