 Triplex
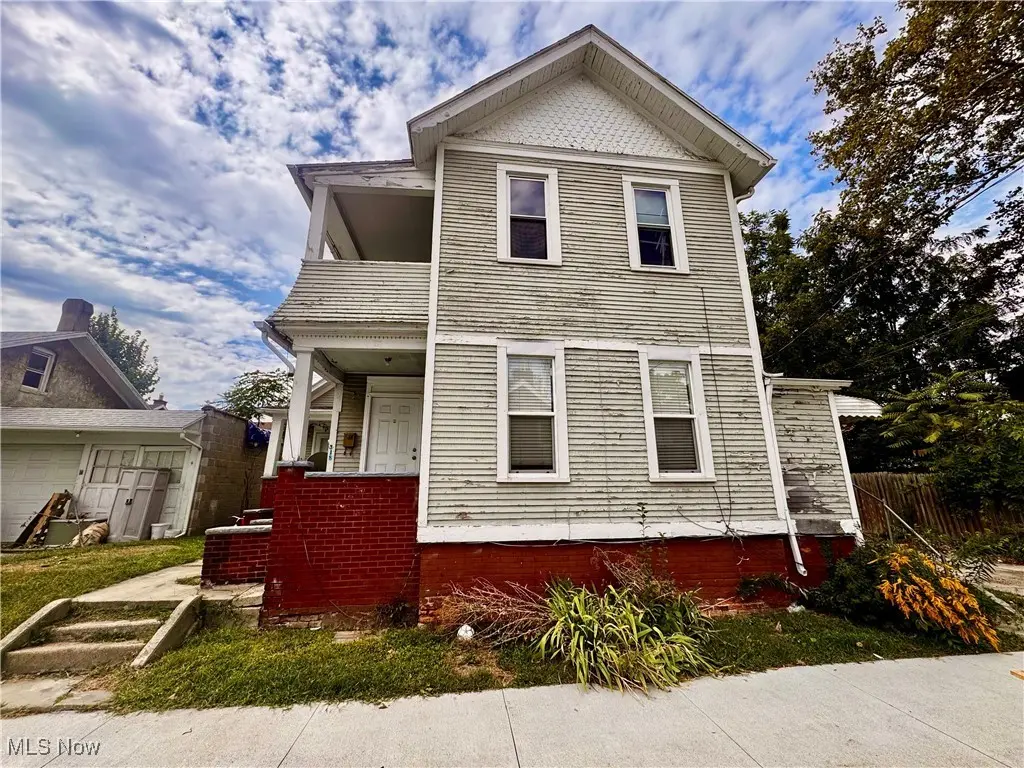
318 Courtland Ave · Toledo, OH
Flood risk 1/10 · Minimal
- FEMA flood zone
- X (unshaded)
- Chance of flooding over 30 yrs
- 0.0%
- Est. flood insurance / yr
- $507 – $1,088
Fire risk 1/10 · Minimal
- Est. fire insurance / yr
- $713 – $1,323
Heat risk 3/10 · Minor
- Hot days now (above 100°F)
- 7 days/yr
- Hot days in 30 yrs
- 16 days/yr
Wind risk 2/10 · Minimal
- Chance of severe wind over 30 yrs
- —
Air-quality risk 2/10 · Minimal
- Unhealthy air days now
- 1 days/yr
- Unhealthy air days in 30 yrs
- 2 days/yr
Risk factors via First Street. Map © Google.
Why this score? — see what drove the B grade
The composite is a weighted blend of 9 inputs, each scored 0–100. Each bar is that input's sub-score; the figure is the points it added to the 100-point composite (weight × sub-score).
- Cash flow +30.0/30.0
- 1% rule +10.0/10.0
- DSCR +10.0/10.0
- ARV discount +7.5/15.0
- Appreciation +5.4/10.0
- Rent growth +4.5/5.0
- Livability +3.3/5.0
- Condition / age +2.5/5.0
- Schools +1.6/10.0
$134,900
🖨 Deal sheet 📄 Offer letter ✓ Due diligence
Multi-family units
County records classify this as Multi-Family (2-4 Unit). Listing-text estimate: 3 units. confirmed
Listing remarks MLS
Investors looking to own a cash flowing three unit in Southwest Toledo. This recently renovated multifamily is an income generator. Previously bringing in over $2000/month. The two lower units have two bedrooms and one bath with fully applianced kitchens. Upstairs you'll find a nice layout with a bonus room great for a kids play room and or office. Plenty of room to push the rents to market pricing. This unit is located in the Walbridge area and walkable to parks, schools, churches and public transportation. Seller will offer a $10,000 for exterior renovations for list price offers. Age of mechanicals unknown.
Key facts
- Bonus room
- Walkable to schools
- Recently renovated
Tags
Neighborhood map
What this means for you Summary
Snapshot
- This is a 3 × 5-bed/1.0-bath units multifamily listed at $135k.
Deal economics
- At list price, monthly cash flow is $2k ($27k/yr) — positive. Per door: $755/mo.
- The deal already cash-flows at list — no discount required.
- Meets the 1% rule at list price ($4k rent vs $135k).
- Recommended offer: $119k (12.0% below list) — sets the bar for market timing.
- Cap rate 26.4% vs local median 7.6% in Toledo — top-decile yield for the area; either an underpriced asset or a hidden risk that comps aren't pricing in. Stress-test before assuming the spread holds.
Location & tenants
- Location reads 66/100 on livability (#645 in OH) — a middle-class / working-renter tenant base. Strengths: cost of living A+, housing A+, health & safety A+; Watch: amenities C-, schools D-, crime F.
- Toledo City (urban): math 15% / reading 24% proficiency, ranked #634 of 656 in OH (top 97%) — low school quality limits family demand, transient renter base, plan for 1-2y turnover; 72% free/reduced lunch — lower-income household profile, screen leases tightly.
- Market conditions: Rents rising fast (+7.8%/yr); 99 active listings in the ZIP; lower-income renter base — watch delinquency; 415 units permitted in Lucas County in 2024 (122 in 5+ unit buildings).
- At $3,971/mo this rent would consume 113% of the median local household income ($42k/yr) (locally 1603% of renters already pay >50% of income on rent) — very limited rent-growth headroom before tenants either downsize or default.
Forward outlook
- In year one you build about $2k of equity ($933 loan paydown + $1k appreciation (0.8% local appreciation)).
- Lucas County population projected at -16% by 2050 — secular population decline; favor cash flow + early exit over multi-decade hold.
- At projected returns (0.8% appreciation + 7.8% rent growth), your $38k cash investment doubles in ~2 years — after that, you're playing with house money.
Negotiation context
- It's been on market 184 days — a 12% lower offer ($119k) is reasonable based on typical stale-listing flexibility.
- 11 sale attempts since 26y ago; this cycle's ask is 8% above the opening price — seller raised mid-cycle; expect resistance to lowballs.
Risks & watch-outs
- Watch-outs: built in 1907 — expect roof / HVAC / electrical / plumbing capex.
Questions for the listing agent
- It's been on market 184 days. Have you received any prior offers? Is the seller open to a 12% concession, seller financing, or rate buy-down credit?
- Can we see the unit-by-unit rent roll, current vacancy, and any below-market leases? What's the average tenancy length?
- What capital expenditures (roof, boiler, parking lot, exteriors) have been made in the last 5 years, and what's planned in the next 2?
- Built in 1907 — when were the roof, HVAC, electrical panel, plumbing, and water heater last replaced?
- Why hasn't it sold? Are there any deal-killer items the seller is aware of (foundation, flood, title, zoning, code violations)?
- Is there a deadline driving the sale (1031 exchange, divorce, estate, relocation)? That informs how much negotiation room exists.
- Schools are D-rated, which usually means shorter tenancies and higher turnover. Who's the typical renter profile here, and what's been the actual vacancy rate?
- Crime grade is F in this area — have there been break-ins, vandalism, or insurance claims at this property in the last 3 years? What carrier currently insures it and at what premium?
- What's the average days-on-market for RENTAL listings here right now (not sales)? A rising rental-DOM trend means longer vacancies and softer asking-rent achievability than the comps imply.
- What's the recent tenant-quality profile in this submarket — average credit score on applications, eviction rate, late-payment / NSF rate, and stable-employment percentage? A property-management company in the area should have these aggregated.
- How much new apartment / multifamily construction is in the pipeline within 1–3 miles? Heavy new supply (>2% of stock underway) typically softens rents 12–24 months out; light construction supports rent growth.
Investment metrics
- 1% rule
- 2.94% ✓
- Cap rate
- 26.43%
- Cash-on-cash
- 71.93%
- DSCR
- 4.20
- GRM
- 2.8
CMA / ARV
- ARV (median comp)
- $51,525
- List price
- $134,900
- Delta
- 161.81%
- Verdict
- OVERPRICED
- Comps
- 20 within 1.0 mi
Show comp detail 5 sales within ~0.75 mi
| Address | Dist | Beds/Ba | Sqft | Sold | Price | $/sf | Match |
|---|---|---|---|---|---|---|---|
| 702 Boalt St | 0.38mi | 4/2.0 (-1) | 2,236 (+0%) | 4mo | $50,000 | $22 | 69 |
| 303 Jervis St | 0.16mi | 4/2.0 (-1) | 2,424 (+9%) | 17mo | $48,000 | $20 | 55 |
| 225 Wasaon St | 0.44mi | 4/2.0 (-1) | 2,024 (-9%) | 1mo | $18,700 | $9 | 54 |
| 821 Vinton Street St | 0.43mi | 4/2.0 (-1) | 2,002 (-10%) | 10mo | $52,000 | $26 | 46 |
| 825 Colburn St | 0.63mi | 4/2.0 (-1) | 1,999 (-10%) | 4mo | $50,000 | $25 | 41 |
Match score weights: distance 35% · size 25% · config 20% · recency 20%. Top-matched comps best support the ARV.
Projected returns pro-forma
0.75% appreciation · 7.8% rent growth · sell at horizon
- IRR
- 79.6%
- Equity multiple
- 5.37×
- Total profit
- $165,214
- Equity at exit
- $44,302
- IRR
- 82.0%
- Equity multiple
- 12.76×
- Total profit
- $444,105
- Equity at exit
- $57,542
Cash invested: $37,772 (down + closing). Projections, not guarantees.
Landlord ↔ Tenant lean methodology
- Overall (STATE)
- 73 Landlord-Friendly
- State Ohio
- 73 Landlord-Friendly · R+6
- County
- — inherits STATE
- City
- — inherits STATE
ZIP-level market 43609
- Home prices YoY
- 0.3%
- Rents YoY
- 7.8%
- Active inventory
- 99
- Price-to-rent
- 8.5×
Monthly cashflow live
- Estimated rent
- $3,971 medium interval (Pro) →
- Mortgage (P&I)
- −$707
- Tax from tax record
- −$109 /mo · $1,311/yr
- Insurance
- −$56
- HOA
- −$0
- Vacancy / Maint / Mgmt
- −$834
- Net cashflow
- $2,264
Break-even live
3-unit breakdown (identical units grouped — click to expand)
| Units | Beds | Baths | Est. rent |
|---|---|---|---|
| 3× units | 5 | 1 | $3,972 |
| #1 | 5 | 1 | $1,324 |
| #2 | 5 | 1 | $1,324 |
| #3 | 5 | 1 | $1,324 |
| Total (3 units) | $3,971 | ||
UW: 25.0% down · 7.5% · 30yr · 1.5% tax · 5.0% vac · 8.0% maint · 8.0% mgmt
Financing live
Cash to close
- Down payment
- $33,725
- Closing costs
- $4,047
- Reserves months
- —
- Total cash needed
- —
Loan-product check · same deal, 3 products live
Conventional
25% down · 7.5% · 30yr
- Down + closing
- —
- Monthly P&I
- —
- Monthly cashflow
- —
- DSCR
- —
- Eligible?
- —
Personal DTI + credit; lowest rate.
DSCR
20% down · 8.5% · 30yr
- Down + closing
- —
- Monthly P&I
- —
- Monthly cashflow
- —
- DSCR
- —
- Eligible?
- —
No personal income docs; deal must DSCR.
Hard money
10% down · 12.0% · 12mo
- Down + closing
- —
- Monthly P&I
- —
- Monthly cashflow
- —
- DSCR
- —
- Eligible?
- —
Short-term bridge; refi at stabilization.
Listing history 45 events
-
2026-06-18days on market $134,900 Active 184 DOM
-
2026-06-17days on market $134,900 Active 183 DOM
-
2026-06-16days on market $134,900 Active 182 DOM
-
2026-06-15days on market $134,900 Active 181 DOM
-
2026-06-14days on market $134,900 Active 179 DOM
-
2026-06-10days on market $134,900 Active 176 DOM
-
2026-06-09days on market $134,900 Active 175 DOM
-
2026-06-08days on market $134,900 Active 174 DOM
-
2026-06-07days on market $134,900 Active 173 DOM
-
2026-06-05days on market $134,900 Active 170 DOM
-
2026-06-03days on market $134,900 Active 169 DOM
-
2026-06-02days on market $134,900 Active 168 DOM
-
2026-06-01days on market $134,900 Active 167 DOM
-
2026-05-31days on market $134,900 Active 166 DOM
-
2026-05-30days on market $134,900 Active 165 DOM
-
2026-05-19price $134,900 617-char remark
Show marketing remark (617 chars)
Investors looking to own a cash flowing three unit in Southwest Toledo. This recently renovated multifamily is an income generator. Previously bringing in over $2000/month. The two lower units have two bedrooms and one bath with fully applianced kitchens. Upstairs you'll find a nice layout with a bonus room great for a kids play room and or office. Plenty of room to push the rents to market pricing. This unit is located in the Walbridge area and walkable to parks, schools, churches and public transportation. Seller will offer a $10,000 for exterior renovations for list price offers. Age of mechanicals unknown.
-
2026-01-30status Active 617-char remark
Show marketing remark (617 chars)
Investors looking to own a cash flowing three unit in Southwest Toledo. This recently renovated multifamily is an income generator. Previously bringing in over $2000/month. The two lower units have two bedrooms and one bath with fully applianced kitchens. Upstairs you'll find a nice layout with a bonus room great for a kids play room and or office. Plenty of room to push the rents to market pricing. This unit is located in the Walbridge area and walkable to parks, schools, churches and public transportation. Seller will offer a $10,000 for exterior renovations for list price offers. Age of mechanicals unknown.
-
2025-11-06status Pending 617-char remark
Show marketing remark (617 chars)
Investors looking to own a cash flowing three unit in Southwest Toledo. This recently renovated multifamily is an income generator. Previously bringing in over $2000/month. The two lower units have two bedrooms and one bath with fully applianced kitchens. Upstairs you'll find a nice layout with a bonus room great for a kids play room and or office. Plenty of room to push the rents to market pricing. This unit is located in the Walbridge area and walkable to parks, schools, churches and public transportation. Seller will offer a $10,000 for exterior renovations for list price offers. Age of mechanicals unknown.
-
2025-10-14price $145,000 292-char remark
Show marketing remark (292 chars)
FOR COMP PURPOSES ONLY:318 Courtland $96,000 274 Maryland: $51,500 678 Thomas: $51,500 Sold as a package deal for $199,000 total. Taxes are listed as total for all 3 properties. 7 units total between all 3 properties. 6 units leased. 1 vacant currently. Total rents currently: $2920.
-
2025-10-14price $50,000
Show marketing remark (292 chars)
FOR COMP PURPOSES ONLY:318 Courtland $96,000 274 Maryland: $51,500 678 Thomas: $51,500 Sold as a package deal for $199,000 total. Taxes are listed as total for all 3 properties. 7 units total between all 3 properties. 6 units leased. 1 vacant currently. Total rents currently: $2920.
-
2025-09-22$124,900 Active 617-char remark
Show marketing remark (617 chars)
Investors looking to own a cash flowing three unit in Southwest Toledo. This recently renovated multifamily is an income generator. Previously bringing in over $2000/month. The two lower units have two bedrooms and one bath with fully applianced kitchens. Upstairs you'll find a nice layout with a bonus room great for a kids play room and or office. Plenty of room to push the rents to market pricing. This unit is located in the Walbridge area and walkable to parks, schools, churches and public transportation. Seller will offer a $10,000 for exterior renovations for list price offers. Age of mechanicals unknown.
-
2022-06-18status Pending 292-char remark
Show marketing remark (292 chars)
FOR COMP PURPOSES ONLY:318 Courtland $96,000 274 Maryland: $51,500 678 Thomas: $51,500 Sold as a package deal for $199,000 total. Taxes are listed as total for all 3 properties. 7 units total between all 3 properties. 6 units leased. 1 vacant currently. Total rents currently: $2920.
-
2022-06-17soldstatus $145,000 Closed 292-char remark
Show marketing remark (292 chars)
FOR COMP PURPOSES ONLY:318 Courtland $96,000 274 Maryland: $51,500 678 Thomas: $51,500 Sold as a package deal for $199,000 total. Taxes are listed as total for all 3 properties. 7 units total between all 3 properties. 6 units leased. 1 vacant currently. Total rents currently: $2920.
-
2022-03-25Contingent 292-char remark
Show marketing remark (292 chars)
FOR COMP PURPOSES ONLY:318 Courtland $96,000 274 Maryland: $51,500 678 Thomas: $51,500 Sold as a package deal for $199,000 total. Taxes are listed as total for all 3 properties. 7 units total between all 3 properties. 6 units leased. 1 vacant currently. Total rents currently: $2920.
-
2022-03-25$199,000 292-char remark
Show marketing remark (292 chars)
FOR COMP PURPOSES ONLY:318 Courtland $96,000 274 Maryland: $51,500 678 Thomas: $51,500 Sold as a package deal for $199,000 total. Taxes are listed as total for all 3 properties. 7 units total between all 3 properties. 6 units leased. 1 vacant currently. Total rents currently: $2920.
-
2021-10-09status Active
-
2021-10-09historical Contingent
-
2021-10-09historical
-
2021-10-07$89,900 Active
-
2020-11-02soldstatus $50,000
-
2020-10-26soldstatus $50,000
-
2020-08-27$53,000
-
2019-10-31soldstatus $43,500
-
2019-09-24soldstatus $43,500
-
2019-09-23price $43,500
-
2019-08-28$42,900
-
2006-08-15soldstatus $19,000
-
2006-08-14historical
-
2006-03-28$27,900
-
2000-12-19historical
-
2000-09-17$39,500
-
2000-08-26historical
-
2000-06-04$32,500
-
1992-07-14soldstatus $19,900
-
1974-07-12soldstatus $19,000
ⓘ Source: listings_history table (triggers on properties + properties_extension) + one-shot
backfill from property_details.listing_events for pre-trigger history.
Tax reassessment forecast OH · Partial reset (capped growth)
- Current annual tax
- $1,311 · $109/mo
- Projected year-2 tax
- $1,708 · $142/mo
- Expected delta
- +$397/yr (+$33/mo · 30.2%)
ⓘ Screening estimate from a state-policy table — verify with the county assessor before closing.
Climate risk First Street
- Flood 1/10 Low FEMA zone X (unshaded) · 0% chance over 30 yrs
- Wildfire 1/10 Low
- Heat 3/10 Moderate 7 d/yr ≥100°F today · 16 d/yr by 30 yrs out
- Wind 2/10 Low
- Air quality 2/10 Low 1 unhealthy d/yr today · 2 by 30 yrs out
Nearby sold comps map
Loading sold comps map…
Walkable amenities ~0.75 mi
Loading nearby amenities…
Taxation est. · year 1
- Rental income
- $47,652
- − Mortgage interest
- −$7,556
- − Property taxes
- −$1,311
- − Insurance
- −$674
- − Repairs & maintenance
- −$3,812
- − Management
- −$3,812
- − Depreciation
- −$3,924
- Taxable income
- $26,561
- Est. tax owed @ 24.0%
- −$6,375
- After-tax cash flow
- $20,795/yr
For passive investors: Depreciation is non-cash, so a rental often shows a tax loss while cash-flowing — sheltering income. Rental losses are passive: they offset passive income freely, and up to $25,000/yr can offset ordinary (W-2) income if you actively participate and your MAGI is under $100k (phasing out to $0 by $150k); unused losses carry forward. On sale, claimed depreciation is recaptured at up to 25%, and gains may owe capital-gains tax (a 1031 exchange can defer both). Figures are a year-1 estimate at your 24.0% rate — not tax advice; consult a CPA.
Schools (NCES district)
- District
- Toledo City
- NCES district ID
- 3904490
- Math proficiency
- 15% ▼ -16.00%
- Reading proficiency
- 24% ▼ -13.00%
- Median HH income
- $32,137
- Composite
- 15.76/100
- National rank
- #9276
- State rank
- #634 of 656 in OH
Livability — Toledo
- Score
- 66/100
- State rank
- #645
- US rank
- #11442
Category grades
Schools grade is shown separately in the Schools card above.
Census & demographics
- Census place
- Toledo, OH
- County
- Lucas County · 380,724 people
- City population
- 280,811
- Metro
- Toledo, OH
- Population (ZIP)
- 21,404
- Household income
- $42,313
- Rent vs Own
- Severe rent burden
- 1603.0
Population outlook (Lucas County) Hauer SSP2
- Today (2025)
- 420,751 people
- By 2030
- 410,187 · -2.5%
- By 2040
- 384,019 · -8.7%
- By 2050
- 355,125 · -15.6%
- By 2075
- 291,683 · -30.7%
- By 2100
- 233,670 · -44.5%
Race, ethnicity, and origin ACS 2023
- Neighborhood character
- Diverse neighborhood (Simpson 0.66)
- Race & ethnicity
- White 47% Black 29% Hispanic / Latino 17% Two or more races 9%
- Hispanic origin (detail)
- Mexican 15%
- Common ancestry
- Romanian 5% Lithuanian 2% Italian 1%
- Foreign-born
- 4% · Canada, China
- Languages at home
- 92% English-only · Spanish 5% Arabic 1% French/Haitian/Cajun 1%
Political lean MEDSL · Lucas
- 2024 margin
- D (+12.6) · D 55.8% · R 43.2%
- 2008→2024 swing
- -18.9pp toward R · 2008: 31.4pp · 2024: 12.6pp
- All cycles
- 2024: D+12.6 2020: D+16.8 2016: D+17.4 2012: D+30.4 2008: D+31.4
Not yet ingested
- Civics
- —
Market trends
- HPI YoY
- ▲ 0.75%
- Current HPI
- 235.2515
- Rent YoY
- ▲ 7.80%
- Metro
- Toledo, OH
- State GDP YoY
- ▲ 1.98%
- F500 in state
- 48
Industry mix (Fortune 500 HQ in OH)
| Industry | F500 HQs | Revenue |
|---|---|---|
| Insurance | 3 | $145B |
|
||
| Industrial Machinery | 3 | $49B |
|
||
| Financial Services | 3 | $24B |
|
||
| Consumer Goods | 2 | $93B |
|
||
| Aerospace / Defense | 2 | $47B |
|
||
| Utilities | 2 | $33B |
|
||
Price history
+610.0% since first listed30 events — show timeline
- 2026-05-19 Price Changed $134,900 MLSNOW
- 2026-01-30 Relisted — MLSNOW
- 2025-11-06 Pending — MLSNOW
- 2025-10-14 Price Changed $145,000 NORIS
- 2025-10-14 Price Changed $50,000 NORIS
- 2025-09-22 Listed $124,900 MLSNOW
- 2022-06-18 Pending — NORIS
- 2022-06-17 Sold (MLS) $145,000 NORIS
- 2022-03-25 Listed — NORIS
- 2022-03-25 Listed $199,000 NORIS
- 2021-10-09 Relisted — NORIS
- 2021-10-09 Contingent — NORIS
- 2021-10-09 Listing Removed — NORIS
- 2021-10-07 Listed $89,900 NORIS
- 2020-11-02 Sold (Public Records) $50,000 Public Records
- 2020-10-26 Sold (MLS) $50,000 NORIS
- 2020-08-27 Listed $53,000 NORIS
- 2019-10-31 Sold (Public Records) $43,500 Public Records
- 2019-09-24 Sold (MLS) $43,500 NORIS
- 2019-09-23 Price Changed $43,500 NORIS
- 2019-08-28 Listed $42,900 NORIS
- 2006-08-15 Sold (Public Records) $19,000 Public Records
- 2006-08-14 Listing Removed — NORIS
- 2006-03-28 Listed $27,900 NORIS
- 2000-12-19 Listing Removed — NORIS
- 2000-09-17 Listed $39,500 NORIS
- 2000-08-26 Listing Removed — NORIS
- 2000-06-04 Listed $32,500 NORIS
- 1992-07-14 Sold (Public Records) $19,900 Public Records
- 1974-07-12 Sold (Public Records) $19,000 Public Records
Property tax history
+3.5%/yrLatest (2025): $1,311 · -7.7% YoY. Source: county tax records.
Cash-flow waterfall
monthlySold comps — $/sqft
last 12 mo · ≤1 miLoading sold comps…