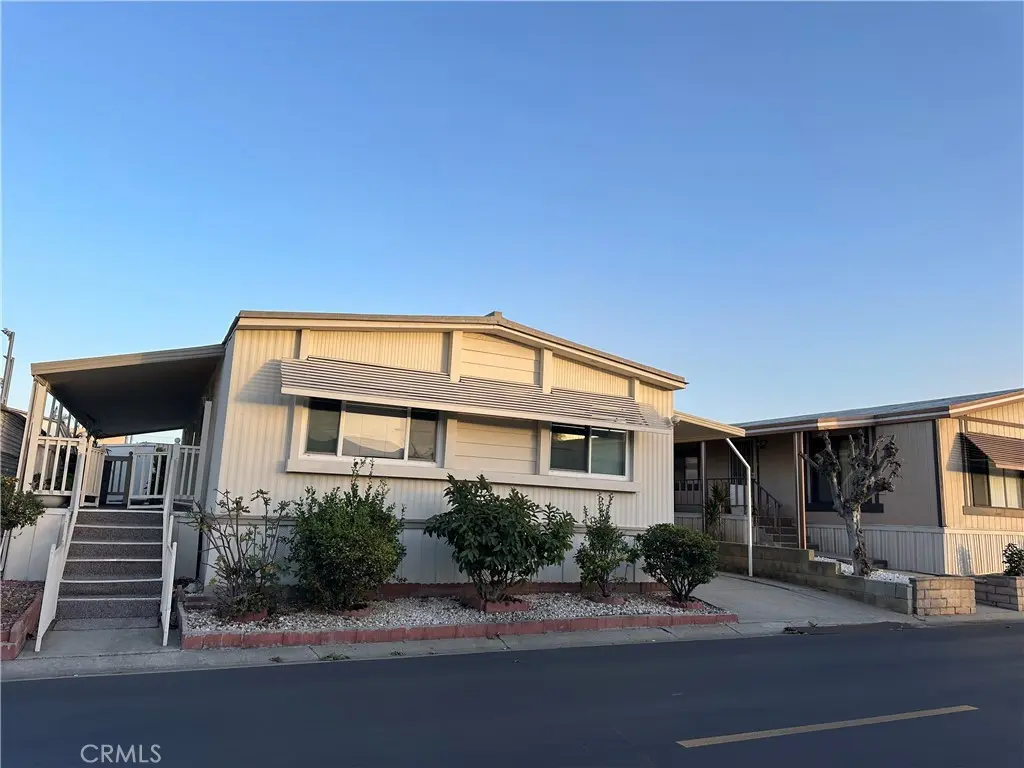
1441 S Paso Real Ave #30 · Rowland Heights, CA
Flood risk 1/10 · Minimal
- FEMA flood zone
- X (unshaded)
- Chance of flooding over 30 yrs
- 0.0%
- Est. flood insurance / yr
- $507 – $1,088
Fire risk 1/10 · Minimal
- Est. fire insurance / yr
- $659 – $1,223
Heat risk 6/10 · Moderate
- Hot days now (above 99°F)
- 7 days/yr
- Hot days in 30 yrs
- 21 days/yr
Wind risk 1/10 · Minimal
- Chance of severe wind over 30 yrs
- —
Air-quality risk 7/10 · Major
- Unhealthy air days now
- 13 days/yr
- Unhealthy air days in 30 yrs
- 14 days/yr
Risk factors via First Street. Map © Google.
Why this score? — see what drove the B+ grade
The composite is a weighted blend of 9 inputs, each scored 0–100. Each bar is that input's sub-score; the figure is the points it added to the 100-point composite (weight × sub-score).
- Cash flow +30.0/30.0
- ARV discount +15.0/15.0
- 1% rule +10.0/10.0
- DSCR +10.0/10.0
- Rent growth +5.0/5.0
- Schools +4.5/10.0
- Livability +2.5/5.0
- Condition / age +2.5/5.0
- Appreciation +0.0/10.0
$155,000
🖨 Deal sheet 📄 Offer letter ✓ Due diligence
Listing remarks MLS
Spacious manufactured home located at the front entrance of a well-maintained community in the heart of Rowland Heights. This 2-bedroom home features a bonus room currently used as a third bedroom (unpermitted; buyer to verify). The home offers a generously sized primary bedroom, a bright and open living room, and an open-concept kitchen with a formal dining area. Additional highlights include an open laundry area and a three-car carport for ample parking. Step onto a large front porch—perfect for relaxing or entertaining. Community amenities include a heated pool, spa, clubhouse, conference room, and playground. Conveniently located within walking distance to markets, schools, bus lines, the post office, and shopping centers, with easy access to the 60 and 57 freeways. Situated in a quiet, family-friendly park in desirable Rowland Heights.
Key facts
- Community pool
- Built 1972
- Listed 60 days
Neighborhood map
What this means for you Summary
Snapshot
- This is a 3-bed/2.0-bath manufactured listed at $155k.
Deal economics
- At list price, monthly cash flow is $2k ($20k/yr) — positive.
- The deal already cash-flows at list — no discount required.
- Meets the 1% rule at list price ($3k rent vs $155k).
- Recommended offer: $150k (3.0% below list) — sets the bar for market timing.
- Cap rate 19.5% vs local median 2.7% in Rowland Heights — top-decile yield for the area; either an underpriced asset or a hidden risk that comps aren't pricing in. Stress-test before assuming the spread holds.
Location & tenants
- Location reads 50/100 on livability (#1,123 in CA) — a working-class tenant base; expect higher turnover. Strengths: employment A; Watch: crime C-, amenities F, commute F.
- Rowland Unified (suburban): math 40% / reading 62% proficiency, ranked #134 of 517 in CA (top 26%) — acceptable for families but not a draw, mixed tenant base, ~2y average lease.
- Market conditions: Rents rising fast (+10.3%/yr); 102 active listings in the ZIP; 26 comparable units currently listed for rent nearby; rentals at typical pace (median 18d on market — plan ~3-4 weeks tenant-placement turnaround); solid renter incomes; 19,697 units permitted in Los Angeles County in 2024 (9,426 in 5+ unit buildings).
- At $3,302/mo this rent would consume 48% of the median local household income ($83k/yr) (locally 1440% of renters already pay >50% of income on rent) — very limited rent-growth headroom before tenants either downsize or default.
Forward outlook
- Local home prices are declining (-3.0%/yr); year-one equity from $1k of loan paydown is wiped out by about $5k of value loss. Plan a longer hold.
- Los Angeles County population projected at +9% by 2050 — modest demand growth; plan on rents tracking national, not racing it.
- At projected returns (-3.0% appreciation + 8.0% rent growth), your $43k cash investment doubles in ~3 years — after that, you're playing with house money.
Negotiation context
- It's been on market 60 days — a 3% lower offer ($150k) is reasonable based on typical stale-listing flexibility.
- 16 sale attempts since 23y ago with the ask held roughly flat each time — persistent listings suggest the price (not the market) is what's stuck; bring a comps-based counter.
Risks & watch-outs
- Climate carrying-cost: extreme-heat days projected 7→21/yr by 2055 (HVAC capex compounding) — expect insurance premiums to compound above CPI over the hold.
Questions for the listing agent
- It's been on market 60 days. Have you received any prior offers? Is the seller open to a 3% concession, seller financing, or rate buy-down credit?
- Built in 1972 — when were the roof, HVAC, electrical panel, plumbing, and water heater last replaced?
- Is there a deadline driving the sale (1031 exchange, divorce, estate, relocation)? That informs how much negotiation room exists.
- What's the average days-on-market for RENTAL listings here right now (not sales)? A rising rental-DOM trend means longer vacancies and softer asking-rent achievability than the comps imply.
- What's the recent tenant-quality profile in this submarket — average credit score on applications, eviction rate, late-payment / NSF rate, and stable-employment percentage? A property-management company in the area should have these aggregated.
- How much new for-sale + rental construction is in the pipeline within 1–3 miles? Heavy new supply typically softens prices + rents 12–24 months out; constrained supply supports both.
Investment metrics
- 1% rule
- 2.13% ✓
- Cap rate
- 19.45%
- Cash-on-cash
- 47.00%
- DSCR
- 3.09
- GRM
- 3.9
CMA / ARV
- ARV (median comp)
- $203,446
- List price
- $155,000
- Delta
- -23.81%
- Verdict
- UNDERPRICED
- Comps
- 20 within 1.0 mi
Show comp detail 12 sales within ~0.75 mi
| Address | Dist | Beds/Ba | Sqft | Sold | Price | $/sf | Match |
|---|---|---|---|---|---|---|---|
| 1441 Paso Real Ave #216 | 0.00mi | 3/2.0 | 1,290 (+3%) | 11mo | $200,000 | $155 | 86 |
| 1441 Paso Real Ave #198 | 0.00mi | 2/2.0 (-1) | 1,152 (-8%) | 1mo | $85,000 | $74 | 81 |
| 1441 Paso Real Ave #123 | 0.00mi | 2/2.0 (-1) | 1,200 (-4%) | 11mo | $158,000 | $132 | 79 |
| 1441 Paso Real Ave #195 | 0.08mi | 4/2.0 (+1) | 1,224 (-2%) | 11mo | $208,000 | $170 | 78 |
| 1441 Paso Real Ave #119 | 0.00mi | 3/2.0 | 1,392 (+12%) | 4mo | $220,000 | $158 | 77 |
| 1440 Paso Real Ave #37 | 0.07mi | 2/2.0 (-1) | 1,344 (+8%) | 2mo | $175,000 | $130 | 77 |
| 1441 Paso Real Ave #186 | 0.10mi | 4/3.0 (+1) | 1,208 (-3%) | 6mo | $220,000 | $182 | 76 |
| 1441 Paso Real Ave #259 | 0.00mi | 4/2.0 (+1) | 1,296 (+4%) | 17mo | $190,000 | $147 | 75 |
| 1441 Paso Real Ave #269 | 0.00mi | 4/3.0 (+1) | 1,200 (-4%) | 19mo | $160,000 | $133 | 69 |
| 1560 S Otterbein #138 Ave #138 | 0.56mi | 3/2.0 | 1,320 (+6%) | 10mo | $300,000 | $227 | 56 |
| 1560 Otterbein Ave #12 | 0.56mi | 3/2.0 | 1,414 (+13%) | 4mo | $365,000 | $258 | 48 |
| 1560 S Otterbein Ave #6 | 0.56mi | 3/2.0 | 1,152 (-8%) | 18mo | $195,000 | $169 | 46 |
Match score weights: distance 35% · size 25% · config 20% · recency 20%. Top-matched comps best support the ARV.
Projected returns pro-forma
-3.0% appreciation · 8.0% rent growth · sell at horizon
- IRR
- 49.6%
- Equity multiple
- 3.32×
- Total profit
- $100,539
- Equity at exit
- $23,111
- IRR
- 57.0%
- Equity multiple
- 8.05×
- Total profit
- $306,174
- Equity at exit
- $13,402
Cash invested: $43,400 (down + closing). Projections, not guarantees.
Landlord ↔ Tenant lean methodology
- Overall (STATE)
- 18 Strongly Tenant-Friendly
- State California
- 18 Strongly Tenant-Friendly · D+13
- County
- — inherits STATE
- City
- — inherits STATE
ZIP-level market 91748
- Rents YoY
- 10.3%
- Active inventory
- 102
- Price-to-rent
- 3.9×
Monthly cashflow live
- Estimated rent
- $3,302 high interval (Pro) →
- Mortgage (P&I)
- −$813
- Tax from tax record
- −$32 /mo · $383/yr
- Insurance
- −$65
- HOA
- −$0
- Vacancy / Maint / Mgmt
- −$694
- Net cashflow
- $1,700
Break-even live
UW: 25.0% down · 7.5% · 30yr · 1.5% tax · 5.0% vac · 8.0% maint · 8.0% mgmt
Financing live
Cash to close
- Down payment
- $38,750
- Closing costs
- $4,650
- Reserves months
- —
- Total cash needed
- —
Loan-product check · same deal, 3 products live
Conventional
25% down · 7.5% · 30yr
- Down + closing
- —
- Monthly P&I
- —
- Monthly cashflow
- —
- DSCR
- —
- Eligible?
- —
Personal DTI + credit; lowest rate.
DSCR
20% down · 8.5% · 30yr
- Down + closing
- —
- Monthly P&I
- —
- Monthly cashflow
- —
- DSCR
- —
- Eligible?
- —
No personal income docs; deal must DSCR.
Hard money
10% down · 12.0% · 12mo
- Down + closing
- —
- Monthly P&I
- —
- Monthly cashflow
- —
- DSCR
- —
- Eligible?
- —
Short-term bridge; refi at stabilization.
Rent comps 26 comps
| Address | Beds | Baths | Sqft | Rent | $/sqft | DOM | Units | Dist |
|---|---|---|---|---|---|---|---|---|
| 18600 Colima Rd Rowland Heights, CA | 1.0–2.0 | 1.0 | 657 | $2,335 | $3.55 | 1d | 17 | 0.29mi |
| 18567 Colima Rd Rowland Heights, CA | 1.0–2.0 | 1.0–2.0 | 845 | $2,400 | $2.84 | 3d | 26 | 0.29mi |
| 18617 Trot Ave Rowland Heights, CA | 3.0 | 2.0 | 1251 | $3,350 | $2.68 | 17d | 1 | 0.33mi |
| 1809 Paso Real Ave Rowland Heights, CA | 4.0 | 2.0 | 1259 | $3,500 | $2.78 | 24d | 1 | 0.33mi |
| 1808 Santa Ysabela Dr Rowland Heights, CA | 4.0 | 2.0 | 1175 | $3,500 | $2.98 | 20d | 1 | 0.41mi |
| 1439 S Jellick Ave Unit B Rowland Heights, CA | 2.0 | 1.5 | 1049 | $2,300 | $2.19 | 4d | 1 | 0.42mi |
| 19050 Colima Rd Rowland Heights, CA | 1.0–2.0 | 1.0–2.0 | 833 | $2,595 | $3.12 | 22d | 2 | 0.45mi |
| 1316 Raleo Ave Rowland Heights, CA | 4.0 | 2.0 | 1200 | $5,000 | $4.17 | 15d | 1 | 0.52mi |
| 18417 Santar St Rowland Heights, CA | 4.0 | 2.0 | 1142 | $3,300 | $2.89 | 16d | 1 | 0.52mi |
| 19231 Tranbarger St Rowland Heights, CA | 3.0 | 2.0 | 1170 | $3,200 | $2.74 | 43d | 1 | 0.62mi |
| 18573 Farjardo St Rowland Heights, CA | 3.0 | 2.0 | 1300 | $3,750 | $2.88 | 43d | 1 | 0.74mi |
| 18658 Mescalero St Rowland Heights, CA | 3.0 | 2.0 | 1352 | $3,800 | $2.81 | 22d | 1 | 0.78mi |
| 18247 Via Calma #3 Rowland Heights, CA | 2.0 | 1.0 | 836 | $1,995 | $2.39 | 7d | 1 | 0.80mi |
| 19319 Pilario St Rowland Heights, CA | 4.0 | 2.0 | 1480 | $3,750 | $2.53 | 43d | 1 | 0.80mi |
| 1940 Fullerton Rd Rowland Heights, CA | 1.0–2.0 | 1.0 | 775 | $2,265 | $2.92 | 43d | 1 | 0.82mi |
| 2240 Electra Ave Rowland Heights, CA | 3.0 | 2.0 | 1256 | $3,200 | $2.55 | 17d | 1 | 0.99mi |
| 2415 Los Padres Dr Rowland Heights, CA | 3.0 | 2.0 | 1120 | $3,300 | $2.95 | 16d | 1 | 1.00mi |
| 2601 E Valley Blvd West Covina, CA | 1.0–2.0 | 1.0–2.0 | 925 | $2,650 | $2.86 | 7d | 3 | 1.00mi |
| 2243 Otterbein Ave Rowland Heights, CA | 3.0 | 2.0 | 1286 | $3,600 | $2.80 | 43d | 1 | 1.01mi |
| 18626 Barroso St Rowland Heights, CA | 3.0 | 2.0 | 1446 | $3,890 | $2.69 | 2d | 1 | 1.04mi |
| 2817 E Valley Blvd West Covina, CA | 3.0 | 2.0 | 1050 | $3,100 | $2.95 | 43d | 1 | 1.08mi |
| 2847 Valley Blvd West Covina, CA | 1.0–2.0 | 1.0 | 879 | $3,040 | $3.46 | 2d | 7 | 1.09mi |
| Searls Dr Unit A Rowland Heights, CA | 2.0 | 1.0 | 750 | $2,600 | $3.47 | 43d | 1 | 1.09mi |
| 18448 La Guardia St Rowland Heights, CA | 4.0 | 2.0 | 1386 | $6,900 | $4.98 | 1d | 1 | 1.15mi |
| 2143 Arcdale Ave Rowland Heights, CA | 3.0 | 2.0 | 1386 | $3,500 | $2.53 | 24d | 1 | 1.20mi |
| 17800 Colima Rd Rowland Heights, CA | 1.0–2.0 | 1.0–2.0 | 775 | $2,880 | $3.72 | 5d | 8 | 1.34mi |
Listing history 50 events
-
2026-06-18days on market $155,000 Active 60 DOM
-
2026-06-17days on market $155,000 Active 59 DOM
-
2026-06-16days on market $155,000 Active 58 DOM
-
2026-06-15days on market $155,000 Active 57 DOM
-
2026-06-13days on market $155,000 Active 55 DOM
-
2026-06-13days on market $155,000 Active 54 DOM
-
2026-06-09days on market $155,000 Active 51 DOM
-
2026-06-08days on market $155,000 Active 50 DOM
-
2026-06-07days on market $155,000 Active 49 DOM
-
2026-06-04pricedays on market $155,000 Active 46 DOM
-
2026-06-03days on market $159,000 Active 45 DOM
-
2026-06-02days on market $159,000 Active 44 DOM
-
2026-06-01days on market $159,000 Active 43 DOM
-
2026-05-31days on market $159,000 Active 42 DOM
-
2026-04-19$159,000 Active 858-char remark
Show marketing remark (858 chars)
Spacious manufactured home located at the front entrance of a well-maintained community in the heart of Rowland Heights. This 2-bedroom home features a bonus room currently used as a third bedroom (unpermitted; buyer to verify). The home offers a generously sized primary bedroom, a bright and open living room, and an open-concept kitchen with a formal dining area. Additional highlights include an open laundry area and a three-car carport for ample parking. Step onto a large front porch—perfect for relaxing or entertaining. Community amenities include a heated pool, spa, clubhouse, conference room, and playground. Conveniently located within walking distance to markets, schools, bus lines, the post office, and shopping centers, with easy access to the 60 and 57 freeways. Situated in a quiet, family-friendly park in desirable Rowland Heights.
-
2026-04-16historical $159,000 858-char remark
Show marketing remark (858 chars)
Spacious manufactured home located at the front entrance of a well-maintained community in the heart of Rowland Heights. This 2-bedroom home features a bonus room currently used as a third bedroom (unpermitted; buyer to verify). The home offers a generously sized primary bedroom, a bright and open living room, and an open-concept kitchen with a formal dining area. Additional highlights include an open laundry area and a three-car carport for ample parking. Step onto a large front porch—perfect for relaxing or entertaining. Community amenities include a heated pool, spa, clubhouse, conference room, and playground. Conveniently located within walking distance to markets, schools, bus lines, the post office, and shopping centers, with easy access to the 60 and 57 freeways. Situated in a quiet, family-friendly park in desirable Rowland Heights.
-
2025-10-29historical
-
2025-06-25price $175,000
-
2025-05-24$199,999 Active
-
2025-04-08status Active
-
2025-04-08historical
-
2025-03-23historical
-
2025-03-22status Active
-
2025-03-04status Active
-
2025-02-17status Active
-
2025-01-28$159,000 Active
-
2025-01-09$159,000 Active
-
2023-07-14soldstatus $140,000 Closed Sale
-
2023-07-09status Pending Sale
-
2023-07-04historical Active Under Contract
-
2023-06-20status Active
-
2023-06-16historical Active Under Contract
-
2023-06-02price $159,800
-
2023-05-30$168,800 Active
-
2023-05-29price $168,800
-
2023-05-29historical $159,990
-
2010-12-01historical
-
2010-11-16$36,000 Active
-
2010-10-19historical
-
2010-09-14price $39,990
-
2010-08-28price $43,000
-
2010-08-05status Active
-
2010-07-31price $46,000
-
2010-07-28price $48,000
-
2010-07-25status Pending
-
2010-07-14price $46,000
-
2010-06-27price $49,900
-
2010-05-27$58,000 Active
-
2009-11-01price $117,000 Expired
-
2007-11-01historical
ⓘ Source: listings_history table (triggers on properties + properties_extension) + one-shot
backfill from property_details.listing_events for pre-trigger history.
Tax reassessment forecast CA · Resets to sale price
- Current annual tax
- $383 · $32/mo
- Projected year-2 tax
- $1,178 · $98/mo
- Expected delta
- +$795/yr (+$66/mo · 207.8%)
ⓘ Screening estimate from a state-policy table — verify with the county assessor before closing.
Climate risk First Street
- Flood 1/10 Low FEMA zone X (unshaded) · 0% chance over 30 yrs
- Wildfire 1/10 Low
- Heat 6/10 Major 7 d/yr ≥99°F today · 21 d/yr by 30 yrs out
- Wind 1/10 Low
- Air quality 7/10 Severe 13 unhealthy d/yr today · 14 by 30 yrs out
Nearby sold comps map
Loading sold comps map…
Walkable amenities ~0.75 mi
Loading nearby amenities…
Taxation est. · year 1
- Rental income
- $39,630
- − Mortgage interest
- −$8,682
- − Property taxes
- −$383
- − Insurance
- −$775
- − Repairs & maintenance
- −$3,170
- − Management
- −$3,170
- − Depreciation
- −$4,509
- Taxable income
- $18,940
- Est. tax owed @ 24.0%
- −$4,546
- After-tax cash flow
- $15,850/yr
For passive investors: Depreciation is non-cash, so a rental often shows a tax loss while cash-flowing — sheltering income. Rental losses are passive: they offset passive income freely, and up to $25,000/yr can offset ordinary (W-2) income if you actively participate and your MAGI is under $100k (phasing out to $0 by $150k); unused losses carry forward. On sale, claimed depreciation is recaptured at up to 25%, and gains may owe capital-gains tax (a 1031 exchange can defer both). Figures are a year-1 estimate at your 24.0% rate — not tax advice; consult a CPA.
Schools (NCES district)
- District
- Rowland Unified
- NCES district ID
- 0633750
- Math proficiency
- 40% ▼ -1.00%
- Reading proficiency
- 62% ▲ 11.00%
- Median HH income
- $63,667
- Composite
- 44.83/100
- National rank
- #2733
- State rank
- #134 of 517 in CA
Livability — Rowland Heights
- Score
- 50/100
- State rank
- #1123
- US rank
- #25637
Category grades
Schools grade is shown separately in the Schools card above.
Census & demographics
- Census place
- Rowland Heights, CA
- County
- Los Angeles County · 9,444,647 people
- City population
- 42,463
- Metro
- Los Angeles-Long Beach-Anaheim, CA
- Population (ZIP)
- 42,463
- Household income
- $83,428
- Rent vs Own
- Severe rent burden
- 1440.0
Population outlook (Los Angeles County) Hauer SSP2
- Today (2025)
- 10,940,515 people
- By 2030
- 11,256,481 · +2.9%
- By 2040
- 11,729,929 · +7.2%
- By 2050
- 11,948,407 · +9.2%
- By 2075
- 11,818,114 · +8.0%
- By 2100
- 10,842,928 · -0.9%
Race, ethnicity, and origin ACS 2023
- Neighborhood character
- Majority Asian (59%)
- Race & ethnicity
- Asian 59% Hispanic / Latino 31% Two or more races 6% White 6% Black 1%
- Hispanic origin (detail)
- Mexican 25%
- Foreign-born
- 55% · China, Canada, South Korea
- Languages at home
- 25% English-only · Chinese 37% Spanish 22% Tagalog/Filipino 5%
Political lean MEDSL · Los Angeles
- 2024 margin
- Solid D (+32.9) · D 64.8% · R 31.9% · Other 3.3%
- 2008→2024 swing
- -7.4pp toward R · 2008: 40.4pp · 2024: 32.9pp
- All cycles
- 2024: D+32.9 2020: D+44.2 2016: D+48.0 2012: D+40.0 2008: D+40.4
Not yet ingested
- Civics
- —
Market trends
- HPI YoY
- ▼ -754.24%
- Current HPI
- 364.5923
- Rent YoY
- ▲ 10.27%
- Metro
- Los Angeles-Long Beach-Anaheim, CA
- State GDP YoY
- ▲ 3.21%
- F500 in state
- 116
Industry mix (Fortune 500 HQ in CA)
| Industry | F500 HQs | Revenue |
|---|---|---|
| Technology | 27 | $1,492B |
|
||
| Financial Services | 3 | $174B |
|
||
| Retail | 3 | $44B |
|
||
| Insurance | 3 | $26B |
|
||
| Media / Entertainment | 2 | $115B |
|
||
| Pharmaceuticals / Biotech | 2 | $62B |
|
||
Price history
+307.7% since first listed46 events — show timeline
- 2026-04-19 Listed $159,000 CRMLS
- 2026-04-16 Coming Soon $159,000 CRMLS
- 2025-10-29 Listing Removed — CRMLS
- 2025-06-25 Price Changed $175,000 CRMLS
- 2025-05-24 Listed $199,999 CRMLS
- 2025-04-08 Relisted — CRMLS
- 2025-04-08 Listing Removed — CRMLS
- 2025-03-23 Listing Removed — CRMLS
- 2025-03-22 Relisted — CRMLS
- 2025-03-04 Relisted — CRMLS
- 2025-02-17 Relisted — CRMLS
- 2025-01-28 Listed $159,000 CRMLS
- 2025-01-09 Listed $159,000 CRMLS
- 2023-07-14 Sold (MLS) $140,000 CRMLS
- 2023-07-09 Pending — CRMLS
- 2023-07-04 Contingent — CRMLS
- 2023-06-20 Relisted — CRMLS
- 2023-06-16 Contingent — CRMLS
- 2023-06-02 Price Changed $159,800 CRMLS
- 2023-05-30 Listed $168,800 CRMLS
- 2023-05-29 Price Changed $168,800 CRMLS
- 2023-05-29 Coming Soon $159,990 CRMLS
- 2010-12-01 Listing Removed — CRMLS
- 2010-11-16 Listed $36,000 CRMLS
- 2010-10-19 Listing Removed — CRMLS
- 2010-09-14 Price Changed $39,990 CRMLS
- 2010-08-28 Price Changed $43,000 CRMLS
- 2010-08-05 Relisted — CRMLS
- 2010-07-31 Price Changed $46,000 CRMLS
- 2010-07-28 Price Changed $48,000 CRMLS
- 2010-07-25 Pending — CRMLS
- 2010-07-14 Price Changed $46,000 CRMLS
- 2010-06-27 Price Changed $49,900 CRMLS
- 2010-05-27 Listed $58,000 CRMLS
- 2009-11-01 Price Changed $117,000 CRMLS
- 2007-11-01 Listing Removed — CRMLS
- 2007-10-16 Price Changed $119,000 CRMLS
- 2007-09-17 Price Changed $121,000 CRMLS
- 2007-09-11 Price Changed $119,000 CRMLS
- 2007-08-15 Price Changed $121,000 CRMLS
- 2007-06-20 Price Changed $119,000 CRMLS
- 2007-05-18 Listed $125,000 CRMLS
- 2006-12-11 Listing Removed — CRMLS
- 2006-08-10 Listed $119,500 CRMLS
- 2003-09-01 Listing Removed — CRMLS
- 2003-05-30 Listed $39,000 CRMLS
Property tax history
+6.3%/yrLatest (2025): $383 · +6.3% YoY. Source: county tax records.
Cash-flow waterfall
monthlySold comps — $/sqft
last 12 mo · ≤1 miLoading sold comps…