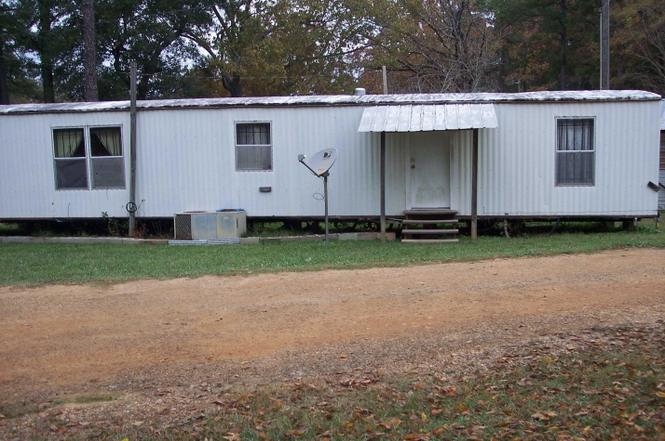
105 Lafayette 2471 · Bradley, AR
Flood risk 5/10 · Moderate
- FEMA flood zone
- —
- Chance of flooding over 30 yrs
- 0.65%
- Est. flood insurance / yr
- —
Fire risk 3/10 · Minor
- Est. fire insurance / yr
- $1,499 – $2,785
Heat risk 6/10 · Moderate
- Hot days now (above 111°F)
- 7 days/yr
- Hot days in 30 yrs
- 22 days/yr
Wind risk 6/10 · Moderate
- Chance of severe wind over 30 yrs
- 27.0%
Air-quality risk 1/10 · Minimal
- Unhealthy air days now
- 0 days/yr
- Unhealthy air days in 30 yrs
- 0 days/yr
Risk factors via First Street. Map © Google.
Why this score? — see what drove the C- grade
The composite is a weighted blend of 9 inputs, each scored 0–100. Each bar is that input's sub-score; the figure is the points it added to the 100-point composite (weight × sub-score).
- Cash flow +15.0/30.0
- ARV discount +7.5/15.0
- Appreciation +5.1/10.0
- 1% rule +5.0/10.0
- DSCR +5.0/10.0
- Schools +5.0/10.0
- Livability +3.0/5.0
- Rent growth +2.5/5.0
- Condition / age +2.5/5.0
$24,000
🖨 Deal sheet 📄 Offer letter ✓ Due diligence
Listing remarks
This is leased land. Buyer would need to be approved by the land owner.
Key facts
- Built 2000
- Listed 120 days
Neighborhood map
What this means for you Summary
Snapshot
- This is a 2-bed/1.5-bath manufactured listed at $24k.
Deal economics
- At list price, monthly cash flow is $859 ($10k/yr) — positive.
- The deal already cash-flows at list — no discount required.
- Meets the 1% rule at list price ($1k rent vs $24k).
- Recommended offer: $22k (9.0% below list) — sets the bar for market timing.
Location & tenants
- Location reads 59/100 on livability (#294 in AR) — a working-class tenant base; expect higher turnover. Strengths: cost of living A+, housing A+, health & safety A+; Watch: schools D-, crime F, amenities F.
Forward outlook
- In year one you build about $211 of equity ($166 loan paydown + $45 appreciation (0.2% local appreciation)).
- Lafayette County population projected at -40% by 2050 — secular population decline; favor cash flow + early exit over multi-decade hold.
- At projected returns (0.2% appreciation + 3.0% rent growth), your $7k cash investment doubles in ~1 year — after that, you're playing with house money.
Negotiation context
- It's been on market 120 days — a 9% lower offer ($22k) is reasonable based on typical stale-listing flexibility.
Risks & watch-outs
- Climate carrying-cost: moderate flood risk; major wind risk, 27% chance of damaging wind over 30y; extreme-heat days projected 7→22/yr by 2055 (HVAC capex compounding) — expect insurance premiums to compound above CPI over the hold.
Questions for the listing agent
- It's been on market 120 days. Have you received any prior offers? Is the seller open to a 9% concession, seller financing, or rate buy-down credit?
- Why hasn't it sold? Are there any deal-killer items the seller is aware of (foundation, flood, title, zoning, code violations)?
- Is there a deadline driving the sale (1031 exchange, divorce, estate, relocation)? That informs how much negotiation room exists.
- Schools are D-rated, which usually means shorter tenancies and higher turnover. Who's the typical renter profile here, and what's been the actual vacancy rate?
- Crime grade is F in this area — have there been break-ins, vandalism, or insurance claims at this property in the last 3 years? What carrier currently insures it and at what premium?
- What's the average days-on-market for RENTAL listings here right now (not sales)? A rising rental-DOM trend means longer vacancies and softer asking-rent achievability than the comps imply.
- What's the recent tenant-quality profile in this submarket — average credit score on applications, eviction rate, late-payment / NSF rate, and stable-employment percentage? A property-management company in the area should have these aggregated.
- How much new for-sale + rental construction is in the pipeline within 1–3 miles? Heavy new supply typically softens prices + rents 12–24 months out; constrained supply supports both.
Investment metrics
- 1% rule
- 5.40% ✓
- Cap rate
- 49.24%
- Cash-on-cash
- 153.37%
- DSCR
- 7.82
- GRM
- 1.5
CMA / ARV
No comps found within radius.
Projected returns pro-forma
0.19% appreciation · 3.0% rent growth · sell at horizon
- IRR
- —
- Equity multiple
- 9.07×
- Total profit
- $54,233
- Equity at exit
- $7,196
- IRR
- —
- Equity multiple
- 19.03×
- Total profit
- $121,134
- Equity at exit
- $8,833
Cash invested: $6,720 (down + closing). Projections, not guarantees.
Landlord ↔ Tenant lean methodology
- Overall (STATE)
- 92 Strongly Landlord-Friendly
- State Arkansas
- 92 Strongly Landlord-Friendly · R+14
- County
- — inherits STATE
- City
- — inherits STATE
ZIP-level market 71861
- Home prices YoY
- 0.1%
- Price-to-rent
- 1.5×
Monthly cashflow live
- Estimated rent
- $1,297 medium interval (Pro) →
- Mortgage (P&I)
- −$126
- Tax est. 1.5%
- −$30 /mo · $360/yr
- Insurance
- −$10
- HOA
- −$0
- Vacancy / Maint / Mgmt
- −$272
- Net cashflow
- $859
Break-even live
UW: 25.0% down · 7.5% · 30yr · 1.5% tax · 5.0% vac · 8.0% maint · 8.0% mgmt
Financing live
Cash to close
- Down payment
- $6,000
- Closing costs
- $720
- Reserves months
- —
- Total cash needed
- —
Loan-product check · same deal, 3 products live
Conventional
25% down · 7.5% · 30yr
- Down + closing
- —
- Monthly P&I
- —
- Monthly cashflow
- —
- DSCR
- —
- Eligible?
- —
Personal DTI + credit; lowest rate.
DSCR
20% down · 8.5% · 30yr
- Down + closing
- —
- Monthly P&I
- —
- Monthly cashflow
- —
- DSCR
- —
- Eligible?
- —
No personal income docs; deal must DSCR.
Hard money
10% down · 12.0% · 12mo
- Down + closing
- —
- Monthly P&I
- —
- Monthly cashflow
- —
- DSCR
- —
- Eligible?
- —
Short-term bridge; refi at stabilization.
Listing history 2 events
-
2024-03-22status Under Contract
-
2023-11-17$24,000 New Listing
ⓘ Source: listings_history table (triggers on properties + properties_extension) + one-shot
backfill from property_details.listing_events for pre-trigger history.
Climate risk First Street
- Flood 5/10 Major 65% chance over 30 yrs
- Wildfire 3/10 Moderate
- Heat 6/10 Major 7 d/yr ≥111°F today · 22 d/yr by 30 yrs out
- Wind 6/10 Major 27% chance of damaging wind over 30 yrs
- Air quality 1/10 Low 0 unhealthy d/yr today · 0 by 30 yrs out
Nearby sold comps map
Loading sold comps map…
Walkable amenities ~0.75 mi
Loading nearby amenities…
Taxation est. · year 1
- Rental income
- $15,566
- − Mortgage interest
- −$1,344
- − Property taxes
- −$360
- − Insurance
- −$120
- − Repairs & maintenance
- −$1,245
- − Management
- −$1,245
- − Depreciation
- −$698
- Taxable income
- $10,553
- Est. tax owed @ 24.0%
- −$2,533
- After-tax cash flow
- $7,774/yr
For passive investors: Depreciation is non-cash, so a rental often shows a tax loss while cash-flowing — sheltering income. Rental losses are passive: they offset passive income freely, and up to $25,000/yr can offset ordinary (W-2) income if you actively participate and your MAGI is under $100k (phasing out to $0 by $150k); unused losses carry forward. On sale, claimed depreciation is recaptured at up to 25%, and gains may owe capital-gains tax (a 1031 exchange can defer both). Figures are a year-1 estimate at your 24.0% rate — not tax advice; consult a CPA.
Schools (NCES district)
No district data.
Livability — Bradley
- Score
- 59/100
- State rank
- #294
- US rank
- #20275
Category grades
Schools grade is shown separately in the Schools card above.
Census & demographics
- Population (ZIP)
- 2,330
Population outlook (Lafayette County) Hauer SSP2
- Today (2025)
- 5,990 people
- By 2030
- 5,452 · -9.0%
- By 2040
- 4,482 · -25.2%
- By 2050
- 3,625 · -39.5%
- By 2075
- 2,352 · -60.7%
- By 2100
- 1,830 · -69.4%
Race, ethnicity, and origin ACS 2023
- Neighborhood character
- Predominantly White (85%)
- Race & ethnicity
- White 85% Black 12% Two or more races 3%
- Common ancestry
- Slovak 5% Italian 4% Serbian 3%
- Foreign-born
- 1% · Canada
- Languages at home
- 99% English-only · German/W. Germanic 1%
Political lean MEDSL · Lafayette
- 2024 margin
- Solid R (+38.3) · D 30.0% · R 68.3% · Other 1.6%
- 2008→2024 swing
- -19.3pp toward R · 2008: -19.0pp · 2024: -38.3pp
- All cycles
- 2024: R+38.3 2020: R+34.3 2016: R+25.5 2012: R+18.4 2008: R+19.0
Not yet ingested
- Civics
- —
Market trends
- HPI YoY
- ▲ 0.19%
- Current HPI
- 261.3192
- Rent YoY
- —
- Metro
- —
- State GDP YoY
- ▲ 3.80%
- F500 in state
- 10
Industry mix (Fortune 500 HQ in AR)
| Industry | F500 HQs | Revenue |
|---|---|---|
| Retail | 1 | $681B |
|
||
| Food / Agriculture | 1 | $53B |
|
||
| Retail / Energy | 1 | $22B |
|
||
| Transportation / Logistics | 1 | $12B |
|
||
| Energy | 1 | $4B |
|
||
Price history
2 events — show timeline
- 2024-03-22 Pending — CARMLS
- 2023-11-17 Listed $24,000 CARMLS
Cash-flow waterfall
monthlySold comps — $/sqft
last 12 mo · ≤1 miLoading sold comps…