 Multi-family
213 Boyles Ave · New Castle, PA
Flood risk 7/10 · Major
- FEMA flood zone
- X (unshaded)
- Chance of flooding over 30 yrs
- 0.76%
- Est. flood insurance / yr
- $507 – $1,088
Fire risk 1/10 · Minimal
- Est. fire insurance / yr
- $511 – $949
Heat risk 3/10 · Minor
- Hot days now (above 96°F)
- 7 days/yr
- Hot days in 30 yrs
- 18 days/yr
Wind risk 1/10 · Minimal
- Chance of severe wind over 30 yrs
- —
Air-quality risk 2/10 · Minimal
- Unhealthy air days now
- 1 days/yr
- Unhealthy air days in 30 yrs
- 3 days/yr
Risk factors via First Street. Map © Google.
Why this score? — see what drove the B grade
The composite is a weighted blend of 9 inputs, each scored 0–100. Each bar is that input's sub-score; the figure is the points it added to the 100-point composite (weight × sub-score).
- Cash flow +30.0/30.0
- 1% rule +10.0/10.0
- DSCR +10.0/10.0
- ARV discount +7.5/15.0
- Rent growth +5.0/5.0
- Livability +4.1/5.0
- Condition / age +4.0/5.0
- Schools +1.1/10.0
- Appreciation +0.0/10.0
$175,000
🖨 Deal sheet (PDF) 📄 Offer letter ✓ Due diligence
Multi-family units
County records classify this as Multi-Family (2-4 Unit). Listing-text estimate: 1 unit. estimate disagrees with records
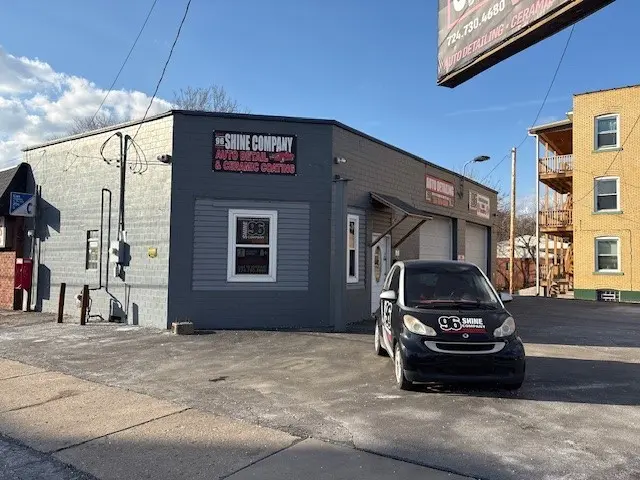
Listing remarks MLS
Front building has two bays with a 14,000 lb drive on lift. Office area. Rear building has two apartments. Newer roof.
Key facts
- Drive on lift
- Newer roof
- Office area
Tags
Neighborhood map
What this means for you Summary
Snapshot
- This is a 3-bed/3.0-bath multifamily listed at $175k. Condition is rated good.
Deal economics
- At list price, monthly cash flow is $1k ($13k/yr) — positive.
- The deal already cash-flows at list — no discount required.
- Meets the 1% rule at list price ($3k rent vs $175k).
- Recommended offer: $159k (9.0% below list) — sets the bar for market timing.
- Cap rate 14.4% vs local median 10.1% in New Castle — top-decile yield for the area; either an underpriced asset or a hidden risk that comps aren't pricing in. Stress-test before assuming the spread holds.
Location & tenants
- Location reads 82/100 on livability (#137 in PA, #1,120 nationally) — a professional / high-income tenant draw. Strengths: crime A+, commute A+, cost of living A+; Watch: amenities F, employment F.
- New Castle Area SD (town): math 9% / reading 19% proficiency, ranked #519 of 539 in PA (top 96%) — low school quality limits family demand, transient renter base, plan for 1-2y turnover; 66% free/reduced lunch — lower-income household profile, screen leases tightly.
- Zoned schools: Harry W Lockley Early Learning Center (775 students, 100% FRL); New Castle Jhs (math 6% / reading 21%, grade F, #482 of 512 statewide, top 94%, 706 students, 100% FRL); New Castle Shs (math 47% / reading 30%, grade F, #280 of 437 statewide, top 64%, 771 students, 100% FRL) — zoned schools average 100% FRL vs 66% district-wide (33 pts higher); higher-poverty schools than district average — tighter screening recommended.
- Zoned-school proficiency averages 26% at this address vs 14% district-wide (+12 pts) — the actual schools serving this property are materially stronger than the New Castle Area SD average implies; a family-tenant draw the district grade alone would hide.
- Market conditions: Rents rising fast (+20.1%/yr); 121 active listings in the ZIP; 9 comparable units currently listed for rent nearby; rentals lingering (median 46d on market — plan ~5-8 weeks vacancy on turnover, expect pricing pressure); 100% of comp listings sitting > 30 days — soft ceiling on asking rent; 51 units permitted in Lawrence County in 2024 (0 in 5+ unit buildings).
- At $3,024/mo this rent would consume 71% of the median local household income ($51k/yr) (locally 1047% of renters already pay >50% of income on rent) — very limited rent-growth headroom before tenants either downsize or default.
Forward outlook
- Local home prices are declining (-3.0%/yr); year-one equity from $1k of loan paydown is wiped out by about $5k of value loss. Plan a longer hold.
- Lawrence County population projected at -25% by 2050 — secular population decline; favor cash flow + early exit over multi-decade hold.
- At projected returns (-3.0% appreciation + 8.0% rent growth), your $49k cash investment doubles in ~4 years — after that, you're playing with house money.
Negotiation context
- It's been on market 115 days — a 9% lower offer ($159k) is reasonable based on typical stale-listing flexibility.
Risks & watch-outs
- Watch-outs: flood insurance adds $66/mo.
- Climate carrying-cost: major flood risk — expect insurance premiums to compound above CPI over the hold.
Questions for the listing agent
- It's been on market 115 days. Have you received any prior offers? Is the seller open to a 9% concession, seller financing, or rate buy-down credit?
- Built in 1974 — when were the roof, HVAC, electrical panel, plumbing, and water heater last replaced?
- What's the actual annual flood-insurance premium (NFIP or private), and is the property in a SFHA with mandatory coverage?
- Why hasn't it sold? Are there any deal-killer items the seller is aware of (foundation, flood, title, zoning, code violations)?
- Is there a deadline driving the sale (1031 exchange, divorce, estate, relocation)? That informs how much negotiation room exists.
- What's the average days-on-market for RENTAL listings here right now (not sales)? A rising rental-DOM trend means longer vacancies and softer asking-rent achievability than the comps imply.
- What's the recent tenant-quality profile in this submarket — average credit score on applications, eviction rate, late-payment / NSF rate, and stable-employment percentage? A property-management company in the area should have these aggregated.
- How much new apartment / multifamily construction is in the pipeline within 1–3 miles? Heavy new supply (>2% of stock underway) typically softens rents 12–24 months out; light construction supports rent growth.
Investment metrics
- 1% rule
- 1.73% ✓
- Cap rate
- 14.38%
- Cash-on-cash
- 28.89%
- DSCR
- 2.29
- GRM
- 4.8
CMA / ARV
- ARV (median comp)
- $32,579
- List price
- $175,000
- Delta
- 437.16%
- Verdict
- OVERPRICED
- Comps
- 1 within 2.0 mi
Show comp detail 11 sales within ~0.75 mi
| Address | Dist | Beds/Ba | Sqft | Sold | Price | $/sf | Match |
|---|---|---|---|---|---|---|---|
| 306 E Wallace Ave | 0.14mi | 4/2.0 (+1) | — | 10mo | $70,000 | — | 64 |
| 335 Laurel Blvd | 0.20mi | 4/2.0 (+1) | — | 10mo | $65,000 | — | 61 |
| 717 N Mercer St | 0.28mi | 4/3.0 (+1) | — | 12mo | $115,000 | — | 59 |
| 143 & 143.5 E Winter Ave | 0.31mi | 4/2.0 (+1) | — | 8mo | $100,000 | — | 58 |
| 711 Carlisle St | 0.12mi | 4/2.0 (+1) | — | 19mo | $48,200 | — | 58 |
| 347 Shaw St | 0.35mi | 4/2.0 (+1) | — | 8mo | $50,000 | — | 55 |
| 3 E Leasure | 0.47mi | 2/2.0 (-1) | — | 3mo | $69,900 | — | 54 |
| 1009 Highland Ave | 0.29mi | 4/2.0 (+1) | — | 20mo | $71,000 | — | 48 |
| 332 Shaw St | 0.37mi | 4/2.0 (+1) | — | 18mo | $40,000 | — | 47 |
| 1105-1105.5.5 S Mercer St | 0.59mi | 2/3.0 (-1) | — | 24mo | $79,900 | — | 35 |
| 504 Countyline St | 0.75mi | 4/4.0 (+1) | — | 11mo | $80,000 | — | 34 |
Match score weights: distance 35% · size 25% · config 20% · recency 20%. Top-matched comps best support the ARV.
Projected returns pro-forma
-3.0% appreciation · 8.0% rent growth · sell at horizon
- IRR
- 27.0%
- Equity multiple
- 2.20×
- Total profit
- $58,605
- Equity at exit
- $26,093
- IRR
- 37.5%
- Equity multiple
- 5.40×
- Total profit
- $215,409
- Equity at exit
- $15,131
Cash invested: $49,000 (down + closing). Projections, not guarantees.
Landlord ↔ Tenant lean methodology
- Overall (STATE)
- 62 Landlord-Friendly
- State Pennsylvania
- 62 Landlord-Friendly · EVEN
- County
- — inherits STATE
- City
- — inherits STATE
ZIP-level market 16101
- Home prices YoY
- -26.3%
- Rents YoY
- 20.1%
- Active inventory
- 121
- Price-to-rent
- 14.5×
Monthly cashflow live
- Estimated rent
- $3,024 high interval (Pro) →
- Mortgage (P&I)
- −$918
- Tax est. 1.5%
- −$219 /mo · $2,625/yr
- Insurance
- −$73
- Flood insurance flood zone
- −$66 /mo · $798/yr
- HOA
- −$0
- Lot rent
- −$0
- Vacancy / Maint / Mgmt
- −$635
- Net cashflow
- $1,113
Break-even live
Sensitivity live
| Price | -10% $1,234 | -5% $1,174 | +0% $1,113 | +5% $1,053 | +10% $992 |
|---|---|---|---|---|---|
| Rent | -10% $874 | -5% $994 | +0% $1,113 | +5% $1,233 | +10% $1,352 |
| Rate | -1.0pp $1,201 | -0.5pp $1,158 | base $1,113 | +0.5pp $1,068 | +1.0pp $1,022 |
3-unit breakdown (identical units grouped — click to expand)
| Units | Beds | Baths | Est. rent |
|---|---|---|---|
| 3× units | 2 | 1 | $3,024 |
| #1 | 2 | 1 | $1,008 |
| #2 | 2 | 1 | $1,008 |
| #3 | 2 | 1 | $1,008 |
| Total (3 units) | $3,024 | ||
UW: 25.0% down · 7.5% · 30yr · 1.5% tax · 5.0% vac · 8.0% maint · 8.0% mgmt
Financing live
Cash to close
- Down payment
- $43,750
- Closing costs
- $5,250
- Reserves months
- —
- Total cash needed
- —
Loan-product check · same deal, 3 products live
Conventional
25% down · 7.5% · 30yr
- Down + closing
- —
- Monthly P&I
- —
- Monthly cashflow
- —
- DSCR
- —
- Eligible?
- —
Personal DTI + credit; lowest rate.
DSCR
20% down · 8.5% · 30yr
- Down + closing
- —
- Monthly P&I
- —
- Monthly cashflow
- —
- DSCR
- —
- Eligible?
- —
No personal income docs; deal must DSCR.
Hard money
10% down · 12.0% · 12mo
- Down + closing
- —
- Monthly P&I
- —
- Monthly cashflow
- —
- DSCR
- —
- Eligible?
- —
Short-term bridge; refi at stabilization.
Rent comps 9 comps
| Address | Beds | Baths | Sqft | Rent | $/sqft | DOM | Units | Dist |
|---|---|---|---|---|---|---|---|---|
| 501 S Walnut St Apt 2 New Castle, PA | 2.0 | 1.0 | — | $725 | — | 46d | 1 | 0.79mi |
| 419 E Fairmont Ave New Castle, PA | 2.0 | 1.0 | — | $1,000 | — | 46d | 1 | 0.97mi |
| 219 1/2 Friendship St New Castle, PA | 3.0 | 1.0 | — | $1,100 | — | 46d | 1 | 1.15mi |
| 303 Phillips St New Castle, PA | 3.0 | 1.0 | — | $725 | — | 46d | 1 | 1.35mi |
| 325 E Englewood Ave Unit 2 New Castle, PA | 2.0 | 1.0 | — | $1,095 | — | 46d | 1 | 1.35mi |
| 932 Morton St New Castle, PA | 3.0 | 1.0 | 1440 | $1,375 | $0.95 | 46d | 1 | 1.37mi |
| 1119 Agnew St Unit 1119 New Castle, PA | 2.0 | 1.0 | — | $775 | — | 46d | 1 | 1.44mi |
| 1112 Williams St New Castle, PA | 2.0 | 1.0 | 1026 | $1,400 | $1.36 | 46d | 1 | 1.48mi |
| 1214 W Washington St Unit 1 New Castle, PA | 2.0 | 1.0 | — | $725 | — | 46d | 1 | 1.49mi |
Listing history 18 events
-
2026-06-22days on market $175,000 Active 115 DOM
-
2026-06-21days on market $175,000 Active 114 DOM
-
2026-06-19days on market $175,000 Active 112 DOM
-
2026-06-18days on market $175,000 Active 111 DOM
-
2026-06-17days on market $175,000 Active 110 DOM
-
2026-06-16days on market $175,000 Active 109 DOM
-
2026-06-15days on market $175,000 Active 108 DOM
-
2026-06-14days on market $175,000 Active 106 DOM
-
2026-06-12days on market $175,000 Active 105 DOM
-
2026-06-09days on market $175,000 Active 102 DOM
-
2026-06-08days on market $175,000 Active 101 DOM
-
2026-06-07days on market $175,000 Active 100 DOM
-
2026-06-03days on market $175,000 Active 96 DOM
-
2026-06-02days on market $175,000 Active 95 DOM
-
2026-06-01days on market $175,000 Active 94 DOM
-
2026-05-31days on market $175,000 Active 93 DOM
-
2026-05-30days on market $175,000 Active 92 DOM
-
2026-02-27$175,000 Active 118-char remark
Show marketing remark (118 chars)
Front building has two bays with a 14,000 lb drive on lift. Office area. Rear building has two apartments. Newer roof.
ⓘ Source: listings_history table (triggers on properties + properties_extension) + one-shot
backfill from property_details.listing_events for pre-trigger history.
Climate risk First Street
- Flood 7/10 Severe FEMA zone X (unshaded) · 76% chance over 30 yrs
- Wildfire 1/10 Low
- Heat 3/10 Moderate 7 d/yr ≥96°F today · 18 d/yr by 30 yrs out
- Wind 1/10 Low
- Air quality 2/10 Low 1 unhealthy d/yr today · 3 by 30 yrs out
Nearby sold comps map
Loading sold comps map…
Walkable amenities ~0.75 mi
Loading nearby amenities…
Taxation est. · year 1
- Rental income
- $36,288
- − Mortgage interest
- −$9,803
- − Property taxes
- −$2,625
- − Insurance
- −$1,672
- − Repairs & maintenance
- −$2,903
- − Management
- −$2,903
- − Depreciation
- −$5,091
- Taxable income
- $11,291
- Est. tax owed @ 24.0%
- −$2,710
- After-tax cash flow
- $10,648/yr
For passive investors: Depreciation is non-cash, so a rental often shows a tax loss while cash-flowing — sheltering income. Rental losses are passive: they offset passive income freely, and up to $25,000/yr can offset ordinary (W-2) income if you actively participate and your MAGI is under $100k (phasing out to $0 by $150k); unused losses carry forward. On sale, claimed depreciation is recaptured at up to 25%, and gains may owe capital-gains tax (a 1031 exchange can defer both). Figures are a year-1 estimate at your 24.0% rate — not tax advice; consult a CPA.
Condition & rehab AI · 4 photos
This property is in good condition with a cosmetic rehab level, featuring a clean exterior, newer roof, and well-maintained interior. Minor updates like painting and landscaping can significantly enhance its value.
Value-add opportunities
- Both Painting and minor cleaning — Enhances curb appeal and interior aesthetics.
- Both Landscaping improvements — Enhances curb appeal and adds value to the property.
Renovation cost estimate screening
Value-add ROI direction
- Both Painting and minor cleaning — Enhances curb appeal and interior aesthetics. ↑
- Both Landscaping improvements — Enhances curb appeal and adds value to the property. ↑
ⓘ Cost ranges are severity-bucket heuristics (US national rule-of-thumb). Get contractor quotes + a written scope before underwriting a rehab budget.
Schools (NCES district)
- District
- New Castle Area SD
- NCES district ID
- 4216620
- Math proficiency
- 9% ▼ -13.00%
- Reading proficiency
- 19% ▼ -23.00%
- Median HH income
- $30,967
- Composite
- 11.08/100
- National rank
- #9736
- State rank
- #519 of 539 in PA
Livability — New Castle
- Score
- 82/100
- State rank
- #137
- US rank
- #1120
Category grades
Schools grade is shown separately in the Schools card above.
Census & demographics
- Census place
- New Castle, PA
- County
- Lawrence County · 30,767 people
- City population
- 30,767
- Metro
- New Castle, PA
- Population (ZIP)
- 30,767
- Household income
- $51,128
- Rent vs Own
- Severe rent burden
- 1047.0
Population outlook (Lawrence County) Hauer SSP2
- Today (2025)
- 81,781 people
- By 2030
- 77,978 · -4.7%
- By 2040
- 69,522 · -15.0%
- By 2050
- 61,344 · -25.0%
- By 2075
- 45,027 · -44.9%
- By 2100
- 31,305 · -61.7%
Race, ethnicity, and origin ACS 2023
- Neighborhood character
- Predominantly White (82%)
- Race & ethnicity
- White 82% Two or more races 8% Black 7% Hispanic / Latino 3%
- Common ancestry
- Romanian 7% Serbian 3% Iranian 1%
- Foreign-born
- 2% · Canada
- Languages at home
- 96% English-only · Spanish 2% Other Indo-European 1%
Political lean MEDSL · Lawrence
- 2024 margin
- Solid R (+33.8) · D 32.8% · R 66.5%
- 2008→2024 swing
- -28.7pp toward R · 2008: -5.1pp · 2024: -33.8pp
- All cycles
- 2024: R+33.8 2020: R+29.6 2016: R+28.1 2012: R+9.0 2008: R+5.1
Not yet ingested
- Civics
- —
Market trends
- HPI YoY
- ▼ -56.77%
- Current HPI
- 159.3091
- Rent YoY
- ▲ 20.05%
- Metro
- New Castle, PA
- State GDP YoY
- ▲ 1.68%
- F500 in state
- 34
Industry mix (Fortune 500 HQ in PA)
| Industry | F500 HQs | Revenue |
|---|---|---|
| Healthcare | 2 | $309B |
|
||
| Insurance | 2 | $27B |
|
||
| Telecommunications / Media | 1 | $124B |
|
||
| Industrial Distribution | 1 | $22B |
|
||
| Financial Services | 1 | $20B |
|
||
| Chemicals / Materials | 1 | $18B |
|
||
Price history
1 event — show timeline
- 2026-02-27 Listed $175,000 West Penn MLS
Cash-flow waterfall
monthlySold comps — $/sqft
last 12 mo · ≤1 miLoading sold comps…