501 N 2nd St · Livingston, TX
Flood risk 1/10 · Minimal
- FEMA flood zone
- X (unshaded)
- Chance of flooding over 30 yrs
- 0.0%
- Est. flood insurance / yr
- $507 – $1,088
Fire risk 5/10 · Moderate
- Est. fire insurance / yr
- $1,222 – $2,270
Heat risk 8/10 · Major
- Hot days now (above 111°F)
- 7 days/yr
- Hot days in 30 yrs
- 24 days/yr
Wind risk 8/10 · Major
- Chance of severe wind over 30 yrs
- 98.0%
Air-quality risk 1/10 · Minimal
- Unhealthy air days now
- 0 days/yr
- Unhealthy air days in 30 yrs
- 0 days/yr
Risk factors via First Street. Map © Google.
Why this score? — see what drove the C+ grade
The composite is a weighted blend of 9 inputs, each scored 0–100. Each bar is that input's sub-score; the figure is the points it added to the 100-point composite (weight × sub-score).
- Cash flow +22.5/30.0
- ARV discount +15.0/15.0
- DSCR +7.2/10.0
- 1% rule +5.5/10.0
- Schools +3.2/10.0
- Livability +3.0/5.0
- Rent growth +2.5/5.0
- Condition / age +2.5/5.0
- Appreciation +0.0/10.0
$129,000
🖨 Deal sheet (PDF) 📄 Offer letter ✓ Due diligence
Listing remarks MLS
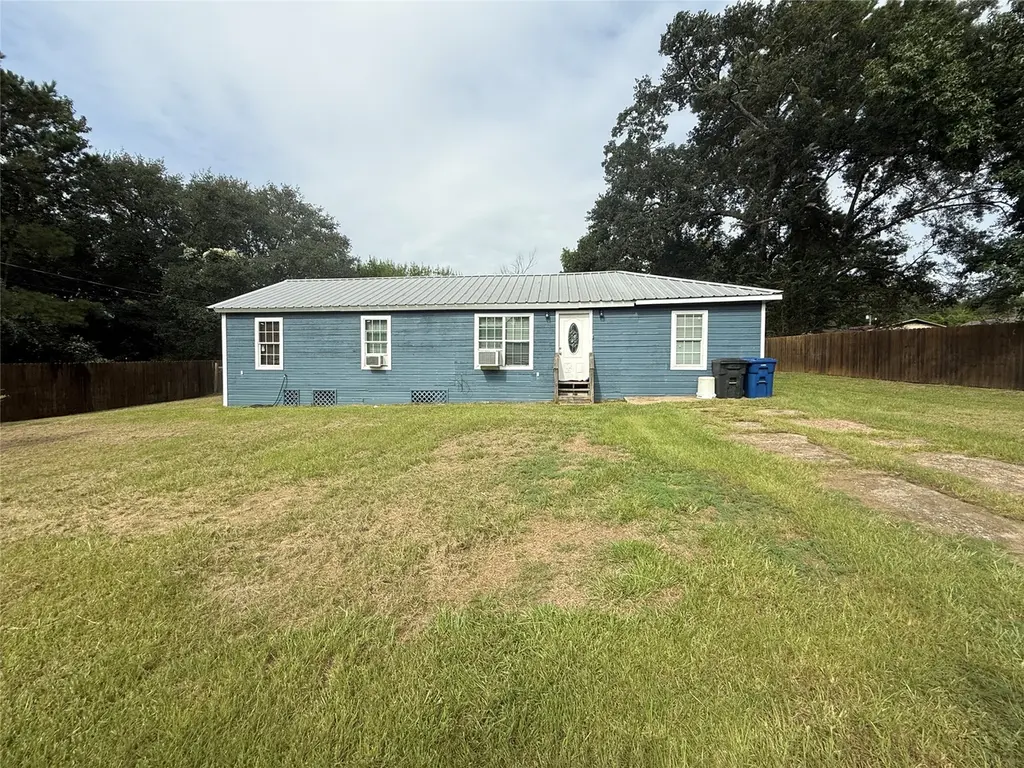
It's good to be HOME! Conveniently located in the heart of Livingston, TX. Offering a total of 4 bedrooms, this home has all the room you need! Enjoy the day in the privacy of your own backyard, completely fenced with a wrought iron gate. This one could be yours, schedule your showing today!
Key facts
- Wrought iron gate
- Completely fenced
- 0.26 acre lot
Tags
Neighborhood map
What this means for you Summary
Snapshot
- This is a 2-bed/1.0-bath single-family listed at $129k.
Deal economics
- At list price, monthly cash flow is $218 ($3k/yr) — positive.
- The deal already cash-flows at list — no discount required.
- Meets the 1% rule at list price ($1k rent vs $129k).
- Recommended offer: $114k (12.0% below list) — sets the bar for market timing.
- Cap rate 8.3% vs local median 2.9% in Livingston — top-decile yield for the area; either an underpriced asset or a hidden risk that comps aren't pricing in. Stress-test before assuming the spread holds.
Location & tenants
- Location reads 59/100 on livability (#1,113 in TX) — a working-class tenant base; expect higher turnover. Strengths: cost of living A+, housing A, health & safety A; Watch: crime F, amenities F, commute F.
- Livingston ISD (rural): math 38% / reading 39% proficiency, ranked #459 of 826 in TX (top 56%) — families likely to look elsewhere, expect single-tenant / working-renter base with shorter leases.
- Zoned schools: Timber Creek El (math 56% / reading 47%, grade C-, #808 of 4,322 statewide, top 19%, 522 students, 74% FRL); Livingston J H (math 30% / reading 32%, grade F, #1,015 of 1,662 statewide, top 62%, 893 students, 62% FRL); Livingston H S (math 35% / reading 46%, grade F, #798 of 1,632 statewide, top 49%, 1,128 students, 51% FRL) — zoned schools at 63% FRL track the district average.
- Market conditions: 1202 active listings in the ZIP; 1 comparable units currently listed for rent nearby; 769 units permitted in Polk County in 2024 (0 in 5+ unit buildings).
Forward outlook
- Local home prices are declining (-3.0%/yr); year-one equity from $892 of loan paydown is wiped out by about $4k of value loss. Plan a longer hold.
- Polk County population projected at +16% by 2050 — long-run rental-demand tailwind backs the buy-and-hold thesis.
Negotiation context
- It's been on market 287 days — a 12% lower offer ($114k) is reasonable based on typical stale-listing flexibility.
- 6 sale attempts since 4y ago; this cycle's ask has dropped $16k (11%) from the opening price — seller is motivated, your offer sets the floor, not the list.
- Current owner paid $12k; list at $129k implies a 1022% gain — meaningful room to come down on a strong offer.
Risks & watch-outs
- Watch-outs: built in 1955 — expect roof / HVAC / electrical / plumbing capex.
- Climate carrying-cost: severe wind risk, 98% chance of damaging wind over 30y; moderate wildfire risk; extreme-heat days projected 7→24/yr by 2055 (HVAC capex compounding) — expect insurance premiums to compound above CPI over the hold.
Questions for the listing agent
- It's been on market 287 days. Have you received any prior offers? Is the seller open to a 12% concession, seller financing, or rate buy-down credit?
- Built in 1955 — when were the roof, HVAC, electrical panel, plumbing, and water heater last replaced?
- Why hasn't it sold? Are there any deal-killer items the seller is aware of (foundation, flood, title, zoning, code violations)?
- Is there a deadline driving the sale (1031 exchange, divorce, estate, relocation)? That informs how much negotiation room exists.
- Schools are D-rated, which usually means shorter tenancies and higher turnover. Who's the typical renter profile here, and what's been the actual vacancy rate?
- Crime grade is F in this area — have there been break-ins, vandalism, or insurance claims at this property in the last 3 years? What carrier currently insures it and at what premium?
- What's the average days-on-market for RENTAL listings here right now (not sales)? A rising rental-DOM trend means longer vacancies and softer asking-rent achievability than the comps imply.
- What's the recent tenant-quality profile in this submarket — average credit score on applications, eviction rate, late-payment / NSF rate, and stable-employment percentage? A property-management company in the area should have these aggregated.
- How much new for-sale + rental construction is in the pipeline within 1–3 miles? Heavy new supply typically softens prices + rents 12–24 months out; constrained supply supports both.
Investment metrics
- 1% rule
- 1.05% ✓
- Cap rate
- 8.32%
- Cash-on-cash
- 7.23%
- DSCR
- 1.32
- GRM
- 7.9
CMA / ARV
- ARV (median comp)
- $204,352
- List price
- $129,000
- Delta
- -36.87%
- Verdict
- UNDERPRICED
- Comps
- 20 within 1.0 mi
Show comp detail 2 sales within ~0.75 mi
| Address | Dist | Beds/Ba | Sqft | Sold | Price | $/sf | Match |
|---|---|---|---|---|---|---|---|
| 419 Center St | 0.56mi | 3/1.0 (+1) | 1,168 (-10%) | 19mo | $69,000 | $59 | 37 |
| 108 Robert Ave | 0.65mi | 3/2.0 (+1) | 1,370 (+6%) | 20mo | $209,900 | $153 | 34 |
Match score weights: distance 35% · size 25% · config 20% · recency 20%. Top-matched comps best support the ARV.
Projected returns pro-forma
-3.0% appreciation · 3.0% rent growth · sell at horizon
- IRR
- -5.2%
- Equity multiple
- 0.80×
- Total profit
- $-7,051
- Equity at exit
- $19,234
- IRR
- 4.4%
- Equity multiple
- 1.32×
- Total profit
- $11,686
- Equity at exit
- $11,154
Cash invested: $36,120 (down + closing). Projections, not guarantees.
Landlord ↔ Tenant lean methodology
- Overall (STATE)
- 87 Strongly Landlord-Friendly
- State Texas
- 87 Strongly Landlord-Friendly · R+5
- County
- — inherits STATE
- City
- — inherits STATE
ZIP-level market 77351
- Home prices YoY
- -14.8%
- Active inventory
- 1202
- Price-to-rent
- 7.9×
Monthly cashflow live
- Estimated rent
- $1,354 medium interval (Pro) →
- Mortgage (P&I)
- −$676
- Tax from tax record
- −$121 /mo · $1,458/yr
- Insurance
- −$54
- HOA
- −$0
- Vacancy / Maint / Mgmt
- −$284
- Net cashflow
- $218
Break-even live
Sensitivity live
| Price | -10% $291 | -5% $254 | +0% $218 | +5% $181 | +10% $145 |
|---|---|---|---|---|---|
| Rent | -10% $111 | -5% $164 | +0% $218 | +5% $271 | +10% $324 |
| Rate | -1.0pp $283 | -0.5pp $250 | base $218 | +0.5pp $184 | +1.0pp $150 |
UW: 25.0% down · 7.5% · 30yr · 1.5% tax · 5.0% vac · 8.0% maint · 8.0% mgmt
Financing live
Cash to close
- Down payment
- $32,250
- Closing costs
- $3,870
- Reserves months
- —
- Total cash needed
- —
Loan-product check · same deal, 3 products live
Conventional
25% down · 7.5% · 30yr
- Down + closing
- —
- Monthly P&I
- —
- Monthly cashflow
- —
- DSCR
- —
- Eligible?
- —
Personal DTI + credit; lowest rate.
DSCR
20% down · 8.5% · 30yr
- Down + closing
- —
- Monthly P&I
- —
- Monthly cashflow
- —
- DSCR
- —
- Eligible?
- —
No personal income docs; deal must DSCR.
Hard money
10% down · 12.0% · 12mo
- Down + closing
- —
- Monthly P&I
- —
- Monthly cashflow
- —
- DSCR
- —
- Eligible?
- —
Short-term bridge; refi at stabilization.
Rent comps 1 comps
| Address | Beds | Baths | Sqft | Rent | $/sqft | DOM | Units | Dist |
|---|---|---|---|---|---|---|---|---|
| 2778 FM 3277 Unit 3277 Livingston, TX | 3.0 | 2.0 | 1490 | $1,495 | $1.00 | 0d | 1 | 0.61mi |
Listing history 37 events
-
2026-06-21days on market $129,000 Active 287 DOM
-
2026-06-18days on market $129,000 Active 284 DOM
-
2026-06-17days on market $129,000 Active 283 DOM
-
2026-06-16days on market $129,000 Active 282 DOM
-
2026-06-15days on market $129,000 Active 281 DOM
-
2026-06-10days on market $129,000 Active 275 DOM
-
2026-06-08days on market $129,000 Active 274 DOM
-
2026-06-07days on market $129,000 Active 273 DOM
-
2026-06-04days on market $129,000 Active 270 DOM
-
2026-06-03days on market $129,000 Active 269 DOM
-
2026-06-02days on market $129,000 Active 268 DOM
-
2026-06-01days on market $129,000 Active 267 DOM
-
2026-05-31days on market $129,000 Active 266 DOM
-
2026-03-04price $129,000 292-char remark
Show marketing remark (292 chars)
It's good to be HOME! Conveniently located in the heart of Livingston, TX. Offering a total of 4 bedrooms, this home has all the room you need! Enjoy the day in the privacy of your own backyard, completely fenced with a wrought iron gate. This one could be yours, schedule your showing today!
-
2026-01-07price $139,000 292-char remark
Show marketing remark (292 chars)
It's good to be HOME! Conveniently located in the heart of Livingston, TX. Offering a total of 4 bedrooms, this home has all the room you need! Enjoy the day in the privacy of your own backyard, completely fenced with a wrought iron gate. This one could be yours, schedule your showing today!
-
2025-11-18price $141,000 292-char remark
Show marketing remark (292 chars)
It's good to be HOME! Conveniently located in the heart of Livingston, TX. Offering a total of 4 bedrooms, this home has all the room you need! Enjoy the day in the privacy of your own backyard, completely fenced with a wrought iron gate. This one could be yours, schedule your showing today!
-
2025-09-07$145,000 Active 292-char remark
Show marketing remark (292 chars)
It's good to be HOME! Conveniently located in the heart of Livingston, TX. Offering a total of 4 bedrooms, this home has all the room you need! Enjoy the day in the privacy of your own backyard, completely fenced with a wrought iron gate. This one could be yours, schedule your showing today!
-
2023-12-21historical
-
2023-12-02$155,000 Active
-
2023-12-02historical
-
2023-10-20price $155,000
-
2023-09-26$162,000 Active
-
2023-09-26historical
-
2023-08-28price $162,000
-
2023-07-31price $168,000
-
2023-06-22$180,000 Active
-
2023-03-11historical
-
2023-01-19price $179,000
-
2022-12-30price $185,000
-
2022-12-06$195,000 Active
-
2022-12-01historical
-
2022-09-29price $196,000
-
2022-09-05price $204,000
-
2022-08-27price $209,000
-
2022-08-08$215,000 Active
-
2015-10-19soldstatus
-
1995-04-13soldstatus $11,500
ⓘ Source: listings_history table (triggers on properties + properties_extension) + one-shot
backfill from property_details.listing_events for pre-trigger history.
Tax reassessment forecast TX · Resets to sale price
- Current annual tax
- $1,458 · $121/mo
- Projected year-2 tax
- $2,361 · $197/mo
- Expected delta
- +$903/yr (+$75/mo · 61.9%)
ⓘ Screening estimate from a state-policy table — verify with the county assessor before closing.
Climate risk First Street
- Flood 1/10 Low FEMA zone X (unshaded) · 0% chance over 30 yrs
- Wildfire 5/10 Major
- Heat 8/10 Severe 7 d/yr ≥111°F today · 24 d/yr by 30 yrs out
- Wind 8/10 Severe 98% chance of damaging wind over 30 yrs
- Air quality 1/10 Low 0 unhealthy d/yr today · 0 by 30 yrs out
Nearby sold comps map
Loading sold comps map…
Walkable amenities ~0.75 mi
Loading nearby amenities…
Taxation est. · year 1
- Rental income
- $16,242
- − Mortgage interest
- −$7,226
- − Property taxes
- −$1,458
- − Insurance
- −$645
- − Repairs & maintenance
- −$1,299
- − Management
- −$1,299
- − Depreciation
- −$3,753
- Taxable income
- $562
- Est. tax owed @ 24.0%
- −$135
- After-tax cash flow
- $2,476/yr
For passive investors: Depreciation is non-cash, so a rental often shows a tax loss while cash-flowing — sheltering income. Rental losses are passive: they offset passive income freely, and up to $25,000/yr can offset ordinary (W-2) income if you actively participate and your MAGI is under $100k (phasing out to $0 by $150k); unused losses carry forward. On sale, claimed depreciation is recaptured at up to 25%, and gains may owe capital-gains tax (a 1031 exchange can defer both). Figures are a year-1 estimate at your 24.0% rate — not tax advice; consult a CPA.
Schools (NCES district)
- District
- Livingston ISD
- NCES district ID
- 4827780
- Math proficiency
- 38% ▼ -1.00%
- Reading proficiency
- 39% ▲ 3.00%
- Median HH income
- $39,531
- Composite
- 32.25/100
- National rank
- #5767
- State rank
- #459 of 826 in TX
Livability — Livingston
- Score
- 59/100
- State rank
- #1113
- US rank
- #19723
Category grades
Schools grade is shown separately in the Schools card above.
Census & demographics
- Census place
- Livingston, TX
- County
- Polk County · 37,143 people
- City population
- 37,143
- Metro
- nan
- Population (ZIP)
- 37,143
- Household income
- $66,834
- Rent vs Own
- Severe rent burden
- 608.0
Population outlook (Polk County) Hauer SSP2
- Today (2025)
- 51,049 people
- By 2030
- 53,243 · +4.3%
- By 2040
- 56,528 · +10.7%
- By 2050
- 59,243 · +16.1%
- By 2075
- 63,528 · +24.4%
- By 2100
- 60,376 · +18.3%
Race, ethnicity, and origin ACS 2023
- Neighborhood character
- Predominantly White (72%)
- Race & ethnicity
- White 72% Hispanic / Latino 14% Two or more races 9% Black 8% Native American 2%
- Hispanic origin (detail)
- Mexican 11%
- Common ancestry
- Lithuanian 2% Italian 2% Portuguese 2%
- Foreign-born
- 5% · Canada
- Languages at home
- 88% English-only · Spanish 10%
Political lean MEDSL · Polk
- 2024 margin
- Solid R (+58.9) · D 20.2% · R 79.1%
- 2008→2024 swing
- -21.7pp toward R · 2008: -37.2pp · 2024: -58.9pp
- All cycles
- 2024: R+58.9 2020: R+54.5 2016: R+56.5 2012: R+48.2 2008: R+37.2
Not yet ingested
- Civics
- —
Market trends
- HPI YoY
- ▼ -31.11%
- Current HPI
- 178.5316
- Rent YoY
- —
- Metro
- nan
- State GDP YoY
- ▲ 3.95%
- F500 in state
- 110
Industry mix (Fortune 500 HQ in TX)
| Industry | F500 HQs | Revenue |
|---|---|---|
| Energy | 16 | $1,198B |
|
||
| Technology | 5 | $198B |
|
||
| Engineering / Construction | 4 | $72B |
|
||
| Energy Services | 3 | $60B |
|
||
| Utilities | 3 | $41B |
|
||
| Healthcare | 2 | $330B |
|
||
Price history
+1021.7% since first listed24 events — show timeline
- 2026-03-04 Price Changed $129,000 HARMLS
- 2026-01-07 Price Changed $139,000 HARMLS
- 2025-11-18 Price Changed $141,000 HARMLS
- 2025-09-07 Listed $145,000 HARMLS
- 2023-12-21 Listing Removed — HARMLS
- 2023-12-02 Listing Removed — HARMLS
- 2023-12-02 Listed $155,000 HARMLS
- 2023-10-20 Price Changed $155,000 HARMLS
- 2023-09-26 Listing Removed — HARMLS
- 2023-09-26 Listed $162,000 HARMLS
- 2023-08-28 Price Changed $162,000 HARMLS
- 2023-07-31 Price Changed $168,000 HARMLS
- 2023-06-22 Listed $180,000 HARMLS
- 2023-03-11 Listing Removed — HARMLS
- 2023-01-19 Price Changed $179,000 HARMLS
- 2022-12-30 Price Changed $185,000 HARMLS
- 2022-12-06 Listed $195,000 HARMLS
- 2022-12-01 Listing Removed — HARMLS
- 2022-09-29 Price Changed $196,000 HARMLS
- 2022-09-05 Price Changed $204,000 HARMLS
- 2022-08-27 Price Changed $209,000 HARMLS
- 2022-08-08 Listed $215,000 HARMLS
- 2015-10-19 Sold (Public Records) — Public Records
- 1995-04-13 Sold (Public Records) $11,500 Public Records
Property tax history
+8.3%/yrLatest (2025): $1,458 · +4.5% YoY. Source: county tax records.
Cash-flow waterfall
monthlySold comps — $/sqft
last 12 mo · ≤1 miLoading sold comps…