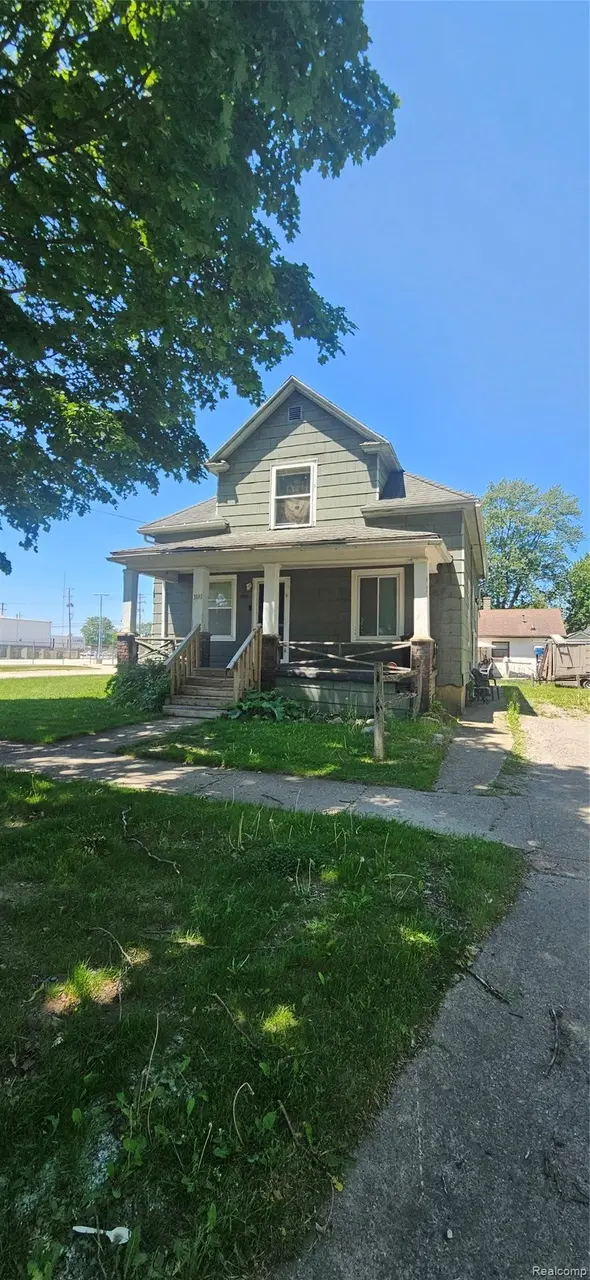
1819 S Niagara St · Saginaw, MI
Flood risk 1/10 · Minimal
- FEMA flood zone
- X (unshaded)
- Chance of flooding over 30 yrs
- 0.0%
- Est. flood insurance / yr
- $507 – $1,088
Fire risk 1/10 · Minimal
- Est. fire insurance / yr
- $784 – $1,456
Heat risk 2/10 · Minimal
- Hot days now (above 99°F)
- 7 days/yr
- Hot days in 30 yrs
- 14 days/yr
Wind risk 1/10 · Minimal
- Chance of severe wind over 30 yrs
- —
Air-quality risk 2/10 · Minimal
- Unhealthy air days now
- 1 days/yr
- Unhealthy air days in 30 yrs
- 2 days/yr
Risk factors via First Street. Map © Google.
Why this score? — see what drove the B- grade
The composite is a weighted blend of 9 inputs, each scored 0–100. Each bar is that input's sub-score; the figure is the points it added to the 100-point composite (weight × sub-score).
- Cash flow +25.1/30.0
- ARV discount +13.7/15.0
- DSCR +8.2/10.0
- 1% rule +7.3/10.0
- Rent growth +3.5/5.0
- Livability +3.2/5.0
- Condition / age +2.5/5.0
- Schools +2.0/10.0
- Appreciation +0.0/10.0
$70,000
🖨 Deal sheet (PDF) 📄 Offer letter ✓ Due diligence
Listing remarks MLS
Great investment opportunity! This tenant-occupied multi-family property offers immediate rental income with established tenants already in place. The main residence features multiple bedrooms, full bathrooms, a basement, and covered porch areas, providing comfortable living space for occupants. The property has been maintained as an income-producing investment and is currently generating rental revenue. An additional highlight of this property is the detached garage, which has been converted into a separate rental unit. This unit includes a bedroom and full bathroom and is also tenant occupied, creating an additional source of rental income. Both the main residence and the converted garage unit are currently occupied by tenants who pay rent, making this an attractive opportunity for investors seeking cash flow from day one. Situated on a convenient city lot with public utilities, this property offers the potential for continued rental income and long-term investment value. Please do not disturb tenants. All showings are by appointment only and must be scheduled in advance with sufficient notice. Buyer and buyer's agent to verify all information.
Key facts
- Tenant occupied
- Separate rental unit
- Covered porch areas
Tags
Property features AI
Exterior
- Parking: Driveway; no garage
- Utilities: Public sewer; No water source specified
- Home design: Single-family residence; Two levels; Ground-level entry
- Construction: Asphalt construction materials
- Exterior features: Paved road access; Lot dimensions approximately 60 x 109.3 (0.15 acre)
Interior
- Bathrooms: Two full bathrooms
- Heating & cooling: Forced air heating (natural gas); No cooling
- Interior features: Has basement
Neighborhood map
What this means for you Summary
Snapshot
- This is a 2-bed/2.0-bath single-family listed at $70k.
Deal economics
- At list price, monthly cash flow is $155 ($2k/yr) — positive.
- The deal already cash-flows at list — no discount required.
- Meets the 1% rule at list price ($864 rent vs $70k).
- Recommended offer: $69k (1.5% below list) — sets the bar for market timing.
Location & tenants
- Location reads 63/100 on livability (#521 in MI) — a middle-class / working-renter tenant base. Strengths: cost of living A+, housing A+, health & safety A+; Watch: schools F, crime F, amenities F.
- Saginaw School District (urban): math 20% / reading 29% proficiency, ranked #444 of 540 in MI (top 82%) — low school quality limits family demand, transient renter base, plan for 1-2y turnover; 76% free/reduced lunch — lower-income household profile, screen leases tightly.
- Market conditions: Rents rising (+4.0%/yr); 250 active listings in the ZIP; 3 comparable units currently listed for rent nearby; rentals lingering (median 45d on market — plan ~5-8 weeks vacancy on turnover, expect pricing pressure); 100% of comp listings sitting > 30 days — soft ceiling on asking rent; 154 units permitted in Saginaw County in 2024 (0 in 5+ unit buildings).
Forward outlook
- Local home prices are declining (-3.0%/yr); year-one equity from $484 of loan paydown is wiped out by about $2k of value loss. Plan a longer hold.
- Saginaw County population projected at -25% by 2050 — secular population decline; favor cash flow + early exit over multi-decade hold.
- At projected returns (-3.0% appreciation + 4.0% rent growth), your $20k cash investment doubles in ~10 years — after that, you're playing with house money.
Negotiation context
- It's been on market 20 days — a 2% lower offer ($69k) is reasonable based on typical stale-listing flexibility.
- 8 sale attempts since 5y ago; this cycle's ask has dropped $5k (7%) from the opening price — seller is motivated, your offer sets the floor, not the list.
- Current owner paid $40k; list at $70k implies a 77% gain — meaningful room to come down on a strong offer.
Risks & watch-outs
- Watch-outs: built in 1906 — expect roof / HVAC / electrical / plumbing capex.
Questions for the listing agent
- Built in 1906 — when were the roof, HVAC, electrical panel, plumbing, and water heater last replaced?
- Is there a deadline driving the sale (1031 exchange, divorce, estate, relocation)? That informs how much negotiation room exists.
- Schools are F-rated, which usually means shorter tenancies and higher turnover. Who's the typical renter profile here, and what's been the actual vacancy rate?
- Crime grade is F in this area — have there been break-ins, vandalism, or insurance claims at this property in the last 3 years? What carrier currently insures it and at what premium?
- What's the average days-on-market for RENTAL listings here right now (not sales)? A rising rental-DOM trend means longer vacancies and softer asking-rent achievability than the comps imply.
- What's the recent tenant-quality profile in this submarket — average credit score on applications, eviction rate, late-payment / NSF rate, and stable-employment percentage? A property-management company in the area should have these aggregated.
- How much new for-sale + rental construction is in the pipeline within 1–3 miles? Heavy new supply typically softens prices + rents 12–24 months out; constrained supply supports both.
Investment metrics
- 1% rule
- 1.23% ✓
- Cap rate
- 8.95%
- Cash-on-cash
- 9.47%
- DSCR
- 1.42
- GRM
- 6.8
CMA / ARV
- ARV (on-the-fly)
- $81,120
- Comps found
- 12
Show comp detail 12 sales within ~0.75 mi
| Address | Dist | Beds/Ba | Sqft | Sold | Price | $/sf | Match |
|---|---|---|---|---|---|---|---|
| 1712 S Hamilton St | 0.08mi | 3/1.5 (+1) | 1,381 (+11%) | 9mo | $89,000 | $64 | 64 |
| 1711 S Niagara St | 0.08mi | 3/1.0 (+1) | 1,106 (-11%) | 10mo | $47,500 | $43 | 60 |
| 1120 S Hamilton St | 0.41mi | 2/1.0 | 1,320 (+6%) | 10mo | $20,000 | $15 | 59 |
| 1430 Marquette St | 0.45mi | 3/1.0 (+1) | 1,301 (+4%) | 5mo | $30,000 | $23 | 59 |
| 1522 Gilbert St | 0.46mi | 2/1.0 | 1,112 (-11%) | 1mo | $67,000 | $60 | 56 |
| 819 Grove St | 0.60mi | 3/1.0 (+1) | 1,298 (+4%) | 3mo | $85,000 | $65 | 54 |
| 1843 Kendrick St | 0.63mi | 3/1.0 (+1) | 1,296 (+4%) | 4mo | $47,000 | $36 | 52 |
| 1618 Division St | 0.64mi | 2/1.0 | 1,190 (-5%) | 10mo | $88,000 | $74 | 50 |
| 1521 Chestnut St | 0.64mi | 3/1.5 (+1) | 1,118 (-10%) | 6mo | $102,000 | $91 | 41 |
| 1830 Jordan St | 0.62mi | 3/2.0 (+1) | 1,095 (-12%) | 7mo | $80,000 | $73 | 40 |
| 305 Garden Ln | 0.69mi | 2/1.0 | 1,097 (-12%) | 10mo | $109,900 | $100 | 35 |
| 1 Southlawn Ct | 0.68mi | 3/1.0 (+1) | 1,090 (-13%) | 4mo | $116,900 | $107 | 35 |
Match score weights: distance 35% · size 25% · config 20% · recency 20%. Top-matched comps best support the ARV.
Projected returns pro-forma
-3.0% appreciation · 3.98% rent growth · sell at horizon
- IRR
- -0.8%
- Equity multiple
- 0.97×
- Total profit
- $-588
- Equity at exit
- $10,437
- IRR
- 10.0%
- Equity multiple
- 1.81×
- Total profit
- $15,941
- Equity at exit
- $6,052
Cash invested: $19,600 (down + closing). Projections, not guarantees.
Landlord ↔ Tenant lean methodology
- Overall (STATE)
- 62 Landlord-Friendly
- State Michigan
- 62 Landlord-Friendly · EVEN
- County
- — inherits STATE
- City
- — inherits STATE
ZIP-level market 48602
- Home prices YoY
- -19.7%
- Rents YoY
- 4.0%
- Active inventory
- 250
- Price-to-rent
- 6.8×
Monthly cashflow live
- Estimated rent
- $864 medium interval (Pro) →
- Mortgage (P&I)
- −$367
- Tax from tax record
- −$132 /mo · $1,579/yr
- Insurance
- −$29
- HOA
- −$0
- Vacancy / Maint / Mgmt
- −$181
- Net cashflow
- $155
Break-even live
Sensitivity live
| Price | -10% $194 | -5% $175 | +0% $155 | +5% $135 | +10% $115 |
|---|---|---|---|---|---|
| Rent | -10% $86 | -5% $121 | +0% $155 | +5% $189 | +10% $223 |
| Rate | -1.0pp $190 | -0.5pp $173 | base $155 | +0.5pp $137 | +1.0pp $118 |
UW: 25.0% down · 7.5% · 30yr · 1.5% tax · 5.0% vac · 8.0% maint · 8.0% mgmt
Financing live
Cash to close
- Down payment
- $17,500
- Closing costs
- $2,100
- Reserves months
- —
- Total cash needed
- —
Loan-product check · same deal, 3 products live
Conventional
25% down · 7.5% · 30yr
- Down + closing
- —
- Monthly P&I
- —
- Monthly cashflow
- —
- DSCR
- —
- Eligible?
- —
Personal DTI + credit; lowest rate.
DSCR
20% down · 8.5% · 30yr
- Down + closing
- —
- Monthly P&I
- —
- Monthly cashflow
- —
- DSCR
- —
- Eligible?
- —
No personal income docs; deal must DSCR.
Hard money
10% down · 12.0% · 12mo
- Down + closing
- —
- Monthly P&I
- —
- Monthly cashflow
- —
- DSCR
- —
- Eligible?
- —
Short-term bridge; refi at stabilization.
Rent comps 3 comps
| Address | Beds | Baths | Sqft | Rent | $/sqft | DOM | Units | Dist |
|---|---|---|---|---|---|---|---|---|
| 1827 Gilbert St Saginaw, MI | 3.0 | 2.0 | 1008 | $695 | $0.69 | 44d | 1 | 0.73mi |
| 2021 Grout St Saginaw, MI | 1.0–2.0 | 1.0 | 862 | $995 | $1.15 | 44d | 1 | 0.79mi |
| 113 Parkside Ct Saginaw, MI | 1.0–3.0 | 1.0–1.5 | 808 | $800 | $0.99 | 44d | 1 | 1.45mi |
Listing history 16 events
-
2026-06-19days on market $70,000 Active 20 DOM
-
2026-06-18days on market $70,000 Active 19 DOM
-
2026-06-17days on market $70,000 Active 18 DOM
-
2026-06-16days on market $70,000 Active 17 DOM
-
2026-06-15days on market $70,000 Active 16 DOM
-
2026-06-14days on market $70,000 Active 14 DOM
-
2026-06-12pricedays on market $70,000 Active 13 DOM
-
2026-06-09days on market $75,000 Active 10 DOM
-
2026-06-08days on market $75,000 Active 9 DOM
-
2026-06-07days on market $75,000 Active 8 DOM
-
2026-06-05days on market $75,000 Active 5 DOM
-
2026-06-03days on market $75,000 Active 4 DOM
-
2026-06-02days on market $75,000 Active 3 DOM
-
2026-06-01days on market $75,000 Active 2 DOM
-
2026-05-31remarks 699-char remark
-
2026-05-31$75,000 Active 1 DOM
ⓘ Source: listings_history table (triggers on properties + properties_extension) + one-shot
backfill from property_details.listing_events for pre-trigger history.
Tax reassessment forecast MI · Partial reset (capped growth)
- Current annual tax
- $1,579 · $132/mo
- Projected year-2 tax
- $1,579 · $132/mo
- Expected delta
- $0/yr ($0/mo · 0.0%)
ⓘ Screening estimate from a state-policy table — verify with the county assessor before closing.
Climate risk First Street
- Flood 1/10 Low FEMA zone X (unshaded) · 0% chance over 30 yrs
- Wildfire 1/10 Low
- Heat 2/10 Low 7 d/yr ≥99°F today · 14 d/yr by 30 yrs out
- Wind 1/10 Low
- Air quality 2/10 Low 1 unhealthy d/yr today · 2 by 30 yrs out
Nearby sold comps map
Loading sold comps map…
Walkable amenities ~0.75 mi
Loading nearby amenities…
Taxation est. · year 1
- Rental income
- $10,368
- − Mortgage interest
- −$3,921
- − Property taxes
- −$1,579
- − Insurance
- −$350
- − Repairs & maintenance
- −$829
- − Management
- −$829
- − Depreciation
- −$2,036
- Taxable income
- $823
- Est. tax owed @ 24.0%
- −$197
- After-tax cash flow
- $1,659/yr
For passive investors: Depreciation is non-cash, so a rental often shows a tax loss while cash-flowing — sheltering income. Rental losses are passive: they offset passive income freely, and up to $25,000/yr can offset ordinary (W-2) income if you actively participate and your MAGI is under $100k (phasing out to $0 by $150k); unused losses carry forward. On sale, claimed depreciation is recaptured at up to 25%, and gains may owe capital-gains tax (a 1031 exchange can defer both). Figures are a year-1 estimate at your 24.0% rate — not tax advice; consult a CPA.
Schools (NCES district)
- District
- Saginaw School District
- NCES district ID
- 2630390
- Math proficiency
- 20% ▼ -5.00%
- Reading proficiency
- 29% ▼ -3.00%
- Median HH income
- $28,940
- Composite
- 19.6/100
- National rank
- #8755
- State rank
- #444 of 540 in MI
Livability — Saginaw
- Score
- 63/100
- State rank
- #521
- US rank
- #15424
Category grades
Schools grade is shown separately in the Schools card above.
Census & demographics
- Census place
- Saginaw, MI
- County
- Saginaw County · 54,884 people
- City population
- 54,884
- Metro
- Saginaw, MI
- Population (ZIP)
- 27,127
- Household income
- $46,984
- Rent vs Own
- Severe rent burden
- 1416.0
Population outlook (Saginaw County) Hauer SSP2
- Today (2025)
- 180,568 people
- By 2030
- 172,302 · -4.6%
- By 2040
- 153,919 · -14.8%
- By 2050
- 135,519 · -24.9%
- By 2075
- 97,199 · -46.2%
- By 2100
- 65,037 · -64.0%
Race, ethnicity, and origin ACS 2023
- Neighborhood character
- Diverse neighborhood (Simpson 0.64)
- Race & ethnicity
- White 50% Black 27% Hispanic / Latino 17% Two or more races 12%
- Hispanic origin (detail)
- Mexican 14% Puerto Rican 1%
- Common ancestry
- Romanian 4% Lithuanian 3% Italian 2%
- Foreign-born
- 1% · Canada
- Languages at home
- 96% English-only · Spanish 3%
Political lean MEDSL · Saginaw
- 2024 margin
- Toss-up / Even · D 47.7% · R 51.0% · Other 1.4%
- 2008→2024 swing
- -20.6pp toward R · 2008: 17.3pp · 2024: -3.3pp
- All cycles
- 2024: R+3.3 2020: D+0.3 2016: R+1.1 2012: D+11.9 2008: D+17.3
Not yet ingested
- Civics
- —
Market trends
- HPI YoY
- ▼ -39.15%
- Current HPI
- 159.8807
- Rent YoY
- ▲ 3.98%
- Metro
- Saginaw, MI
- State GDP YoY
- ▲ 1.37%
- F500 in state
- 28
Industry mix (Fortune 500 HQ in MI)
| Industry | F500 HQs | Revenue |
|---|---|---|
| Automotive Parts | 3 | $48B |
|
||
| Automotive | 2 | $372B |
|
||
| Chemicals | 1 | $45B |
|
||
| Automotive Retail | 1 | $29B |
|
||
| Healthcare / Medical Devices | 1 | $23B |
|
||
| Automotive Technology | 1 | $20B |
|
||
Price history
+50.3% since first listed23 events — show timeline
- 2026-05-30 Listed $75,000 REALCOMP
- 2026-05-30 Listed $75,000 MiRealSource-MiMLS
- 2026-01-16 Listing Removed — REALCOMP
- 2026-01-16 Listing Removed — MiRealSource-MiMLS
- 2025-12-23 Price Changed $75,000 MiRealSource-MiMLS
- 2025-12-22 Price Changed $75,000 REALCOMP
- 2025-11-28 Listed $80,000 REALCOMP
- 2025-11-28 Listed $80,000 MiRealSource-MiMLS
- 2022-07-18 Price Changed $575 RENT.
- 2022-02-11 Sold (MLS) $39,500 MiRealSource-MiMLS
- 2022-02-11 Sold (MLS) $39,500 REALCOMP
- 2022-01-19 Pending — REALCOMP
- 2022-01-19 Pending — MiRealSource-MiMLS
- 2021-12-30 Price Changed $39,900 MiRealSource-MiMLS
- 2021-12-29 Price Changed $39,900 REALCOMP
- 2021-09-09 Price Changed $44,900 MiRealSource-MiMLS
- 2021-09-09 Price Changed $44,900 REALCOMP
- 2021-07-26 Relisted — REALCOMP
- 2021-07-26 Relisted — MiRealSource-MiMLS
- 2021-07-14 Pending — REALCOMP
- 2021-07-14 Pending — MiRealSource-MiMLS
- 2021-06-22 Listed $49,900 MiRealSource-MiMLS
- 2021-06-22 Listed $49,900 REALCOMP
Property tax history
+3.3%/yrLatest (2025): $1,579 · -16.3% YoY. Source: county tax records.
Cash-flow waterfall
monthlySold comps — $/sqft
last 12 mo · ≤1 miLoading sold comps…