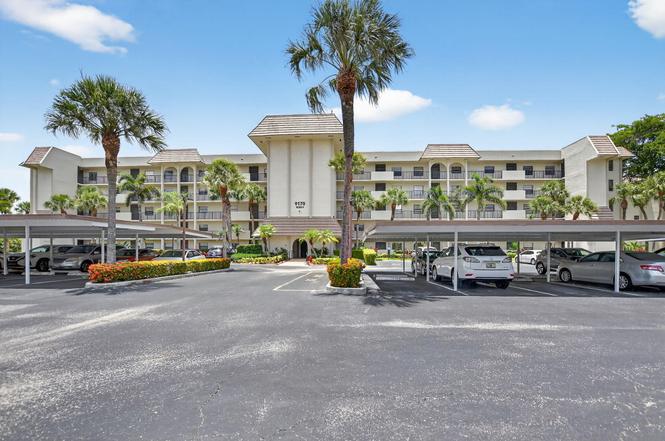
9170 SW 14th St #4105 · Coconut Creek, FL
Flood risk 1/10 · Minimal
- FEMA flood zone
- X (unshaded)
- Chance of flooding over 30 yrs
- 0.0%
- Est. flood insurance / yr
- $507 – $1,088
Fire risk 1/10 · Minimal
- Est. fire insurance / yr
- $947 – $1,759
Heat risk 9/10 · Severe
- Hot days now (above 107°F)
- 7 days/yr
- Hot days in 30 yrs
- 25 days/yr
Wind risk 10/10 · Severe
- Chance of severe wind over 30 yrs
- 99.0%
Air-quality risk 3/10 · Minor
- Unhealthy air days now
- 2 days/yr
- Unhealthy air days in 30 yrs
- 3 days/yr
Risk factors via First Street. Map © Google.
Why this score? — see what drove the B- grade
The composite is a weighted blend of 9 inputs, each scored 0–100. Each bar is that input's sub-score; the figure is the points it added to the 100-point composite (weight × sub-score).
- Cash flow +26.4/30.0
- 1% rule +10.0/10.0
- DSCR +9.0/10.0
- ARV discount +7.5/15.0
- Schools +4.3/10.0
- Livability +4.2/5.0
- Rent growth +3.4/5.0
- Condition / age +2.5/5.0
- Appreciation +0.0/10.0
$165,000
🖨 Deal sheet 📄 Offer letter ✓ Due diligence
Listing remarks
Enjoy easy first-floor access in this spacious 2BR/2BA condo featuring a large enclosed Florida room with expansive garden views. The updated kitchen offers granite countertops, white cabinetry, stainless steel appliances, and a convenient pass-through to the dining area. Bright, open floor plan with tile flooring in main areas and carpet/laminate in bedrooms. The generous primary suite includes excellent closet space and a bath with double sinks and a walk-in shower. The Patios offers 2 pools, spas, tennis, fitness room, game and billiard rooms. Community passed Milestone and SIRS studies with strong reserves and structural integrity. New hurricane-rated foam roofs add long-term value.
Key facts
- Garden views
- Updated kitchen
- First-floor access
Tags
Property features AI
Finance
- Other: Pets not allowed
- HOA & community: Homeowners association with monthly fee; HOA amenities include billiard room, clubhouse, elevators, fitness center, game room, parking, pool, tennis courts, community room and sidewalks; HOA fee paid monthly; HOA fee includes insurance, grounds maintenance, sewer, trash, water, common areas, elevator and recreation facility; Senior community
Exterior
- Parking: Assigned parking; Detached carport
- Utilities: Public water; Public sewer; Three-phase electric; Cable available
- Home design: Condominium; Resale property; Northeast-facing; 5-story building
- Construction: CBS construction; Built as part of a 5-story building
- Exterior features: Covered patio; Screened patio; Patio; Porch; Glass-enclosed patio/porch; Entry-level living area
Interior
- Kitchen: Electric range; Dishwasher; Microwave; Refrigerator; Garbage disposal; Electric water heater
- Bedrooms: 2 bedrooms on the main level
- Flooring: Carpet; Laminate
- Bathrooms: 2 full bathrooms on the main level
- Heating & cooling: Central heating (electric); Central air conditioning (electric)
- Interior features: Entrance foyer; Walk-in closets; Split bedroom layout
- Laundry & utility: Inside laundry
Neighborhood map
What this means for you Summary
Snapshot
- This is a 2-bed/2.0-bath condo listed at $165k.
Deal economics
- At list price, monthly cash flow is $430 ($5k/yr) — positive.
- The deal already cash-flows at list — no discount required.
- Meets the 1% rule at list price ($3k rent vs $165k).
- Recommended offer: $145k (12.0% below list) — sets the bar for market timing.
- Cap rate 9.4% vs local median 3.7% in Coconut Creek — top-decile yield for the area; either an underpriced asset or a hidden risk that comps aren't pricing in. Stress-test before assuming the spread holds.
Location & tenants
- Location reads 85/100 on livability (#30 in FL, #617 nationally) — a professional / high-income tenant draw. Strengths: commute A+, housing A+, health & safety A+; Watch: amenities F.
- Palm Beach (suburban): math 46% / reading 53% proficiency, ranked #34 of 73 in FL (top 47%) — families likely to look elsewhere, expect single-tenant / working-renter base with shorter leases.
- Market conditions: Rents rising (+3.7%/yr); 267 active listings in the ZIP; 40 comparable units currently listed for rent nearby; rentals at typical pace (median 17d on market — plan ~3-4 weeks tenant-placement turnaround); solid renter incomes; 3,974 units permitted in Palm Beach County in 2024 (1,012 in 5+ unit buildings).
- This rent runs 41% of the median local income ($89k/yr) — at the standard rent-burdened threshold; future hikes will face affordability resistance.
Forward outlook
- Local home prices are declining (-3.0%/yr); year-one equity from $1k of loan paydown is wiped out by about $5k of value loss. Plan a longer hold.
- Palm Beach County population projected at +30% by 2050 — long-run rental-demand tailwind backs the buy-and-hold thesis.
- At projected returns (-3.0% appreciation + 3.7% rent growth), your $46k cash investment doubles in ~9 years — after that, you're playing with house money.
Negotiation context
- It's been on market 147 days — a 12% lower offer ($145k) is reasonable based on typical stale-listing flexibility.
- 5 sale attempts since 17y ago; this cycle's ask has dropped $30k (15%) from the opening price — seller is motivated, your offer sets the floor, not the list.
- Current owner paid $122k; 35% above their basis — modest negotiation headroom, anchor on the comps not their cost.
Risks & watch-outs
- Watch-outs: HOA is 32% of rent.
- Climate carrying-cost: severe wind risk, 99% chance of damaging wind over 30y; extreme-heat days projected 7→25/yr by 2055 (HVAC capex compounding) — expect insurance premiums to compound above CPI over the hold.
Questions for the listing agent
- It's been on market 147 days. Have you received any prior offers? Is the seller open to a 12% concession, seller financing, or rate buy-down credit?
- What does the HOA fee cover, when was the last increase, and are there any pending special assessments or reserve-fund shortfalls?
- Any open or pending special assessments — roof, HVAC, plumbing, elevator, façade? What's the per-unit balance and payoff schedule, and is the seller paying it off at close or rolling it to the buyer?
- Why hasn't it sold? Are there any deal-killer items the seller is aware of (foundation, flood, title, zoning, code violations)?
- Is there a deadline driving the sale (1031 exchange, divorce, estate, relocation)? That informs how much negotiation room exists.
- Schools are B-rated — typically a magnet for longer-tenancy family renters. What's the average tenant stay here, and is there a school-zone premium baked into asking?
- What's the average days-on-market for RENTAL listings here right now (not sales)? A rising rental-DOM trend means longer vacancies and softer asking-rent achievability than the comps imply.
- What's the recent tenant-quality profile in this submarket — average credit score on applications, eviction rate, late-payment / NSF rate, and stable-employment percentage? A property-management company in the area should have these aggregated.
- How much new apartment / multifamily construction is in the pipeline within 1–3 miles? Heavy new supply (>2% of stock underway) typically softens rents 12–24 months out; light construction supports rent growth.
Investment metrics
- 1% rule
- 1.85% ✓
- Cap rate
- 9.42%
- Cash-on-cash
- 11.17%
- DSCR
- 1.50
- GRM
- 4.5
CMA / ARV
No comps found within radius.
Projected returns pro-forma
-3.0% appreciation · 3.72% rent growth · sell at horizon
- IRR
- 1.9%
- Equity multiple
- 1.07×
- Total profit
- $3,427
- Equity at exit
- $24,602
- IRR
- 12.8%
- Equity multiple
- 2.08×
- Total profit
- $49,778
- Equity at exit
- $14,266
Cash invested: $46,200 (down + closing). Projections, not guarantees.
Landlord ↔ Tenant lean methodology
- Overall (STATE)
- 87 Strongly Landlord-Friendly
- State Florida
- 87 Strongly Landlord-Friendly · R+3
- County
- — inherits STATE
- City
- — inherits STATE
ZIP-level market 33428
- Rents YoY
- 3.7%
- Active inventory
- 267
- Price-to-rent
- 4.5×
Monthly cashflow live
- Estimated rent
- $3,048 high interval (Pro) →
- Mortgage (P&I)
- −$865
- Tax from tax record
- −$69 /mo · $828/yr
- Insurance
- −$69
- HOA
- −$975
- Vacancy / Maint / Mgmt
- −$640
- Net cashflow
- $430
Break-even live
UW: 25.0% down · 7.5% · 30yr · 1.5% tax · 5.0% vac · 8.0% maint · 8.0% mgmt
Financing live
Cash to close
- Down payment
- $41,250
- Closing costs
- $4,950
- Reserves months
- —
- Total cash needed
- —
Loan-product check · same deal, 3 products live
Conventional
25% down · 7.5% · 30yr
- Down + closing
- —
- Monthly P&I
- —
- Monthly cashflow
- —
- DSCR
- —
- Eligible?
- —
Personal DTI + credit; lowest rate.
DSCR
20% down · 8.5% · 30yr
- Down + closing
- —
- Monthly P&I
- —
- Monthly cashflow
- —
- DSCR
- —
- Eligible?
- —
No personal income docs; deal must DSCR.
Hard money
10% down · 12.0% · 12mo
- Down + closing
- —
- Monthly P&I
- —
- Monthly cashflow
- —
- DSCR
- —
- Eligible?
- —
Short-term bridge; refi at stabilization.
Rent comps 40 comps
| Address | Beds | Baths | Sqft | Rent | $/sqft | DOM | Units | Dist |
|---|---|---|---|---|---|---|---|---|
| 10098 Akenside Dr Boca Raton, FL | 3.0 | 2.5 | 2131 | $4,500 | $2.11 | 5d | 1 | 0.26mi |
| 10106 Akenside Dr Boca Raton, FL | 3.0 | 2.5 | 2131 | $4,600 | $2.16 | 24d | 1 | 0.27mi |
| 10111 Akenside Dr Unit 10111 Boca Raton, FL | 3.0 | 2.5 | 1728 | $3,600 | $2.08 | 15d | 1 | 0.28mi |
| 10111 Akenside Dr Unit 10111 Boca Raton, FL | 3.0 | 2.5 | 1728 | $3,600 | $2.08 | 4d | 1 | 0.28mi |
| 9235 SW 8th St Boca Raton, FL | 2.0 | 2.0 | 1045 | $2,175 | $2.08 | 11d | 4 | 0.33mi |
| 8951 SW 19th St Unit A Boca Raton, FL | 2.0 | 2.0 | 1196 | $2,800 | $2.34 | 17d | 1 | 0.36mi |
| 22800 SW 54th Way Boca Raton, FL | 3.0 | 2.0 | 1554 | $3,400 | $2.19 | 17d | 1 | 0.36mi |
| 10199 Akenside Dr Boca Raton, FL | 3.0 | 2.5 | 2020 | $4,850 | $2.40 | 8d | 1 | 0.36mi |
| 10222 Akenside Dr Boca Raton, FL | 3.0 | 2.5 | 2131 | $4,975 | $2.33 | 24d | 1 | 0.37mi |
| 9330 SW 61st Way Unit D Boca Raton, FL | 2.0 | 2.5 | 1593 | $2,600 | $1.63 | 17d | 1 | 0.37mi |
| 9260 Boca Vue Dr Boca Raton, FL | 1.0–3.0 | 1.0–2.0 | 1052 | $3,304 | $3.14 | 1d | 33 | 0.38mi |
| 9380 SW 61st Way Unit B Boca Raton, FL | 3.0 | 2.5 | 1593 | $2,900 | $1.82 | 24d | 1 | 0.43mi |
| 23442 Lyons Rd #406 Boca Raton, FL | 2.0 | 2.0 | 1218 | $2,300 | $1.89 | 24d | 1 | 0.45mi |
| 23466 Lyons Rd #504 Boca Raton, FL | 2.0 | 2.0 | 1127 | $2,300 | $2.04 | 24d | 1 | 0.48mi |
| 23312 SW 53rd Ave Unit C Boca Raton, FL | 3.0 | 2.5 | 1412 | $3,100 | $2.20 | 24d | 1 | 0.49mi |
| 23305 Barwood Ln N #207 Boca Raton, FL | 2.0 | 2.0 | 1300 | $1,875 | $1.44 | 24d | 1 | 0.49mi |
| 23305 Barwood Ln N #207 Boca Raton, FL | 2.0 | 2.0 | 1300 | $1,875 | $1.44 | 8d | 1 | 0.49mi |
| 22447 SW 56th Ave Boca Raton, FL | 3.0 | 2.0 | 1831 | $3,400 | $1.86 | 24d | 1 | 0.52mi |
| 9460 SW 61st Way Unit D Boca Raton, FL | 3.0 | 2.5 | 1600 | $2,900 | $1.81 | 24d | 1 | 0.53mi |
| 22465 SW 61st Way #247 Boca Raton, FL | 3.0 | 2.0 | 1407 | $2,700 | $1.92 | 24d | 1 | 0.58mi |
| 22465 SW 61st Way #247 Boca Raton, FL | 3.0 | 2.0 | 1407 | $2,600 | $1.85 | 4d | 1 | 0.58mi |
| 22745 SW 65th Way Boca Raton, FL | 3.0 | 2.0 | 1477 | $3,500 | $2.37 | 3d | 1 | 0.63mi |
| 22682 Family Cir Unit 22682 Boca Raton, FL | 3.0 | 2.0 | 1425 | $3,400 | $2.39 | 14d | 1 | 0.68mi |
| 9500 SW 3rd St #259 Boca Raton, FL | 2.0 | 2.5 | 1336 | $2,350 | $1.76 | 24d | 1 | 0.70mi |
| 23816 SW 65th Way Boca Raton, FL | 2.0 | 2.0 | 1954 | $900 | $0.46 | 5d | 1 | 0.72mi |
| 8361 Trent Ct Unit A Boca Raton, FL | 2.0 | 2.5 | 1302 | $2,475 | $1.90 | 5d | 1 | 0.75mi |
| 22765 SW 66th Ave #204 Boca Raton, FL | 2.0 | 2.0 | 1170 | $3,000 | $2.56 | 24d | 1 | 0.76mi |
| 8353 Trent Ct Unit C Boca Raton, FL | 2.0 | 2.5 | 1312 | $2,400 | $1.83 | 24d | 1 | 0.76mi |
| 9244 SW 2nd St Boca Raton, FL | 3.0 | 2.0 | 1480 | $3,300 | $2.23 | 24d | 1 | 0.77mi |
| 22735 SW 66th Ave Boca Raton, FL | 2.0 | 2.0 | 1170 | $2,300 | $1.97 | 5d | 1 | 0.78mi |
| 22217 SW 61st Ave Boca Raton, FL | 2.0 | 2.0 | 1318 | $3,200 | $2.43 | 15d | 1 | 0.82mi |
| 22217 SW 61st Ave Boca Raton, FL | 2.0 | 2.0 | 1318 | $3,200 | $2.43 | 22d | 1 | 0.82mi |
| 22217 SW 61st Ave Boca Raton, FL | 2.0 | 2.0 | 1318 | $3,200 | $2.43 | 2d | 1 | 0.82mi |
| 22201 Majestic Woods Way Boca Raton, FL | 2.0 | 2.5 | 1280 | $2,800 | $2.19 | 24d | 1 | 0.91mi |
| 8273 Severn Dr Unit D Boca Raton, FL | 2.0 | 2.5 | 1302 | $2,450 | $1.88 | 4d | 1 | 0.91mi |
| 8254 Severn Dr Unit A Boca Raton, FL | 3.0 | 3.0 | 1364 | $2,700 | $1.98 | 8d | 1 | 0.92mi |
| 8285 Severn Dr Unit B Boca Raton, FL | 2.0 | 2.5 | 1302 | $2,500 | $1.92 | 24d | 1 | 0.93mi |
| 10110 Boca Entrada Blvd Boca Raton, FL | 2.0 | 2.0 | 1155 | $2,338 | $2.02 | 4d | 2 | 0.98mi |
| 10110 Boca Entrada Blvd Boca Raton, FL | 2.0 | 2.0 | 1155 | $2,338 | $2.02 | 3d | 2 | 0.98mi |
| 10110 Boca Entrada Blvd #305 Boca Raton, FL | 2.0 | 2.0 | 1155 | $2,350 | $2.03 | 3d | 1 | 0.99mi |
HOA detail condo
- Monthly dues
- $975 · $11,700/yr
- Likely covers
- pool
- Assessments
- None detected in remarks — confirm with the listing agent.
Listing history 32 events
-
2026-06-18days on market $165,000 Active 147 DOM
-
2026-06-17days on market $165,000 Active 146 DOM
-
2026-06-16days on market $165,000 Active 145 DOM
-
2026-06-15days on market $165,000 Active 144 DOM
-
2026-06-13days on market $165,000 Active 142 DOM
-
2026-06-09days on market $165,000 Active 138 DOM
-
2026-06-07days on market $165,000 Active 136 DOM
-
2026-06-04days on market $165,000 Active 133 DOM
-
2026-06-03days on market $165,000 Active 132 DOM
-
2026-06-01days on market $165,000 Active 130 DOM
-
2026-05-31days on market $165,000 Active 129 DOM
-
2026-05-07historical Active Under Contract
-
2026-03-19price $165,000
-
2026-02-06price $184,500
-
2026-01-22historical
-
2026-01-22$195,000 Active
-
2025-12-26price $199,000
-
2025-12-26status Active
-
2025-12-06historical Active Under Contract
-
2025-10-08price $209,000
-
2025-08-18price $225,000
-
2025-07-29$250,000 Active
-
2025-07-26historical
-
2025-05-01price $275,000
-
2025-02-24price $295,000
-
2025-02-04$325,000 Active
-
2009-06-25soldstatus $122,000
-
2009-06-19soldstatus $122,000
-
2009-06-16historical
-
2009-02-09$124,900
-
1994-08-12soldstatus $90,000
-
1991-09-16soldstatus $74,500
ⓘ Source: listings_history table (triggers on properties + properties_extension) + one-shot
backfill from property_details.listing_events for pre-trigger history.
Tax reassessment forecast FL · Resets to sale price
- Current annual tax
- $828 · $69/mo
- Projected year-2 tax
- $1,370 · $114/mo
- Expected delta
- +$542/yr (+$45/mo · 65.4%)
ⓘ Screening estimate from a state-policy table — verify with the county assessor before closing.
Climate risk First Street
- Flood 1/10 Low FEMA zone X (unshaded) · 0% chance over 30 yrs
- Wildfire 1/10 Low
- Heat 9/10 Extreme 7 d/yr ≥107°F today · 25 d/yr by 30 yrs out
- Wind 10/10 Extreme 99% chance of damaging wind over 30 yrs
- Air quality 3/10 Moderate 2 unhealthy d/yr today · 3 by 30 yrs out
Nearby sold comps map
Loading sold comps map…
Walkable amenities ~0.75 mi
Loading nearby amenities…
Taxation est. · year 1
- Rental income
- $36,576
- − Mortgage interest
- −$9,243
- − Property taxes
- −$828
- − Insurance
- −$825
- − Repairs & maintenance
- −$2,926
- − Management
- −$2,926
- − HOA
- −$11,700
- − Depreciation
- −$4,800
- Taxable income
- $3,328
- Est. tax owed @ 24.0%
- −$799
- After-tax cash flow
- $4,360/yr
For passive investors: Depreciation is non-cash, so a rental often shows a tax loss while cash-flowing — sheltering income. Rental losses are passive: they offset passive income freely, and up to $25,000/yr can offset ordinary (W-2) income if you actively participate and your MAGI is under $100k (phasing out to $0 by $150k); unused losses carry forward. On sale, claimed depreciation is recaptured at up to 25%, and gains may owe capital-gains tax (a 1031 exchange can defer both). Figures are a year-1 estimate at your 24.0% rate — not tax advice; consult a CPA.
Schools (NCES district)
- District
- Palm Beach
- NCES district ID
- 1201500
- Math proficiency
- 46% ▼ -16.00%
- Reading proficiency
- 53% ▼ -4.00%
- Median HH income
- $53,943
- Composite
- 42.72/100
- National rank
- #3160
- State rank
- #34 of 73 in FL
Livability — Coconut Creek
- Score
- 85/100
- State rank
- #30
- US rank
- #617
Category grades
Schools grade is shown separately in the Schools card above.
Census & demographics
- County
- Palm Beach County · 1,438,312 people
- City population
- 50,557
- Metro
- Miami-Fort Lauderdale-Pompano Beach, FL
- Population (ZIP)
- 47,588
- Household income
- $88,543
- Rent vs Own
- Severe rent burden
- 1990.0
Population outlook (Palm Beach County) Hauer SSP2
- Today (2025)
- 1,637,487 people
- By 2030
- 1,743,255 · +6.5%
- By 2040
- 1,948,712 · +19.0%
- By 2050
- 2,132,979 · +30.3%
- By 2075
- 2,530,027 · +54.5%
- By 2100
- 2,706,979 · +65.3%
Race, ethnicity, and origin ACS 2023
- Neighborhood character
- Diverse neighborhood (Simpson 0.69)
- Race & ethnicity
- White 50% Two or more races 23% Hispanic / Latino 22% Black 7% Asian 5%
- Hispanic origin (detail)
- Mexican 3% Puerto Rican 3% Cuban 2% Dominican 1%
- Common ancestry
- Estonian 12% Romanian 3% Scotch-Irish 3%
- Foreign-born
- 37% · Canada, Jamaica, Vietnam
- Languages at home
- 55% English-only · Spanish 19% Other Indo-European 17% French/Haitian/Cajun 2%
Political lean MEDSL · Palm Beach
- 2024 margin
- Toss-up / Even · D 50.0% · R 49.2%
- 2008→2024 swing
- -22.1pp toward R · 2008: 22.9pp · 2024: 0.8pp
- All cycles
- 2024: D+0.8 2020: D+12.8 2016: D+15.3 2012: D+17.0 2008: D+22.9
Not yet ingested
- Civics
- —
Market trends
- HPI YoY
- ▼ -299.00%
- Current HPI
- 373.2649
- Rent YoY
- ▲ 3.72%
- Metro
- Miami-Fort Lauderdale-Pompano Beach, FL
- State GDP YoY
- ▲ 3.28%
- F500 in state
- 36
Industry mix (Fortune 500 HQ in FL)
| Industry | F500 HQs | Revenue |
|---|---|---|
| Industrial Technology | 2 | $29B |
|
||
| Insurance | 2 | $17B |
|
||
| Retail | 1 | $60B |
|
||
| Technology Distribution | 1 | $58B |
|
||
| Homebuilding | 1 | $35B |
|
||
| Technology Manufacturing | 1 | $35B |
|
||
Price history
+121.5% since first listed21 events — show timeline
- 2026-05-07 Contingent — Beaches MLS
- 2026-03-19 Price Changed $165,000 Beaches MLS
- 2026-02-06 Price Changed $184,500 Beaches MLS
- 2026-01-22 Listing Removed — Beaches MLS
- 2026-01-22 Listed $195,000 Beaches MLS
- 2025-12-26 Price Changed $199,000 Beaches MLS
- 2025-12-26 Relisted — Beaches MLS
- 2025-12-06 Contingent — Beaches MLS
- 2025-10-08 Price Changed $209,000 Beaches MLS
- 2025-08-18 Price Changed $225,000 Beaches MLS
- 2025-07-29 Listed $250,000 Beaches MLS
- 2025-07-26 Listing Removed — Beaches MLS
- 2025-05-01 Price Changed $275,000 Beaches MLS
- 2025-02-24 Price Changed $295,000 Beaches MLS
- 2025-02-04 Listed $325,000 Beaches MLS
- 2009-06-25 Sold (Public Records) $122,000 Public Records
- 2009-06-19 Sold (MLS) $122,000 Beaches MLS
- 2009-06-16 Listing Removed — Beaches MLS
- 2009-02-09 Listed $124,900 Beaches MLS
- 1994-08-12 Sold (Public Records) $90,000 Public Records
- 1991-09-16 Sold (Public Records) $74,500 Public Records
Property tax history
+0.1%/yrLatest (2025): $828 · +2.8% YoY. Source: county tax records.
Cash-flow waterfall
monthlySold comps — $/sqft
last 12 mo · ≤1 miLoading sold comps…