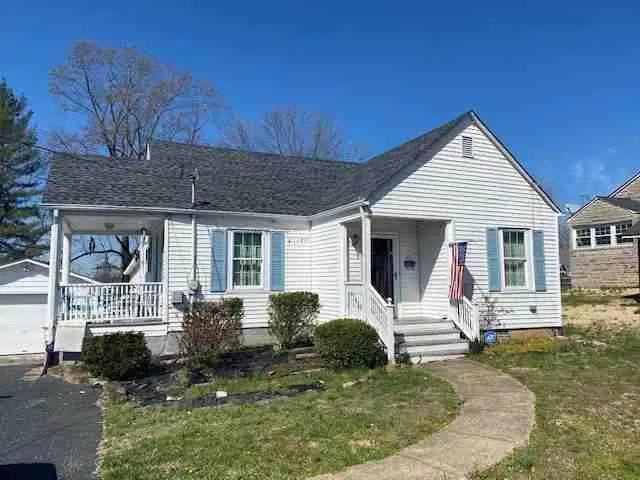
811 High St · Albany, KY
Flood risk 1/10 · Minimal
- FEMA flood zone
- X (unshaded)
- Chance of flooding over 30 yrs
- 0.0%
- Est. flood insurance / yr
- $507 – $1,088
Fire risk 6/10 · Moderate
- Est. fire insurance / yr
- $839 – $1,559
Heat risk 5/10 · Moderate
- Hot days now (above 103°F)
- 7 days/yr
- Hot days in 30 yrs
- 21 days/yr
Wind risk 3/10 · Minor
- Chance of severe wind over 30 yrs
- 5.0%
Air-quality risk 1/10 · Minimal
- Unhealthy air days now
- 0 days/yr
- Unhealthy air days in 30 yrs
- 0 days/yr
Risk factors via First Street. Map © Google.
Why this score? — see what drove the D grade
The composite is a weighted blend of 9 inputs, each scored 0–100. Each bar is that input's sub-score; the figure is the points it added to the 100-point composite (weight × sub-score).
- Cash flow +13.8/30.0
- ARV discount +7.5/15.0
- DSCR +4.2/10.0
- 1% rule +3.9/10.0
- Livability +3.5/5.0
- Rent growth +2.5/5.0
- Condition / age +2.5/5.0
- Schools +2.2/10.0
- Appreciation +0.3/10.0
$122,900
🖨 Deal sheet (PDF) 📄 Offer letter ✓ Due diligence
Listing remarks
Charming home in Albany city limits is PRICED WELL UNDER last appraised value. This 3 bedroom/2 bath home is conveniently located near the square, grocery stores, hospital and medical offices in Albany. It boasts a spacious living area and a huge primary suite with a large closet and an en suite bathroom with ample storage. The finished attic area offers additional space that would be great for another bedroom or flex/multipurpose room. The home also features a basement, detached garage and two outbuildings.
Key facts
- En suite bathroom
- Finished attic area
- Huge primary suite
Tags
Property features AI
Exterior
- Parking: Detached paved parking; 1 parking space (open parking)
- Utilities: Public water; Public sewer; Electric service with circuit breakers; No natural gas available
- Home design: Single-family residence, site-built; One level
- Construction: Frame construction with vinyl siding; Shingle roof
- Exterior features: Covered, enclosed porch; Patio; Spa / hot tub (bath style)
Interior
- Kitchen: Dishwasher; Refrigerator; Electric range; Microwave; Electric water heater
- Bedrooms: 3 bedrooms on the main level
- Flooring: Hardwood; Vinyl
- Bathrooms: 2 full bathrooms
- Heating & cooling: Heat pump (electric) heating; Central air conditioning
- Interior features: Master suite on the main level; Basement; Electric fireplace
- Laundry & utility: Washer and dryer (main level laundry)
Neighborhood map
What this means for you Summary
Snapshot
- This is a 3-bed/1.0-bath single-family listed at $123k.
Deal economics
- At list price, monthly cash flow is $11 ($133/yr) — positive.
- The deal already cash-flows at list — no discount required.
- To meet the 1% rule (rent ≥ 1% of price), the offer needs to be $109k (11.4% below list).
- Recommended offer: $109k (11.4% below list) — sets the bar for 1% rule.
- Cap rate 6.4% vs local median 2.3% in Albany — top-decile yield for the area; either an underpriced asset or a hidden risk that comps aren't pricing in. Stress-test before assuming the spread holds.
Location & tenants
- Location reads 69/100 on livability (#172 in KY) — a middle-class / working-renter tenant base. Strengths: cost of living A+, health & safety A+, crime A; Watch: schools F, amenities F, commute F.
- Clinton County (rural): math 21% / reading 33% proficiency, ranked #141 of 165 in KY (top 86%) — low school quality limits family demand, transient renter base, plan for 1-2y turnover.
- Market conditions: 67 active listings in the ZIP.
Forward outlook
- Local home prices are declining (-3.0%/yr); year-one equity from $850 of loan paydown is wiped out by about $4k of value loss. Plan a longer hold.
- Clinton County population projected to shrink 8% by 2050 — rents likely to lag national; underwrite the cash flow, not the appreciation.
Negotiation context
- It's been on market 24 days — a 2% lower offer ($121k) is reasonable based on typical stale-listing flexibility.
- Current owner paid $75k; list at $123k implies a 64% gain — meaningful room to come down on a strong offer.
Risks & watch-outs
- Watch-outs: built in 1942 — expect roof / HVAC / electrical / plumbing capex.
- Climate carrying-cost: major wildfire risk; extreme-heat days projected 7→21/yr by 2055 (HVAC capex compounding) — expect insurance premiums to compound above CPI over the hold.
Questions for the listing agent
- Built in 1942 — when were the roof, HVAC, electrical panel, plumbing, and water heater last replaced?
- Is there a deadline driving the sale (1031 exchange, divorce, estate, relocation)? That informs how much negotiation room exists.
- Schools are F-rated, which usually means shorter tenancies and higher turnover. Who's the typical renter profile here, and what's been the actual vacancy rate?
- The area grade is low — what's the realistic commute time and amenity access for the typical tenant pool here? Any planned neighborhood developments (good or bad) we should know about?
- What's the average days-on-market for RENTAL listings here right now (not sales)? A rising rental-DOM trend means longer vacancies and softer asking-rent achievability than the comps imply.
- What's the recent tenant-quality profile in this submarket — average credit score on applications, eviction rate, late-payment / NSF rate, and stable-employment percentage? A property-management company in the area should have these aggregated.
- How much new for-sale + rental construction is in the pipeline within 1–3 miles? Heavy new supply typically softens prices + rents 12–24 months out; constrained supply supports both.
Investment metrics
- 1% rule
- 0.89% ✗
- Cap rate
- 6.40%
- Cash-on-cash
- 0.39%
- DSCR
- 1.02
- GRM
- 9.4
CMA / ARV
- ARV (on-the-fly)
- $377,774
- Comps found
- 1
Show comp detail 1 sale within ~0.75 mi
| Address | Dist | Beds/Ba | Sqft | Sold | Price | $/sf | Match |
|---|---|---|---|---|---|---|---|
| 673 High Ridge Ln | 0.10mi | 2/1.0 (-1) | 1,300 (-7%) | 12mo | $352,000 | $271 | 70 |
Match score weights: distance 35% · size 25% · config 20% · recency 20%. Top-matched comps best support the ARV.
Projected returns pro-forma
-3.0% appreciation · 3.0% rent growth · sell at horizon
- IRR
- -15.7%
- Equity multiple
- 0.44×
- Total profit
- $-19,195
- Equity at exit
- $18,325
- IRR
- -7.2%
- Equity multiple
- 0.54×
- Total profit
- $-15,741
- Equity at exit
- $10,626
Cash invested: $34,412 (down + closing). Projections, not guarantees.
Landlord ↔ Tenant lean methodology
- Overall (STATE)
- 83 Strongly Landlord-Friendly
- State Kentucky
- 83 Strongly Landlord-Friendly · R+16
- County
- — inherits STATE
- City
- — inherits STATE
ZIP-level market 42602
- Home prices YoY
- -4.4%
- Active inventory
- 67
- Price-to-rent
- 9.4×
Monthly cashflow live
- Estimated rent
- $1,089 medium interval (Pro) →
- Mortgage (P&I)
- −$645
- Tax est. 1.5%
- −$154 /mo · $1,844/yr
- Insurance
- −$51
- HOA
- −$0
- Vacancy / Maint / Mgmt
- −$229
- Net cashflow
- $11
Break-even live
Sensitivity live
| Price | -10% $96 | -5% $54 | +0% $11 | +5% $-31 | +10% $-74 |
|---|---|---|---|---|---|
| Rent | -10% $-75 | -5% $-32 | +0% $11 | +5% $54 | +10% $97 |
| Rate | -1.0pp $73 | -0.5pp $42 | base $11 | +0.5pp $-21 | +1.0pp $-53 |
UW: 25.0% down · 7.5% · 30yr · 1.5% tax · 5.0% vac · 8.0% maint · 8.0% mgmt
Financing live
Cash to close
- Down payment
- $30,725
- Closing costs
- $3,687
- Reserves months
- —
- Total cash needed
- —
Loan-product check · same deal, 3 products live
Conventional
25% down · 7.5% · 30yr
- Down + closing
- —
- Monthly P&I
- —
- Monthly cashflow
- —
- DSCR
- —
- Eligible?
- —
Personal DTI + credit; lowest rate.
DSCR
20% down · 8.5% · 30yr
- Down + closing
- —
- Monthly P&I
- —
- Monthly cashflow
- —
- DSCR
- —
- Eligible?
- —
No personal income docs; deal must DSCR.
Hard money
10% down · 12.0% · 12mo
- Down + closing
- —
- Monthly P&I
- —
- Monthly cashflow
- —
- DSCR
- —
- Eligible?
- —
Short-term bridge; refi at stabilization.
Listing history 18 events
-
2026-06-21statusdays on market $122,900 Pending 24 DOM
-
2026-06-18days on market $122,900 Active 23 DOM
-
2026-06-17days on market $122,900 Active 22 DOM
-
2026-06-16days on market $122,900 Active 21 DOM
-
2026-06-15days on market $122,900 Active 20 DOM
-
2026-06-13days on market $122,900 Active 18 DOM
-
2026-06-12days on market $122,900 Active 17 DOM
-
2026-06-09days on market $122,900 Active 14 DOM
-
2026-06-08days on market $122,900 Active 13 DOM
-
2026-06-07days on market $122,900 Active 12 DOM
-
2026-06-07days on market $122,900 Active 11 DOM
-
2026-06-04days on market $122,900 Active 8 DOM
-
2026-06-02days on market $122,900 Active 7 DOM
-
2026-06-01days on market $122,900 Active 6 DOM
-
2026-05-31days on market $122,900 Active 5 DOM
-
2026-05-31days on market $122,900 Active 4 DOM
-
2026-05-26$122,900 Active
-
2019-12-27soldstatus $75,000
ⓘ Source: listings_history table (triggers on properties + properties_extension) + one-shot
backfill from property_details.listing_events for pre-trigger history.
Climate risk First Street
- Flood 1/10 Low FEMA zone X (unshaded) · 0% chance over 30 yrs
- Wildfire 6/10 Major
- Heat 5/10 Major 7 d/yr ≥103°F today · 21 d/yr by 30 yrs out
- Wind 3/10 Moderate 5% chance of damaging wind over 30 yrs
- Air quality 1/10 Low 0 unhealthy d/yr today · 0 by 30 yrs out
Nearby sold comps map
Loading sold comps map…
Walkable amenities ~0.75 mi
Loading nearby amenities…
Taxation est. · year 1
- Rental income
- $13,069
- − Mortgage interest
- −$6,884
- − Property taxes
- −$1,844
- − Insurance
- −$614
- − Repairs & maintenance
- −$1,046
- − Management
- −$1,046
- − Depreciation
- −$3,575
- Taxable loss
- −$1,939
- Est. tax savings @ 24.0%
- +$465
- After-tax cash flow
- $598/yr
For passive investors: Depreciation is non-cash, so a rental often shows a tax loss while cash-flowing — sheltering income. Rental losses are passive: they offset passive income freely, and up to $25,000/yr can offset ordinary (W-2) income if you actively participate and your MAGI is under $100k (phasing out to $0 by $150k); unused losses carry forward. On sale, claimed depreciation is recaptured at up to 25%, and gains may owe capital-gains tax (a 1031 exchange can defer both). Figures are a year-1 estimate at your 24.0% rate — not tax advice; consult a CPA.
Schools (NCES district)
- District
- Clinton County
- NCES district ID
- 2101260
- Math proficiency
- 21% ▼ -9.00%
- Reading proficiency
- 33% ▼ -13.00%
- Median HH income
- $27,926
- Composite
- 21.56/100
- National rank
- #8310
- State rank
- #141 of 165 in KY
Livability — Albany
- Score
- 69/100
- State rank
- #172
- US rank
- #8690
Category grades
Schools grade is shown separately in the Schools card above.
Census & demographics
- Census place
- Albany, KY
- Population (ZIP)
- 9,138
Population outlook (Clinton County) Hauer SSP2
- Today (2025)
- 9,900 people
- By 2030
- 9,718 · -1.8%
- By 2040
- 9,381 · -5.2%
- By 2050
- 9,058 · -8.5%
- By 2075
- 8,540 · -13.7%
- By 2100
- 8,045 · -18.7%
Race, ethnicity, and origin ACS 2023
- Neighborhood character
- Predominantly White (94%)
- Race & ethnicity
- White 94% Hispanic / Latino 3% Two or more races 3%
- Common ancestry
- Serbian 3% Slovak 1% Lithuanian 1%
- Foreign-born
- 1% · Canada
- Languages at home
- 99% English-only · Spanish 1%
Political lean MEDSL · Clinton
- 2024 margin
- Solid R (+76.4) · D 11.2% · R 87.6% · Other 1.1%
- 2008→2024 swing
- -13.9pp toward R · 2008: -62.4pp · 2024: -76.4pp
- All cycles
- 2024: R+76.4 2020: R+74.5 2016: R+73.2 2012: R+64.1 2008: R+62.4
Not yet ingested
- Civics
- —
Market trends
- HPI YoY
- ▼ -9.48%
- Current HPI
- 205.6426
- Rent YoY
- —
- Metro
- —
- State GDP YoY
- ▲ 1.81%
- F500 in state
- 4
Industry mix (Fortune 500 HQ in KY)
| Industry | F500 HQs | Revenue |
|---|---|---|
| Healthcare | 1 | $118B |
|
||
| Food / Beverage | 1 | $7B |
|
||
Price history
+63.9% since first listed2 events — show timeline
- 2026-05-26 Listed $122,900 UCMLS
- 2019-12-27 Sold (Public Records) $75,000 Public Records
Property tax history
+20.8%/yrLatest (2024): $238 · -0.8% YoY. Source: county tax records.
Cash-flow waterfall
monthlySold comps — $/sqft
last 12 mo · ≤1 miLoading sold comps…