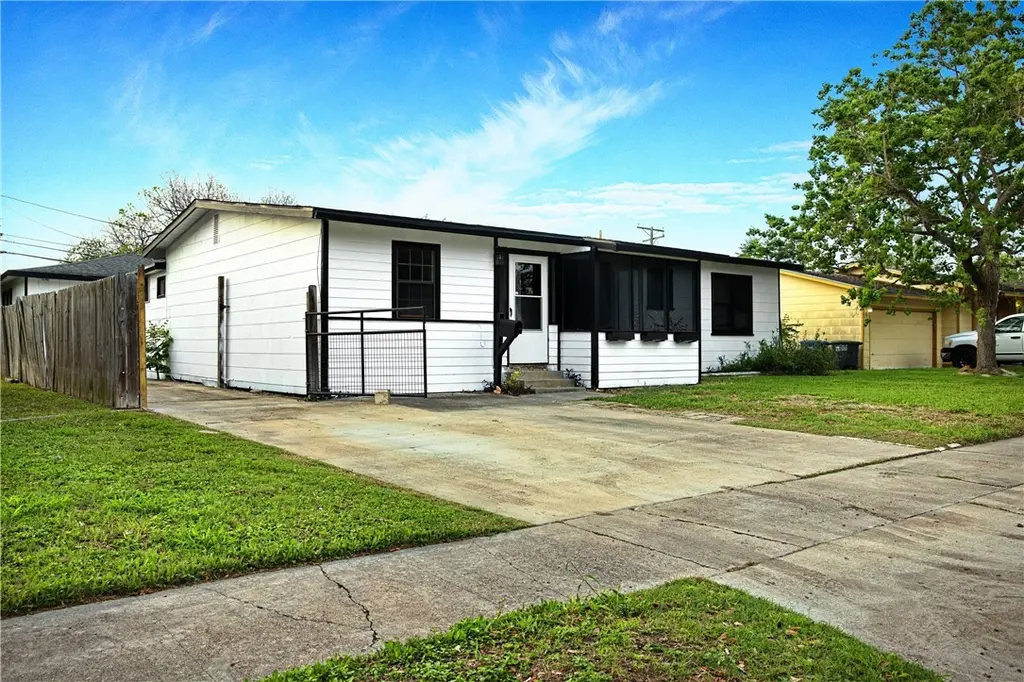
4722 Dody St · Corpus Christi, TX
Flood risk 7/10 · Major
- FEMA flood zone
- X (unshaded)
- Chance of flooding over 30 yrs
- 0.99%
- Est. flood insurance / yr
- $507 – $1,088
Fire risk 1/10 · Minimal
- Est. fire insurance / yr
- $1,222 – $2,270
Heat risk 10/10 · Severe
- Hot days now (above 107°F)
- 7 days/yr
- Hot days in 30 yrs
- 26 days/yr
Wind risk 9/10 · Severe
- Chance of severe wind over 30 yrs
- 99.0%
Air-quality risk 1/10 · Minimal
- Unhealthy air days now
- 0 days/yr
- Unhealthy air days in 30 yrs
- 0 days/yr
Risk factors via First Street. Map © Google.
Why this score? — see what drove the D grade
The composite is a weighted blend of 9 inputs, each scored 0–100. Each bar is that input's sub-score; the figure is the points it added to the 100-point composite (weight × sub-score).
- Cash flow +13.7/30.0
- ARV discount +7.6/15.0
- Rent growth +4.5/5.0
- DSCR +4.1/10.0
- Livability +3.9/5.0
- 1% rule +3.7/10.0
- Schools +2.8/10.0
- Condition / age +2.5/5.0
- Appreciation +0.0/10.0
$219,900
🖨 Deal sheet (PDF) 📄 Offer letter ✓ Due diligence
Listing remarks MLS
Well maintained, recently updated home, sits on a large lot with green St. Augustine grass. Split floor plan, 3 bedrooms on one side and master on other. Laminate flooring in formal living area and 3 bedrooms. Large second living area in the back of house, perfect for entertaining! Generous back yard with a huge 10ft ceiling garage and built in workshop with two more bays and electric! Tons of storage space, recent A/C recent fixtures, gas stove cook top and centrally located. Screened and covered front porch, excellent for a warm cup of coffee in the morning!
Key facts
- Front screened porch
- Spacious great room
- Open-concept kitchen
Tags
Neighborhood map
What this means for you Summary
Snapshot
- This is a 4-bed/2.0-bath single-family listed at $220k.
Deal economics
- At list price, monthly cash flow is $-52 ($-618/yr) — negative.
- To cash-flow at today's rent, offer at most $211k (4.1% below list).
- To meet the 1% rule (rent ≥ 1% of price), the offer needs to be $192k (12.8% below list).
- Recommended offer: $192k (12.8% below list) — sets the bar for 1% rule.
- Cap rate 6.4% vs local median 3.6% in Corpus Christi — top-decile yield for the area; either an underpriced asset or a hidden risk that comps aren't pricing in. Stress-test before assuming the spread holds.
Location & tenants
- Location reads 78/100 on livability (#66 in TX, #2,404 nationally) — a middle-class / working-renter tenant base. Strengths: commute A+, cost of living A+, housing A+; Watch: crime F.
- Corpus Christi ISD (urban): math 31% / reading 35% proficiency, ranked #562 of 826 in TX (top 68%) — families likely to look elsewhere, expect single-tenant / working-renter base with shorter leases; 63% free/reduced lunch — lower-income household profile, screen leases tightly.
- Market conditions: Rents rising fast (+7.9%/yr); 142 active listings in the ZIP; 21 comparable units currently listed for rent nearby; rentals at typical pace (median 14d on market — plan ~3-4 weeks tenant-placement turnaround); 1,397 units permitted in Nueces County in 2024 (47 in 5+ unit buildings).
- This rent runs 40% of the median local income ($58k/yr) — at the standard rent-burdened threshold; future hikes will face affordability resistance.
Forward outlook
- Local home prices are declining (-3.0%/yr); year-one equity from $2k of loan paydown is wiped out by about $7k of value loss. Plan a longer hold.
- Nueces County population projected at +36% by 2050 — long-run rental-demand tailwind backs the buy-and-hold thesis.
Negotiation context
- Only 9 days on market — expect competitive offers; lowballing is unlikely to land.
- 2 sale attempts since 11y ago with the ask held roughly flat each time — persistent listings suggest the price (not the market) is what's stuck; bring a comps-based counter.
- Current owner paid $28k; list at $220k implies a 685% gain — meaningful room to come down on a strong offer.
Risks & watch-outs
- Watch-outs: flood insurance adds $66/mo; built in 1955 — expect roof / HVAC / electrical / plumbing capex.
- Climate carrying-cost: major flood risk; severe wind risk, 99% chance of damaging wind over 30y; extreme-heat days projected 7→26/yr by 2055 (HVAC capex compounding) — expect insurance premiums to compound above CPI over the hold.
Questions for the listing agent
- What do current leases actually rent for vs. the listed asking? Can we see a recent rent roll and the last 12 months of T-12 income?
- Built in 1955 — when were the roof, HVAC, electrical panel, plumbing, and water heater last replaced?
- What's the actual annual flood-insurance premium (NFIP or private), and is the property in a SFHA with mandatory coverage?
- Is there a deadline driving the sale (1031 exchange, divorce, estate, relocation)? That informs how much negotiation room exists.
- Crime grade is F in this area — have there been break-ins, vandalism, or insurance claims at this property in the last 3 years? What carrier currently insures it and at what premium?
- The area grade is low — what's the realistic commute time and amenity access for the typical tenant pool here? Any planned neighborhood developments (good or bad) we should know about?
- What's the average days-on-market for RENTAL listings here right now (not sales)? A rising rental-DOM trend means longer vacancies and softer asking-rent achievability than the comps imply.
- What's the recent tenant-quality profile in this submarket — average credit score on applications, eviction rate, late-payment / NSF rate, and stable-employment percentage? A property-management company in the area should have these aggregated.
- How much new for-sale + rental construction is in the pipeline within 1–3 miles? Heavy new supply typically softens prices + rents 12–24 months out; constrained supply supports both.
Investment metrics
- 1% rule
- 0.87% ✗
- Cap rate
- 6.37%
- Cash-on-cash
- 0.29%
- DSCR
- 1.01
- GRM
- 9.6
CMA / ARV
- ARV (on-the-fly)
- $220,433
- Comps found
- 12
Show comp detail 12 sales within ~0.75 mi
| Address | Dist | Beds/Ba | Sqft | Sold | Price | $/sf | Match |
|---|---|---|---|---|---|---|---|
| 4722 Dody St | 0.00mi | 4/2.0 | 1,609 (0%) | 1mo | $219,900 | $137 | 99 |
| 4822 Trinity Dr | 0.34mi | 4/2.0 | 1,640 (+2%) | 4mo | $249,500 | $152 | 78 |
| 4914 Nell St | 0.27mi | 4/3.0 | 1,655 (+3%) | 4mo | $249,500 | $151 | 75 |
| 4513 Driftwood Pl | 0.31mi | 3/1.5 (-1) | 1,712 (+6%) | 2mo | $229,000 | $134 | 66 |
| 4818 Marion | 0.18mi | 3/1.5 (-1) | 1,435 (-11%) | 1mo | $119,999 | $84 | 66 |
| 4513 Totton Dr | 0.43mi | 3/2.0 (-1) | 1,694 (+5%) | 2mo | $165,000 | $97 | 64 |
| 4425 Marie St | 0.47mi | 4/2.0 | 1,717 (+7%) | 6mo | $279,000 | $162 | 62 |
| 4829 Alice St | 0.14mi | 3/2.0 (-1) | 1,384 (-14%) | 6mo | $174,900 | $126 | 60 |
| 4313 Driftwood Pl | 0.59mi | 4/2.0 | 1,522 (-5%) | 5mo | $250,000 | $164 | 59 |
| 4614 Arlene Dr | 0.52mi | 3/1.5 (-1) | 1,677 (+4%) | 6mo | $179,000 | $107 | 57 |
| 4213 Dolphin Pl | 0.69mi | 3/2.0 (-1) | 1,518 (-6%) | 4mo | $275,000 | $181 | 50 |
| 3702 Lincoln St | 0.62mi | 4/2.0 | 1,433 (-11%) | 4mo | $179,000 | $125 | 50 |
Match score weights: distance 35% · size 25% · config 20% · recency 20%. Top-matched comps best support the ARV.
Projected returns pro-forma
-3.0% appreciation · 7.91% rent growth · sell at horizon
- IRR
- -12.4%
- Equity multiple
- 0.53×
- Total profit
- $-28,912
- Equity at exit
- $32,788
- IRR
- 3.0%
- Equity multiple
- 1.26×
- Total profit
- $16,010
- Equity at exit
- $19,013
Cash invested: $61,572 (down + closing). Projections, not guarantees.
Landlord ↔ Tenant lean methodology
- Overall (STATE)
- 87 Strongly Landlord-Friendly
- State Texas
- 87 Strongly Landlord-Friendly · R+5
- County
- — inherits STATE
- City
- — inherits STATE
ZIP-level market 78411
- Rents YoY
- 7.9%
- Active inventory
- 142
- Price-to-rent
- 9.6×
Monthly cashflow live
- Estimated rent
- $1,918 high interval (Pro) →
- Mortgage (P&I)
- −$1,153
- Tax from tax record
- −$255 /mo · $3,065/yr
- Insurance
- −$92
- Flood insurance flood zone
- −$66 /mo · $798/yr
- HOA
- −$0
- Vacancy / Maint / Mgmt
- −$403
- Net cashflow
- $-52
Break-even live
Sensitivity live
| Price | -10% $73 | -5% $11 | +0% $-52 | +5% $-114 | +10% $-176 |
|---|---|---|---|---|---|
| Rent | -10% $-203 | -5% $-127 | +0% $-52 | +5% $24 | +10% $100 |
| Rate | -1.0pp $59 | -0.5pp $4 | base $-52 | +0.5pp $-108 | +1.0pp $-166 |
UW: 25.0% down · 7.5% · 30yr · 1.5% tax · 5.0% vac · 8.0% maint · 8.0% mgmt
Financing live
Cash to close
- Down payment
- $54,975
- Closing costs
- $6,597
- Reserves months
- —
- Total cash needed
- —
Loan-product check · same deal, 3 products live
Conventional
25% down · 7.5% · 30yr
- Down + closing
- —
- Monthly P&I
- —
- Monthly cashflow
- —
- DSCR
- —
- Eligible?
- —
Personal DTI + credit; lowest rate.
DSCR
20% down · 8.5% · 30yr
- Down + closing
- —
- Monthly P&I
- —
- Monthly cashflow
- —
- DSCR
- —
- Eligible?
- —
No personal income docs; deal must DSCR.
Hard money
10% down · 12.0% · 12mo
- Down + closing
- —
- Monthly P&I
- —
- Monthly cashflow
- —
- DSCR
- —
- Eligible?
- —
Short-term bridge; refi at stabilization.
Rent comps 21 comps
| Address | Beds | Baths | Sqft | Rent | $/sqft | DOM | Units | Dist |
|---|---|---|---|---|---|---|---|---|
| 4717 Edith St Unit 1268436P Corpus Christi, TX | 4.0 | 2.0 | 1496 | $4,708 | $3.15 | 44d | 1 | 0.05mi |
| 4830 French Dr Corpus Christi, TX | 3.0 | 2.0 | 1299 | $1,700 | $1.31 | 14d | 1 | 0.31mi |
| 4634 Weir Dr Corpus Christi, TX | 3.0 | 2.0 | 1540 | $1,800 | $1.17 | 44d | 1 | 0.38mi |
| 3738 Marion St Corpus Christi, TX | 3.0 | 1.0 | 1100 | $1,295 | $1.18 | 44d | 1 | 0.51mi |
| 4845 Concord St Corpus Christi, TX | 4.0 | 2.0 | 1437 | $1,750 | $1.22 | 14d | 1 | 0.59mi |
| 4006 Panama Dr Corpus Christi, TX | 3.0 | 2.0 | 1816 | $1,949 | $1.07 | 21d | 1 | 0.85mi |
| 4110 Grossman Dr Unit B Corpus Christi, TX | 3.0 | 2.0 | 1228 | $1,500 | $1.22 | 44d | 1 | 0.89mi |
| 4013 Kingston Dr Corpus Christi, TX | 3.0 | 2.0 | 1451 | $2,500 | $1.72 | 44d | 1 | 0.92mi |
| 929 Dolphin Pl Corpus Christi, TX | 3.0 | 2.0 | 1508 | $2,095 | $1.39 | 21d | 1 | 0.95mi |
| 4402 Sutton Ln Corpus Christi, TX | 4.0 | 2.0 | 1850 | $2,100 | $1.14 | 14d | 1 | 0.96mi |
| 4801 Lansdown Dr Corpus Christi, TX | 3.0 | 2.0 | 1242 | $1,525 | $1.23 | 14d | 1 | 1.02mi |
| 5002 Bevly Dr Unit A Corpus Christi, TX | 3.0 | 2.0 | 1400 | $1,499 | $1.07 | 21d | 1 | 1.06mi |
| 4117 Monaco Dr Corpus Christi, TX | 5.0 | 2.0 | 1483 | $2,100 | $1.42 | 14d | 1 | 1.07mi |
| 625 Catalina Pl Corpus Christi, TX | 3.0 | 2.0 | 1750 | $2,100 | $1.20 | 14d | 1 | 1.17mi |
| 722 Collingswood Dr Corpus Christi, TX | 3.0 | 1.5 | 1318 | $1,595 | $1.21 | 14d | 1 | 1.17mi |
| 1410 Ray Dr Corpus Christi, TX | 3.0 | 1.0 | 1224 | $1,600 | $1.31 | 14d | 1 | 1.29mi |
| 749 Ashland Dr Corpus Christi, TX | 3.0 | 1.0 | 1179 | $1,550 | $1.31 | 44d | 1 | 1.30mi |
| 4422 S Alameda St Corpus Christi, TX | 1.0–3.0 | 1.0–2.0 | 820 | $1,000 | $1.22 | 14d | 1 | 1.43mi |
| 4114 Cork Dr Corpus Christi, TX | 3.0 | 2.0 | 1296 | $1,595 | $1.23 | 14d | 1 | 1.46mi |
| 5802 Everhart Rd Corpus Christi, TX | 1.0–3.0 | 1.0–2.0 | 926 | $1,570 | $1.69 | 14d | 16 | 1.47mi |
| 1066 Burkshire Dr Corpus Christi, TX | 3.0 | 2.0 | 2063 | $1,900 | $0.92 | 45d | 1 | 1.49mi |
Listing history 11 events
-
2026-05-05status Pending
-
2026-04-25historical
-
2026-04-16$219,900 Active
-
2024-08-28soldstatus
-
2022-11-15soldstatus
-
2022-11-15soldstatus
-
2015-06-09soldstatus
-
2015-06-08soldstatus 566-char remark
Show marketing remark (566 chars)
Well maintained, recently updated home, sits on a large lot with green St. Augustine grass. Split floor plan, 3 bedrooms on one side and master on other. Laminate flooring in formal living area and 3 bedrooms. Large second living area in the back of house, perfect for entertaining! Generous back yard with a huge 10ft ceiling garage and built in workshop with two more bays and electric! Tons of storage space, recent A/C recent fixtures, gas stove cook top and centrally located. Screened and covered front porch, excellent for a warm cup of coffee in the morning!
-
2015-02-13$123,900 566-char remark
Show marketing remark (566 chars)
Well maintained, recently updated home, sits on a large lot with green St. Augustine grass. Split floor plan, 3 bedrooms on one side and master on other. Laminate flooring in formal living area and 3 bedrooms. Large second living area in the back of house, perfect for entertaining! Generous back yard with a huge 10ft ceiling garage and built in workshop with two more bays and electric! Tons of storage space, recent A/C recent fixtures, gas stove cook top and centrally located. Screened and covered front porch, excellent for a warm cup of coffee in the morning!
-
2013-04-02soldstatus
-
1992-03-16soldstatus $28,000
ⓘ Source: listings_history table (triggers on properties + properties_extension) + one-shot
backfill from property_details.listing_events for pre-trigger history.
Tax reassessment forecast TX · Resets to sale price
- Current annual tax
- $3,065 · $255/mo
- Projected year-2 tax
- $4,024 · $335/mo
- Expected delta
- +$959/yr (+$80/mo · 31.3%)
ⓘ Screening estimate from a state-policy table — verify with the county assessor before closing.
Climate risk First Street
- Flood 7/10 Severe FEMA zone X (unshaded) · 99% chance over 30 yrs
- Wildfire 1/10 Low
- Heat 10/10 Extreme 7 d/yr ≥107°F today · 26 d/yr by 30 yrs out
- Wind 9/10 Extreme 99% chance of damaging wind over 30 yrs
- Air quality 1/10 Low 0 unhealthy d/yr today · 0 by 30 yrs out
Nearby sold comps map
Loading sold comps map…
Walkable amenities ~0.75 mi
Loading nearby amenities…
Taxation est. · year 1
- Rental income
- $23,015
- − Mortgage interest
- −$12,318
- − Property taxes
- −$3,065
- − Insurance
- −$1,897
- − Repairs & maintenance
- −$1,841
- − Management
- −$1,841
- − Depreciation
- −$6,397
- Taxable loss
- −$4,344
- Est. tax savings @ 24.0%
- +$1,043
- After-tax cash flow
- $424/yr
For passive investors: Depreciation is non-cash, so a rental often shows a tax loss while cash-flowing — sheltering income. Rental losses are passive: they offset passive income freely, and up to $25,000/yr can offset ordinary (W-2) income if you actively participate and your MAGI is under $100k (phasing out to $0 by $150k); unused losses carry forward. On sale, claimed depreciation is recaptured at up to 25%, and gains may owe capital-gains tax (a 1031 exchange can defer both). Figures are a year-1 estimate at your 24.0% rate — not tax advice; consult a CPA.
Schools (NCES district)
- District
- Corpus Christi ISD
- NCES district ID
- 4815270
- Math proficiency
- 31% ▼ -18.00%
- Reading proficiency
- 35% ▼ -7.00%
- Median HH income
- $45,672
- Composite
- 28.27/100
- National rank
- #6793
- State rank
- #562 of 826 in TX
Livability — Corpus Christi
- Score
- 78/100
- State rank
- #66
- US rank
- #2404
Category grades
Schools grade is shown separately in the Schools card above.
Census & demographics
- Census place
- Corpus Christi, TX
- County
- Nueces County · 296,836 people
- City population
- 296,836
- Metro
- Corpus Christi, TX
- Population (ZIP)
- 23,682
- Household income
- $57,742
- Rent vs Own
- Severe rent burden
- 1284.0
Population outlook (Nueces County) Hauer SSP2
- Today (2025)
- 418,037 people
- By 2030
- 447,123 · +7.0%
- By 2040
- 505,911 · +21.0%
- By 2050
- 567,522 · +35.8%
- By 2075
- 729,686 · +74.6%
- By 2100
- 847,087 · +102.6%
Race, ethnicity, and origin ACS 2023
- Neighborhood character
- Majority Hispanic (58%)
- Race & ethnicity
- Hispanic / Latino 58% White 35% Two or more races 29% Black 3% Asian 2%
- Hispanic origin (detail)
- Mexican 51%
- Common ancestry
- Slovak 2% Italian 1% Serbian 1%
- Foreign-born
- 6% · Canada
- Languages at home
- 75% English-only · Spanish 23% Tagalog/Filipino 1% Other Indo-European 1%
Political lean MEDSL · Nueces
- 2024 margin
- R (+11.5) · D 43.8% · R 55.3%
- 2008→2024 swing
- -7.1pp toward R · 2008: -4.4pp · 2024: -11.5pp
- All cycles
- 2024: R+11.5 2020: R+2.9 2016: R+1.5 2012: R+3.2 2008: R+4.4
Not yet ingested
- Civics
- —
Market trends
- HPI YoY
- ▼ -265.71%
- Current HPI
- 191.7201
- Rent YoY
- ▲ 7.91%
- Metro
- Corpus Christi, TX
- State GDP YoY
- ▲ 3.95%
- F500 in state
- 110
Industry mix (Fortune 500 HQ in TX)
| Industry | F500 HQs | Revenue |
|---|---|---|
| Energy | 16 | $1,198B |
|
||
| Technology | 5 | $198B |
|
||
| Engineering / Construction | 4 | $72B |
|
||
| Energy Services | 3 | $60B |
|
||
| Utilities | 3 | $41B |
|
||
| Healthcare | 2 | $330B |
|
||
Price history
+685.4% since first listed11 events — show timeline
- 2026-05-05 Pending — CBMLS
- 2026-04-25 Delisted — CBMLS
- 2026-04-16 Listed $219,900 CBMLS
- 2024-08-28 Sold (Public Records) — Public Records
- 2022-11-15 Sold (Public Records) — Public Records
- 2022-11-15 Sold (Public Records) — Public Records
- 2015-06-09 Sold (Public Records) — Public Records
- 2015-06-08 Sold (MLS) — CBMLS
- 2015-02-13 Listed $123,900 CBMLS
- 2013-04-02 Sold (Public Records) — Public Records
- 1992-03-16 Sold (Public Records) $28,000 Public Records
Property tax history
+1.0%/yrLatest (2025): $3,065 · -24.4% YoY. Source: county tax records.
Cash-flow waterfall
monthlySold comps — $/sqft
last 12 mo · ≤1 miLoading sold comps…