 Duplex
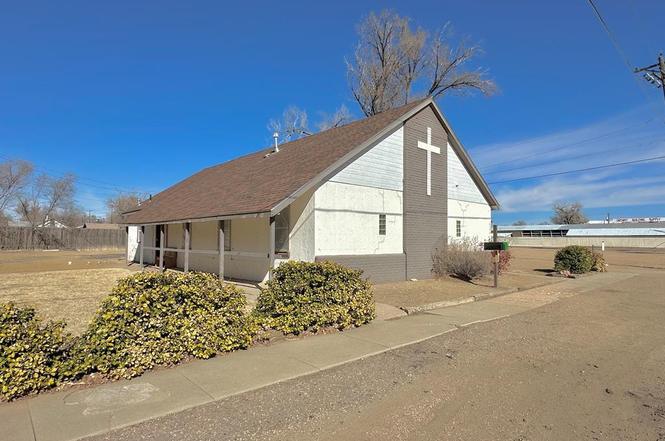
216 W 2nd St · Ordway, CO
Flood risk No data
- FEMA flood zone
- —
- Chance of flooding over 30 yrs
- —
- Est. flood insurance / yr
- —
Fire risk No data
- Est. fire insurance / yr
- —
Heat risk No data
- Hot days now (above threshold)
- —
- Hot days in 30 yrs
- —
Wind risk No data
- Chance of severe wind over 30 yrs
- —
Air-quality risk No data
- Unhealthy air days now
- —
- Unhealthy air days in 30 yrs
- —
Risk factors via First Street. Map © Google.
Why this score? — see what drove the B grade
The composite is a weighted blend of 9 inputs, each scored 0–100. Each bar is that input's sub-score; the figure is the points it added to the 100-point composite (weight × sub-score).
- Cash flow +30.0/30.0
- DSCR +10.0/10.0
- 1% rule +9.3/10.0
- ARV discount +7.5/15.0
- Appreciation +3.8/10.0
- Livability +3.1/5.0
- Rent growth +2.5/5.0
- Condition / age +2.5/5.0
- Schools +2.1/10.0
$145,000
🖨 Deal sheet 📄 Offer letter ✓ Due diligence
Multi-family units
County records classify this as Multi-Family (2-4 Unit). Listing-text estimate: 2 units. confirmed
Listing remarks
Check out this beautifully remodeled duplex with each unit offering 2 bedrooms and 1 full bathroom. Completely renovated in 2017, this property includes major upgrades such as PEX plumbing, forced heating and central air, updated roofing, new flooring throughout, and custom kitchen cabinets with modern countertops. Whether you're an investor searching for a solid income-producing property or a homeowner hoping to offset your mortgage with rental income, this property offers both flexibility and affordability. This move-in ready duplex could be the investment opportunity you've been waiting for.
Key facts
- Forced heating
- Remodeled duplex
- Updated roofing
Tags
Property features AI
Finance
- HOA & community: No association amenities
Exterior
- Parking: No garage
- Utilities: Public water; Public sewer
- Home design: Duplex (residential income property)
- Construction: Stucco exterior
- Exterior features: Composition roof; 100 x 71 lot dimensions; Lot of approximately 0.163 acre; Zoned R-1
Interior
- Kitchen: Range
- Bedrooms: Two 2-bedroom units
- Bathrooms: Two full bathrooms (one per unit)
- Heating & cooling: Forced air heating
- Interior features: Gas log fireplace; Range
- Laundry & utility: In-unit laundry with washer hookup; Dryer
Neighborhood map
What this means for you Summary
Snapshot
- This is a 2 × 2-bed/1.0-bath units multifamily listed at $145k.
Deal economics
- At list price, monthly cash flow is $752 ($9k/yr) — positive. Per door: $376/mo.
- The deal already cash-flows at list — no discount required.
- Meets the 1% rule at list price ($2k rent vs $145k).
- Recommended offer: $132k (9.0% below list) — sets the bar for market timing.
Location & tenants
- Location reads 61/100 on livability (#233 in CO) — a middle-class / working-renter tenant base. Strengths: cost of living A+, housing A+; Watch: health & safety C-, schools F, amenities F.
- Crowley County School District No. Re-1-J (rural): math 16% / reading 28% proficiency, ranked #150 of 176 in CO (top 85%) — low school quality limits family demand, transient renter base, plan for 1-2y turnover; 62% free/reduced lunch — lower-income household profile, screen leases tightly.
- Market conditions: 29 active listings in the ZIP; 4 units permitted in Crowley County in 2024 (0 in 5+ unit buildings).
Forward outlook
- Local home prices are declining (-2.4%/yr); year-one equity from $1k of loan paydown is wiped out by about $4k of value loss. Plan a longer hold.
- Crowley County population projected at +14% by 2050 — modest demand growth; plan on rents tracking national, not racing it.
- At projected returns (-2.4% appreciation + 3.0% rent growth), your $41k cash investment doubles in ~6 years — after that, you're playing with house money.
Negotiation context
- It's been on market 104 days — a 9% lower offer ($132k) is reasonable based on typical stale-listing flexibility.
- 2 sale attempts with the ask held roughly flat each time — persistent listings suggest the price (not the market) is what's stuck; bring a comps-based counter.
Risks & watch-outs
- Watch-outs: built in 1914 — expect roof / HVAC / electrical / plumbing capex.
Questions for the listing agent
- It's been on market 104 days. Have you received any prior offers? Is the seller open to a 9% concession, seller financing, or rate buy-down credit?
- Can we see the unit-by-unit rent roll, current vacancy, and any below-market leases? What's the average tenancy length?
- What capital expenditures (roof, boiler, parking lot, exteriors) have been made in the last 5 years, and what's planned in the next 2?
- Built in 1914 — when were the roof, HVAC, electrical panel, plumbing, and water heater last replaced?
- Why hasn't it sold? Are there any deal-killer items the seller is aware of (foundation, flood, title, zoning, code violations)?
- Is there a deadline driving the sale (1031 exchange, divorce, estate, relocation)? That informs how much negotiation room exists.
- Schools are F-rated, which usually means shorter tenancies and higher turnover. Who's the typical renter profile here, and what's been the actual vacancy rate?
- What's the average days-on-market for RENTAL listings here right now (not sales)? A rising rental-DOM trend means longer vacancies and softer asking-rent achievability than the comps imply.
- What's the recent tenant-quality profile in this submarket — average credit score on applications, eviction rate, late-payment / NSF rate, and stable-employment percentage? A property-management company in the area should have these aggregated.
- How much new apartment / multifamily construction is in the pipeline within 1–3 miles? Heavy new supply (>2% of stock underway) typically softens rents 12–24 months out; light construction supports rent growth.
Investment metrics
- 1% rule
- 1.43% ✓
- Cap rate
- 12.51%
- Cash-on-cash
- 22.21%
- DSCR
- 1.99
- GRM
- 5.8
CMA / ARV
No comps found within radius.
Projected returns pro-forma
-2.42% appreciation · 3.0% rent growth · sell at horizon
- IRR
- 16.4%
- Equity multiple
- 1.69×
- Total profit
- $27,853
- Equity at exit
- $25,369
- IRR
- 24.1%
- Equity multiple
- 3.19×
- Total profit
- $88,802
- Equity at exit
- $19,073
Cash invested: $40,600 (down + closing). Projections, not guarantees.
Landlord ↔ Tenant lean methodology
- Overall (STATE)
- 38 Tenant-Leaning
- State Colorado
- 38 Tenant-Leaning · D+4
- County
- — inherits STATE
- City
- — inherits STATE
ZIP-level market 81063
- Home prices YoY
- -1.1%
- Active inventory
- 29
- Price-to-rent
- 11.6×
Monthly cashflow live
- Estimated rent
- $2,074 medium interval (Pro) →
- Mortgage (P&I)
- −$760
- Tax from tax record
- −$66 /mo · $794/yr
- Insurance
- −$60
- HOA
- −$0
- Vacancy / Maint / Mgmt
- −$436
- Net cashflow
- $752
Break-even live
2-unit breakdown (identical units grouped — click to expand)
| Units | Beds | Baths | Est. rent |
|---|---|---|---|
| 2× units | 2 | 1 | $2,074 |
| #1 | 2 | 1 | $1,037 |
| #2 | 2 | 1 | $1,037 |
| Total (2 units) | $2,074 | ||
UW: 25.0% down · 7.5% · 30yr · 1.5% tax · 5.0% vac · 8.0% maint · 8.0% mgmt
Financing live
Cash to close
- Down payment
- $36,250
- Closing costs
- $4,350
- Reserves months
- —
- Total cash needed
- —
Loan-product check · same deal, 3 products live
Conventional
25% down · 7.5% · 30yr
- Down + closing
- —
- Monthly P&I
- —
- Monthly cashflow
- —
- DSCR
- —
- Eligible?
- —
Personal DTI + credit; lowest rate.
DSCR
20% down · 8.5% · 30yr
- Down + closing
- —
- Monthly P&I
- —
- Monthly cashflow
- —
- DSCR
- —
- Eligible?
- —
No personal income docs; deal must DSCR.
Hard money
10% down · 12.0% · 12mo
- Down + closing
- —
- Monthly P&I
- —
- Monthly cashflow
- —
- DSCR
- —
- Eligible?
- —
Short-term bridge; refi at stabilization.
Listing history 18 events
-
2026-06-19days on market $145,000 Active 104 DOM
-
2026-06-18days on market $145,000 Active 103 DOM
-
2026-06-17days on market $145,000 Active 102 DOM
-
2026-06-16days on market $145,000 Active 101 DOM
-
2026-06-15days on market $145,000 Active 100 DOM
-
2026-06-13days on market $145,000 Active 98 DOM
-
2026-06-12days on market $145,000 Active 97 DOM
-
2026-06-09days on market $145,000 Active 94 DOM
-
2026-06-08days on market $145,000 Active 93 DOM
-
2026-06-07days on market $145,000 Active 92 DOM
-
2026-06-04days on market $145,000 Active 88 DOM
-
2026-06-02days on market $145,000 Active 87 DOM
-
2026-06-01days on market $145,000 Active 86 DOM
-
2026-05-31days on market $145,000 Active 85 DOM
-
2026-05-31days on market $145,000 Active 84 DOM
-
2026-04-14status Active
-
2026-03-17historical Active Under Contract
-
2026-03-08$150,000 Active
ⓘ Source: listings_history table (triggers on properties + properties_extension) + one-shot
backfill from property_details.listing_events for pre-trigger history.
Tax reassessment forecast CO · Resets to sale price
- Current annual tax
- $794 · $66/mo
- Projected year-2 tax
- $798 · $66/mo
- Expected delta
- +$4/yr ($0/mo · 0.5%)
ⓘ Screening estimate from a state-policy table — verify with the county assessor before closing.
Nearby sold comps map
Loading sold comps map…
Walkable amenities ~0.75 mi
Loading nearby amenities…
Taxation est. · year 1
- Rental income
- $24,888
- − Mortgage interest
- −$8,122
- − Property taxes
- −$794
- − Insurance
- −$725
- − Repairs & maintenance
- −$1,991
- − Management
- −$1,991
- − Depreciation
- −$4,218
- Taxable income
- $7,047
- Est. tax owed @ 24.0%
- −$1,691
- After-tax cash flow
- $7,327/yr
For passive investors: Depreciation is non-cash, so a rental often shows a tax loss while cash-flowing — sheltering income. Rental losses are passive: they offset passive income freely, and up to $25,000/yr can offset ordinary (W-2) income if you actively participate and your MAGI is under $100k (phasing out to $0 by $150k); unused losses carry forward. On sale, claimed depreciation is recaptured at up to 25%, and gains may owe capital-gains tax (a 1031 exchange can defer both). Figures are a year-1 estimate at your 24.0% rate — not tax advice; consult a CPA.
Schools (NCES district)
- District
- Crowley County School District No. Re-1-J
- NCES district ID
- 0803210
- Math proficiency
- 16% ▼ -10.00%
- Reading proficiency
- 28% ▼ -12.00%
- Median HH income
- $35,031
- Composite
- 21.28/100
- National rank
- #13663
- State rank
- #150 of 176 in CO
Livability — Ordway
- Score
- 61/100
- State rank
- #233
- US rank
- #18425
Category grades
Schools grade is shown separately in the Schools card above.
Census & demographics
- Census place
- Ordway, CO
- Population (ZIP)
- 3,060
Population outlook (Crowley County) Hauer SSP2
- Today (2025)
- 5,612 people
- By 2030
- 5,725 · +2.0%
- By 2040
- 6,092 · +8.6%
- By 2050
- 6,391 · +13.9%
- By 2075
- 6,250 · +11.4%
- By 2100
- 5,349 · -4.7%
Race, ethnicity, and origin ACS 2023
- Neighborhood character
- Diverse neighborhood (Simpson 0.64)
- Race & ethnicity
- White 52% Hispanic / Latino 28% Two or more races 18% Black 7% Native American 6%
- Hispanic origin (detail)
- Mexican 11%
- Common ancestry
- Serbian 3% Portuguese 2% Iranian 1%
- Foreign-born
- 2% · Vietnam, Canada
- Languages at home
- 91% English-only · Spanish 8% Vietnamese 1%
Political lean MEDSL · Crowley
- 2024 margin
- Solid R (+47.4) · D 24.7% · R 72.2% · Other 3.1%
- 2008→2024 swing
- -20.2pp toward R · 2008: -27.2pp · 2024: -47.4pp
- All cycles
- 2024: R+47.4 2020: R+47.7 2016: R+48.5 2012: R+25.9 2008: R+27.2
Not yet ingested
- Civics
- —
Market trends
- HPI YoY
- ▼ -2.42%
- Current HPI
- 211.1097
- Rent YoY
- —
- Metro
- —
- State GDP YoY
- ▲ 1.95%
- F500 in state
- 14
Industry mix (Fortune 500 HQ in CO)
| Industry | F500 HQs | Revenue |
|---|---|---|
| Technology Distribution | 1 | $31B |
|
||
| Food / Agriculture | 1 | $18B |
|
||
| Packaging | 1 | $14B |
|
||
| Healthcare | 1 | $13B |
|
||
| Energy | 1 | $10B |
|
||
| Technology | 1 | $4B |
|
||
Price history
3 events — show timeline
- 2026-04-14 Relisted — PARMLS
- 2026-03-17 Contingent — PARMLS
- 2026-03-08 Listed $150,000 PARMLS
Property tax history
+89.6%/yrLatest (2021): $794 · +3.5% YoY. Source: county tax records.
Cash-flow waterfall
monthlySold comps — $/sqft
last 12 mo · ≤1 miLoading sold comps…