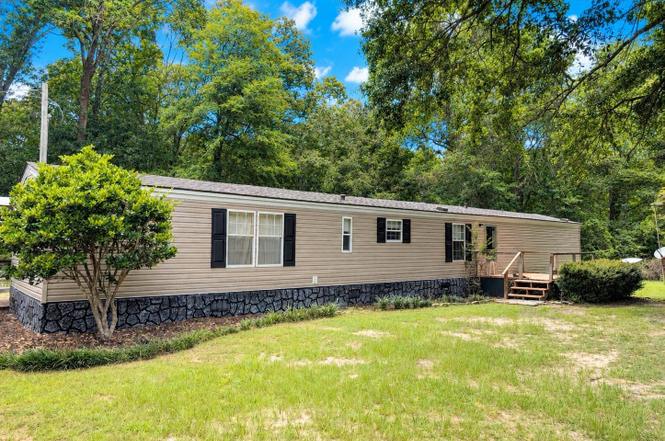
156 Mack Ln · Spearsville, LA
Flood risk No data
- FEMA flood zone
- —
- Chance of flooding over 30 yrs
- —
- Est. flood insurance / yr
- —
Fire risk No data
- Est. fire insurance / yr
- —
Heat risk No data
- Hot days now (above threshold)
- —
- Hot days in 30 yrs
- —
Wind risk No data
- Chance of severe wind over 30 yrs
- —
Air-quality risk No data
- Unhealthy air days now
- —
- Unhealthy air days in 30 yrs
- —
Risk factors via First Street. Map © Google.
Why this score? — see what drove the D- grade
The composite is a weighted blend of 9 inputs, each scored 0–100. Each bar is that input's sub-score; the figure is the points it added to the 100-point composite (weight × sub-score).
- Cash flow +10.5/30.0
- ARV discount +7.5/15.0
- Appreciation +6.3/10.0
- DSCR +3.0/10.0
- Rent growth +2.5/5.0
- Livability +2.5/5.0
- Condition / age +2.5/5.0
- 1% rule +1.9/10.0
- Schools +1.3/10.0
$115,000
🖨 Deal sheet (PDF) 📄 Offer letter ✓ Due diligence
Listing remarks
Peaceful Country Living on 5 Acres! This well-maintained 2002 manufactured home offers 3 bedrooms, 2 bathrooms, and the privacy you've been searching for in Union Parish. Situated at the end of a long private drive, this property provides a quiet, peaceful setting with plenty of room to enjoy the outdoors while still being eligible for FHA financing. Inside, you'll find a desirable split-floor plan designed for both comfort and functionality. In addition to the spacious living areas, there's a versatile 13 x 14 bonus room that could easily serve as a home office, craft room, playroom, or home gym that isn't included in the hsf. The owner reports the home was ordered with extra insulation fo
Key facts
- Long private drive
- Split-floor plan
- Extra insulation
Tags
Neighborhood map
What this means for you Summary
Snapshot
- This is a 3-bed/2.0-bath manufactured listed at $115k.
Deal economics
- At list price, monthly cash flow is $-58 ($-701/yr) — negative.
- To cash-flow at today's rent, offer at most $105k (9.0% below list).
- To meet the 1% rule (rent ≥ 1% of price), the offer needs to be $79k (30.9% below list).
- Recommended offer: $79k (30.9% below list) — sets the bar for 1% rule.
Location & tenants
- Location reads 49/100 on livability (#437 in LA) — a working-class tenant base; expect higher turnover. Strengths: cost of living A+, crime A; Watch: health & safety D, amenities F, commute F.
- Union Parish (rural): math 12% / reading 20% proficiency, ranked #74 of 98 in LA (top 76%) — low school quality limits family demand, transient renter base, plan for 1-2y turnover; 76% free/reduced lunch — lower-income household profile, screen leases tightly.
- Zoned schools: Union Parish Elementary School (math 4% / reading 8%, grade F, #630 of 646 statewide, top 98%, 659 students, 58% FRL); Union Parish High School (math 8% / reading 16%, grade F, #235 of 265 statewide, top 90%, 745 students, 52% FRL) — zoned schools average 55% FRL vs 76% district-wide (21 pts lower); this property's tenant base skews higher-income than the district average.
- Market conditions: 16 active listings in the ZIP; 2 units permitted in Union Parish in 2024 (0 in 5+ unit buildings).
Forward outlook
- In year one you build about $4k of equity ($795 loan paydown + $3k appreciation (2.6% local appreciation)).
- Union County population projected at -14% by 2050 — secular population decline; favor cash flow + early exit over multi-decade hold.
- At projected returns (2.6% appreciation + 3.0% rent growth), your $32k cash investment doubles in ~8 years — after that, you're playing with house money.
- By year 9, paydown + projected appreciation supports a ~$32k cash-out refi (75% LTV) — recoverable capital for the next deal without selling this one.
Negotiation context
- Only 5 days on market — expect competitive offers; lowballing is unlikely to land.
Questions for the listing agent
- What do current leases actually rent for vs. the listed asking? Can we see a recent rent roll and the last 12 months of T-12 income?
- Is there a deadline driving the sale (1031 exchange, divorce, estate, relocation)? That informs how much negotiation room exists.
- Schools are F-rated, which usually means shorter tenancies and higher turnover. Who's the typical renter profile here, and what's been the actual vacancy rate?
- The area grade is low — what's the realistic commute time and amenity access for the typical tenant pool here? Any planned neighborhood developments (good or bad) we should know about?
- What's the average days-on-market for RENTAL listings here right now (not sales)? A rising rental-DOM trend means longer vacancies and softer asking-rent achievability than the comps imply.
- What's the recent tenant-quality profile in this submarket — average credit score on applications, eviction rate, late-payment / NSF rate, and stable-employment percentage? A property-management company in the area should have these aggregated.
- How much new for-sale + rental construction is in the pipeline within 1–3 miles? Heavy new supply typically softens prices + rents 12–24 months out; constrained supply supports both.
Investment metrics
- 1% rule
- 0.69% ✗
- Cap rate
- 5.68%
- Cash-on-cash
- -2.18%
- DSCR
- 0.90
- GRM
- 12.1
CMA / ARV
No comps found within radius.
Projected returns pro-forma
2.57% appreciation · 3.0% rent growth · sell at horizon
- IRR
- 4.2%
- Equity multiple
- 1.23×
- Total profit
- $7,500
- Equity at exit
- $48,965
- IRR
- 7.5%
- Equity multiple
- 2.09×
- Total profit
- $35,116
- Equity at exit
- $73,394
Cash invested: $32,200 (down + closing). Projections, not guarantees.
Landlord ↔ Tenant lean methodology
- Overall (STATE)
- 90 Strongly Landlord-Friendly
- State Louisiana
- 90 Strongly Landlord-Friendly · R+12
- County
- — inherits STATE
- City
- — inherits STATE
ZIP-level market 71277
- Home prices YoY
- 2.1%
- Active inventory
- 16
- Price-to-rent
- 12.1×
Monthly cashflow live
- Estimated rent
- $794 medium interval (Pro) →
- Mortgage (P&I)
- −$603
- Tax from tax record
- −$35 /mo · $417/yr
- Insurance
- −$48
- HOA
- −$0
- Lot rent leased land?
- −$0
- Vacancy / Maint / Mgmt
- −$167
- Net cashflow
- $-58
Break-even live
Sensitivity live
| Price | -10% $7 | -5% $-26 | +0% $-58 | +5% $-91 | +10% $-124 |
|---|---|---|---|---|---|
| Rent | -10% $-121 | -5% $-90 | +0% $-58 | +5% $-27 | +10% $4 |
| Rate | -1.0pp $0 | -0.5pp $-29 | base $-58 | +0.5pp $-88 | +1.0pp $-119 |
UW: 25.0% down · 7.5% · 30yr · 1.5% tax · 5.0% vac · 8.0% maint · 8.0% mgmt
Financing live
Cash to close
- Down payment
- $28,750
- Closing costs
- $3,450
- Reserves months
- —
- Total cash needed
- —
Loan-product check · same deal, 3 products live
Conventional
25% down · 7.5% · 30yr
- Down + closing
- —
- Monthly P&I
- —
- Monthly cashflow
- —
- DSCR
- —
- Eligible?
- —
Personal DTI + credit; lowest rate.
DSCR
20% down · 8.5% · 30yr
- Down + closing
- —
- Monthly P&I
- —
- Monthly cashflow
- —
- DSCR
- —
- Eligible?
- —
No personal income docs; deal must DSCR.
Hard money
10% down · 12.0% · 12mo
- Down + closing
- —
- Monthly P&I
- —
- Monthly cashflow
- —
- DSCR
- —
- Eligible?
- —
Short-term bridge; refi at stabilization.
Listing history 15 events
-
2026-06-23days on market $115,000 Active 5 DOM
-
2026-06-21days on market $115,000 Active 4 DOM
-
2026-06-19days on market $115,000 Active 2 DOM
-
2026-06-18remarks 699-char remark
-
2026-06-18pricedays on market $115,000 Active 1 DOM
-
2026-06-15days on market $113,900 Active 103 DOM
-
2026-06-14days on market $113,900 Active 101 DOM
-
2026-06-13days on market $113,900 Active 100 DOM
-
2026-06-10days on market $113,900 Active 98 DOM
-
2026-06-09days on market $113,900 Active 97 DOM
-
2026-06-08days on market $113,900 Active 96 DOM
-
2026-06-07statusdays on market $113,900 Active 95 DOM
-
2026-04-24status Pending
-
2026-04-14price $113,900
-
2026-01-20$118,900 Active
ⓘ Source: listings_history table (triggers on properties + properties_extension) + one-shot
backfill from property_details.listing_events for pre-trigger history.
Tax reassessment forecast LA · Resets to sale price
- Current annual tax
- $417 · $35/mo
- Projected year-2 tax
- $632 · $53/mo
- Expected delta
- +$216/yr (+$18/mo · 51.7%)
ⓘ Screening estimate from a state-policy table — verify with the county assessor before closing.
Nearby sold comps map
Loading sold comps map…
Walkable amenities ~0.75 mi
Loading nearby amenities…
Taxation est. · year 1
- Rental income
- $9,529
- − Mortgage interest
- −$6,442
- − Property taxes
- −$417
- − Insurance
- −$575
- − Repairs & maintenance
- −$762
- − Management
- −$762
- − Depreciation
- −$3,345
- Taxable loss
- −$2,775
- Est. tax savings @ 24.0%
- +$666
- After-tax cash flow
- $-35/yr
For passive investors: Depreciation is non-cash, so a rental often shows a tax loss while cash-flowing — sheltering income. Rental losses are passive: they offset passive income freely, and up to $25,000/yr can offset ordinary (W-2) income if you actively participate and your MAGI is under $100k (phasing out to $0 by $150k); unused losses carry forward. On sale, claimed depreciation is recaptured at up to 25%, and gains may owe capital-gains tax (a 1031 exchange can defer both). Figures are a year-1 estimate at your 24.0% rate — not tax advice; consult a CPA.
Schools (NCES district)
- District
- Union Parish
- NCES district ID
- 2201770
- Math proficiency
- 12% ▼ -37.00%
- Reading proficiency
- 20% ▼ -34.00%
- Median HH income
- $37,279
- Composite
- 13.35/100
- National rank
- #9537
- State rank
- #74 of 98 in LA
Livability — Spearsville
- Score
- 49/100
- State rank
- #437
- US rank
- #25965
Category grades
Schools grade is shown separately in the Schools card above.
Census & demographics
- Population (ZIP)
- 1,792
Population outlook (Union County) Hauer SSP2
- Today (2025)
- 21,722 people
- By 2030
- 21,226 · -2.3%
- By 2040
- 20,026 · -7.8%
- By 2050
- 18,682 · -14.0%
- By 2075
- 15,725 · -27.6%
- By 2100
- 12,509 · -42.4%
Race, ethnicity, and origin ACS 2023
- Neighborhood character
- Diverse neighborhood (Simpson 0.65)
- Race & ethnicity
- Black 42% White 37% Hispanic / Latino 20% Two or more races 10%
- Hispanic origin (detail)
- Mexican 18%
- Common ancestry
- Lithuanian 1% Iranian 1%
- Foreign-born
- 2% · Canada
- Languages at home
- 90% English-only · Spanish 8% French/Haitian/Cajun 1%
Political lean MEDSL · Union
- 2024 margin
- Solid R (+57.0) · D 21.1% · R 78.0%
- 2008→2024 swing
- -15.4pp toward R · 2008: -41.5pp · 2024: -57.0pp
- All cycles
- 2024: R+57.0 2020: R+51.4 2016: R+48.5 2012: R+41.7 2008: R+41.5
Not yet ingested
- Civics
- —
Market trends
- HPI YoY
- ▲ 2.57%
- Current HPI
- 122.4578
- Rent YoY
- —
- Metro
- —
- State GDP YoY
- ▲ 3.29%
- F500 in state
- 10
Industry mix (Fortune 500 HQ in LA)
| Industry | F500 HQs | Revenue |
|---|---|---|
| Telecommunications | 2 | $23B |
|
||
| Utilities | 1 | $12B |
|
||
| Wholesale / Distribution | 1 | $5B |
|
||
| Advertising | 1 | $2B |
|
||
Price history
-4.2% since first listed3 events — show timeline
- 2026-04-24 Pending — NELABOR
- 2026-04-14 Price Changed $113,900 NELABOR
- 2026-01-20 Listed $118,900 NELABOR
Property tax history
+3.2%/yrLatest (2025): $417 · +0.0% YoY. Source: county tax records.
Cash-flow waterfall
monthlySold comps — $/sqft
last 12 mo · ≤1 miLoading sold comps…