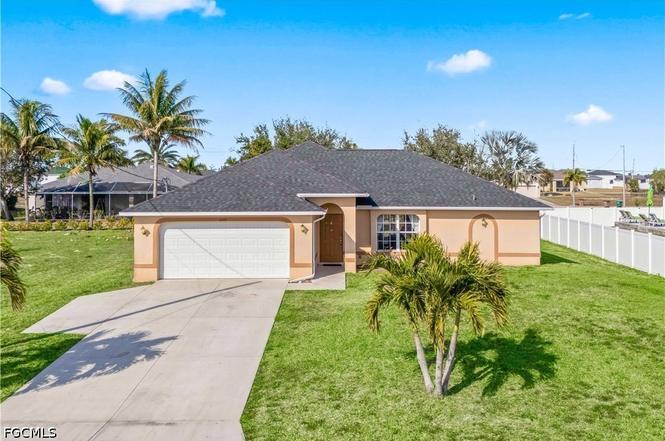
4409 Jacaranda Pkwy W · Cape Coral, FL
Flood risk 9/10 · Severe
- FEMA flood zone
- AE
- Chance of flooding over 30 yrs
- 0.99%
- Est. flood insurance / yr
- $1,737 – $8,500
Fire risk 3/10 · Minor
- Est. fire insurance / yr
- $947 – $1,759
Heat risk 10/10 · Severe
- Hot days now (above 107°F)
- 7 days/yr
- Hot days in 30 yrs
- 30 days/yr
Wind risk 10/10 · Severe
- Chance of severe wind over 30 yrs
- 99.0%
Air-quality risk 3/10 · Minor
- Unhealthy air days now
- 2 days/yr
- Unhealthy air days in 30 yrs
- 2 days/yr
Risk factors via First Street. Map © Google.
Why this score? — see what drove the C- grade
The composite is a weighted blend of 9 inputs, each scored 0–100. Each bar is that input's sub-score; the figure is the points it added to the 100-point composite (weight × sub-score).
- Cash flow +15.6/30.0
- ARV discount +15.0/15.0
- DSCR +4.8/10.0
- Schools +4.1/10.0
- 1% rule +3.9/10.0
- Livability +3.9/5.0
- Condition / age +2.5/5.0
- Rent growth +1.1/5.0
- Appreciation +0.0/10.0
$265,000
🖨 Deal sheet (PDF) 📄 Offer letter ✓ Due diligence
Listing remarks MLS
FHA & VA buyers welcome! Like New! READY TO MOVE IN! Nice, quiet area west of Old Burnt Store Rd with many waterfront homes and tile roofs. New tile, new carpet, fresh paint (inside and out), new Floratam lawn, new landscaping, and more. Garage floor has even been epoxy coated. Open floorplan. Covered lanai. Room for your future pool. This exceptional home has been extensively documented as NEVER having defective drywall. Home should easily pass FHA or VA criteria.
Key facts
- Room for a pool
- 0.23 acre lot
- 2 garage spots
Tags
Property features AI
Finance
- Financial info: Pets allowed
- HOA & community: No regular association fee (association fee listed as 0.0); Community services include road maintenance, sewer, street lights, trash and water
Exterior
- Parking: Attached 2-car garage with garage door opener; Attached carport with 2 carport spaces; Driveway parking; Paved parking; 4 covered parking spaces total
- Security: Secured garage/parking; Smoke detectors
- Utilities: Well water; Private sewer; Cable available
- Home design: Single-story residence; Entry at level 1; Faces south; Resale property
- Construction: Block, concrete and stucco construction; Shingle roof
- Exterior features: Sprinkler/irrigation system; Patio and open porch; Room for a pool; Manual exterior shutters; Paved road access; Rectangular lot; Automatic sprinklers
Interior
- Kitchen: Dishwasher; Electric cooktop; Disposal; Icemaker; Microwave; Refrigerator (with ice maker); Kitchen island; Eat-in kitchen; Breakfast bar
- Flooring: Tile flooring
- Bathrooms: 2 full bathrooms
- Heating & cooling: Central heating (electric); Central air conditioning (electric); Ceiling fans
- Interior features: Shutters on windows; Breakfast bar; Cathedral and vaulted ceilings; Dual sinks; Eat-in kitchen; Family/dining room combination; Kitchen island; Living/dining room; Separate shower (shower only); Split bedroom floorplan; Furnishing negotiable
- Laundry & utility: Washer hookup; Dryer hookup; Indoor laundry
Neighborhood map
What this means for you Summary
Snapshot
- This is a 4-bed/2.0-bath single-family listed at $265k.
Deal economics
- At list price, monthly cash flow is $-313 ($-4k/yr) — negative.
- To cash-flow at today's rent, offer at most $210k (20.9% below list).
- To meet the 1% rule (rent ≥ 1% of price), the offer needs to be $236k (11.0% below list).
- Recommended offer: $210k (20.9% below list) — sets the bar for cash-flow.
- Cap rate 6.8% vs local median 3.1% in Cape Coral — top-decile yield for the area; either an underpriced asset or a hidden risk that comps aren't pricing in. Stress-test before assuming the spread holds.
Location & tenants
- Location reads 77/100 on livability (#208 in FL, #3,098 nationally) — a middle-class / working-renter tenant base. Strengths: housing A+, health & safety A+, amenities B+; Watch: commute F.
- Lee (suburban): math 47% / reading 50% proficiency, ranked #42 of 73 in FL (top 58%) — families likely to look elsewhere, expect single-tenant / working-renter base with shorter leases.
- Zoned schools: Gulf Elementary School (math 70% / reading 65%, grade B+, #435 of 2,144 statewide, top 21%, 1,231 students, 38% FRL); Challenger Middle School (math 59% / reading 56%, grade B, #157 of 571 statewide, top 28%, 1,124 students, 50% FRL); Ida S. Baker High School (math 44% / reading 47%, grade D-, #223 of 667 statewide, top 34%, 1,933 students, 39% FRL) — zoned schools average 42% FRL vs 57% district-wide (15 pts lower); this property's tenant base skews higher-income than the district average.
- Market conditions: Rents falling (-5.5%/yr); 2671 active listings in the ZIP; 19 comparable units currently listed for rent nearby; rentals at typical pace (median 26d on market — plan ~3-4 weeks tenant-placement turnaround); solid renter incomes; 15,411 units permitted in Lee County in 2024 (4,686 in 5+ unit buildings).
- This rent runs 31% of the median local income ($91k/yr) — at the standard rent-burdened threshold; future hikes will face affordability resistance.
Forward outlook
- Local home prices are declining (-3.0%/yr); year-one equity from $2k of loan paydown is wiped out by about $8k of value loss. Plan a longer hold.
- Lee County population projected at +44% by 2050 — long-run rental-demand tailwind backs the buy-and-hold thesis.
Negotiation context
- Only 1 days on market — expect competitive offers; lowballing is unlikely to land.
- 6 sale attempts since 11y ago with the ask held roughly flat each time — persistent listings suggest the price (not the market) is what's stuck; bring a comps-based counter.
- Current owner paid $180k; 47% above their basis — modest negotiation headroom, anchor on the comps not their cost.
Risks & watch-outs
- Watch-outs: flood insurance adds $427/mo.
- Climate carrying-cost: in FEMA flood zone AE (mandatory federal flood insurance); severe wind risk, 99% chance of damaging wind over 30y; extreme-heat days projected 7→30/yr by 2055 (HVAC capex compounding) — expect insurance premiums to compound above CPI over the hold.
Questions for the listing agent
- What do current leases actually rent for vs. the listed asking? Can we see a recent rent roll and the last 12 months of T-12 income?
- What's the actual annual flood-insurance premium (NFIP or private), and is the property in a SFHA with mandatory coverage?
- Is there a deadline driving the sale (1031 exchange, divorce, estate, relocation)? That informs how much negotiation room exists.
- Schools are B-rated — typically a magnet for longer-tenancy family renters. What's the average tenant stay here, and is there a school-zone premium baked into asking?
- What's the average days-on-market for RENTAL listings here right now (not sales)? A rising rental-DOM trend means longer vacancies and softer asking-rent achievability than the comps imply.
- What's the recent tenant-quality profile in this submarket — average credit score on applications, eviction rate, late-payment / NSF rate, and stable-employment percentage? A property-management company in the area should have these aggregated.
- How much new for-sale + rental construction is in the pipeline within 1–3 miles? Heavy new supply typically softens prices + rents 12–24 months out; constrained supply supports both.
Investment metrics
- 1% rule
- 0.89% ✗
- Cap rate
- 6.81%
- Cash-on-cash
- 1.83%
- DSCR
- 1.08
- GRM
- 9.4
CMA / ARV
- ARV (on-the-fly)
- $474,224
- Comps found
- 6
Show comp detail 6 sales within ~0.75 mi
| Address | Dist | Beds/Ba | Sqft | Sold | Price | $/sf | Match |
|---|---|---|---|---|---|---|---|
| 4421 NW 32nd Ln | 0.18mi | 3/2.0 (-1) | 1,464 (-14%) | 0mo | $450,000 | $307 | 62 |
| 4206 NW 34th Ter | 0.53mi | 4/2.0 | 1,830 (+7%) | 21mo | $540,000 | $295 | 46 |
| 4313 Jacaranda Pkwy W | 0.13mi | 3/3.0 (-1) | 1,931 (+13%) | 22mo | $535,000 | $277 | 45 |
| 4205 NW 34th Ln | 0.61mi | 3/3.0 (-1) | 1,931 (+13%) | 4mo | $400,000 | $207 | 38 |
| 4303 NW 35th St | 0.60mi | 3/2.0 (-1) | 1,950 (+14%) | 8mo | $510,000 | $262 | 37 |
| 2810 NW 41st Ave | 0.58mi | 3/3.0 (-1) | 1,915 (+12%) | 18mo | $515,000 | $269 | 29 |
Match score weights: distance 35% · size 25% · config 20% · recency 20%. Top-matched comps best support the ARV.
Projected returns pro-forma
-3.0% appreciation · 0.0% rent growth · sell at horizon
- IRR
- -29.0%
- Equity multiple
- 0.06×
- Total profit
- $-69,549
- Equity at exit
- $39,512
- IRR
- -52.5%
- Equity multiple
- -0.51×
- Total profit
- $-111,945
- Equity at exit
- $22,912
Cash invested: $74,200 (down + closing). Projections, not guarantees.
Landlord ↔ Tenant lean methodology
- Overall (STATE)
- 87 Strongly Landlord-Friendly
- State Florida
- 87 Strongly Landlord-Friendly · R+3
- County
- — inherits STATE
- City
- — inherits STATE
ZIP-level market 33993
- Home prices YoY
- -14.1%
- Rents YoY
- -5.5%
- Active inventory
- 2671
- Price-to-rent
- 9.4×
Monthly cashflow live
- Estimated rent
- $2,358 high interval (Pro) →
- Mortgage (P&I)
- −$1,390
- Tax from tax record
- −$249 /mo · $2,993/yr
- Insurance
- −$110
- Flood insurance flood zone
- −$427 /mo · $5,118/yr
- HOA
- −$0
- Vacancy / Maint / Mgmt
- −$495
- Net cashflow
- $-313
Break-even live
Sensitivity live
| Price | -10% $-163 | -5% $-238 | +0% $-313 | +5% $-388 | +10% $-463 |
|---|---|---|---|---|---|
| Rent | -10% $-499 | -5% $-406 | +0% $-313 | +5% $-220 | +10% $-127 |
| Rate | -1.0pp $-180 | -0.5pp $-246 | base $-313 | +0.5pp $-382 | +1.0pp $-452 |
UW: 25.0% down · 7.5% · 30yr · 1.5% tax · 5.0% vac · 8.0% maint · 8.0% mgmt
Financing live
Cash to close
- Down payment
- $66,250
- Closing costs
- $7,950
- Reserves months
- —
- Total cash needed
- —
Loan-product check · same deal, 3 products live
Conventional
25% down · 7.5% · 30yr
- Down + closing
- —
- Monthly P&I
- —
- Monthly cashflow
- —
- DSCR
- —
- Eligible?
- —
Personal DTI + credit; lowest rate.
DSCR
20% down · 8.5% · 30yr
- Down + closing
- —
- Monthly P&I
- —
- Monthly cashflow
- —
- DSCR
- —
- Eligible?
- —
No personal income docs; deal must DSCR.
Hard money
10% down · 12.0% · 12mo
- Down + closing
- —
- Monthly P&I
- —
- Monthly cashflow
- —
- DSCR
- —
- Eligible?
- —
Short-term bridge; refi at stabilization.
Rent comps 19 comps
| Address | Beds | Baths | Sqft | Rent | $/sqft | DOM | Units | Dist |
|---|---|---|---|---|---|---|---|---|
| 4331 NW 31st Ter Cape Coral, FL | 4.0 | 3.0 | 1904 | $2,200 | $1.16 | 5d | 1 | 0.05mi |
| 4230 NW 32nd Ter Cape Coral, FL | 3.0 | 2.0 | 1688 | $1,795 | $1.06 | 16d | 1 | 0.22mi |
| 4129 Jacaranda Pkwy W Cape Coral, FL | 4.0 | 2.0 | 2027 | $2,501 | $1.23 | 5d | 1 | 0.33mi |
| 4202 NW 32nd Ln Cape Coral, FL | 3.0 | 2.0 | 1688 | $1,795 | $1.06 | 25d | 1 | 0.34mi |
| 4402 NW 34th Ter Cape Coral, FL | 4.0 | 3.0 | 1904 | $2,200 | $1.16 | 25d | 1 | 0.38mi |
| 4333 NW 34th St Cape Coral, FL | 4.0 | 3.0 | 1904 | $2,200 | $1.16 | 25d | 1 | 0.42mi |
| 3241 NW 41st Pl Cape Coral, FL | 3.0 | 2.0 | 1688 | $1,795 | $1.06 | 25d | 1 | 0.44mi |
| 4402 NW 34th Ter Cape Coral, FL | 4.0 | 3.0 | 1904 | $2,200 | $1.16 | 25d | 1 | 0.44mi |
| 4595 NW 34th St Cape Coral, FL | 4.0 | 3.0 | 1900 | $2,195 | $1.16 | 18d | 1 | 0.44mi |
| 4333 NW 34th Ln Cape Coral, FL | 4.0 | 3.0 | 1904 | $2,200 | $1.16 | 25d | 1 | 0.54mi |
| 2726 NW 41st Pl Cape Coral, FL | 4.0 | 3.0 | 1904 | $2,200 | $1.16 | 5d | 1 | 0.66mi |
| 3535 NW 42nd Ave Cape Coral, FL | 4.0 | 2.0 | 1787 | $2,145 | $1.20 | 25d | 1 | 0.81mi |
| 4115 NW 36th Ln Cape Coral, FL | 4.0 | 2.0 | 1787 | $2,000 | $1.12 | 25d | 1 | 0.97mi |
| 4113 Kismet Pkwy Cape Coral, FL | 4.0 | 3.0 | 1816 | $2,300 | $1.27 | 5d | 1 | 1.05mi |
| 3812 NW 38th St Cape Coral, FL | 3.0 | 2.0 | 1920 | $2,600 | $1.35 | 25d | 1 | 1.27mi |
| 2127 NW 41st Pl Cape Coral, FL | 4.0 | 2.0 | 1828 | $1,876 | $1.03 | 5d | 1 | 1.28mi |
| 2113 NW 41st Ave Cape Coral, FL | 4.0 | 3.0 | 1904 | $2,200 | $1.16 | 5d | 1 | 1.35mi |
| 4116 NW 20th Ter Cape Coral, FL | 4.0 | 3.0 | 1904 | $2,200 | $1.16 | 12d | 1 | 1.46mi |
| 3617 NW 38th Ter Cape Coral, FL | 4.0 | 3.0 | 1903 | $2,200 | $1.16 | 25d | 1 | 1.47mi |
Listing history 2 events
-
2026-06-22remarks 348-char remark
-
2026-06-22$265,000 Active 1 DOM
ⓘ Source: listings_history table (triggers on properties + properties_extension) + one-shot
backfill from property_details.listing_events for pre-trigger history.
Tax reassessment forecast FL · Resets to sale price
- Current annual tax
- $2,993 · $249/mo
- Projected year-2 tax
- $2,993 · $249/mo
- Expected delta
- $0/yr ($0/mo · 0.0%)
ⓘ Screening estimate from a state-policy table — verify with the county assessor before closing.
Climate risk First Street
- Flood 9/10 Extreme FEMA zone AE · 99% chance over 30 yrs
- Wildfire 3/10 Moderate
- Heat 10/10 Extreme 7 d/yr ≥107°F today · 30 d/yr by 30 yrs out
- Wind 10/10 Extreme 99% chance of damaging wind over 30 yrs
- Air quality 3/10 Moderate 2 unhealthy d/yr today · 2 by 30 yrs out
Nearby sold comps map
Loading sold comps map…
Walkable amenities ~0.75 mi
Loading nearby amenities…
Taxation est. · year 1
- Rental income
- $28,297
- − Mortgage interest
- −$14,844
- − Property taxes
- −$2,993
- − Insurance
- −$6,444
- − Repairs & maintenance
- −$2,264
- − Management
- −$2,264
- − Depreciation
- −$7,709
- Taxable loss
- −$8,220
- Est. tax savings @ 24.0%
- +$1,973
- After-tax cash flow
- $-1,785/yr
For passive investors: Depreciation is non-cash, so a rental often shows a tax loss while cash-flowing — sheltering income. Rental losses are passive: they offset passive income freely, and up to $25,000/yr can offset ordinary (W-2) income if you actively participate and your MAGI is under $100k (phasing out to $0 by $150k); unused losses carry forward. On sale, claimed depreciation is recaptured at up to 25%, and gains may owe capital-gains tax (a 1031 exchange can defer both). Figures are a year-1 estimate at your 24.0% rate — not tax advice; consult a CPA.
Schools (NCES district)
- District
- Lee
- NCES district ID
- 1201080
- Math proficiency
- 47% ▼ -11.00%
- Reading proficiency
- 50% ▼ -4.00%
- Median HH income
- $49,518
- Composite
- 41.49/100
- National rank
- #3458
- State rank
- #42 of 73 in FL
Livability — Cape Coral
- Score
- 77/100
- State rank
- #208
- US rank
- #3098
Category grades
Schools grade is shown separately in the Schools card above.
Census & demographics
- Census place
- Cape Coral, FL
- County
- Lee County · 788,662 people
- City population
- 217,388
- Metro
- Cape Coral-Fort Myers, FL
- Population (ZIP)
- 35,580
- Household income
- $90,577
- Rent vs Own
- Severe rent burden
- 286.0
Population outlook (Lee County) Hauer SSP2
- Today (2025)
- 871,946 people
- By 2030
- 955,468 · +9.6%
- By 2040
- 1,113,587 · +27.7%
- By 2050
- 1,256,891 · +44.1%
- By 2075
- 1,560,270 · +78.9%
- By 2100
- 1,726,848 · +98.0%
Race, ethnicity, and origin ACS 2023
- Neighborhood character
- Diverse neighborhood (Simpson 0.58)
- Race & ethnicity
- White 57% Hispanic / Latino 30% Two or more races 21% Black 7% Asian 2%
- Hispanic origin (detail)
- Mexican 2% Puerto Rican 6% Cuban 17% Dominican 1%
- Common ancestry
- Romanian 2% Hispanic 2% Lithuanian 2%
- Foreign-born
- 21% · Canada, Jamaica, China
- Languages at home
- 73% English-only · Spanish 24% French/Haitian/Cajun 1% Russian/Polish/Slavic 1%
Political lean MEDSL · Lee
- 2024 margin
- Strong R (+28.4) · D 35.5% · R 63.9%
- 2008→2024 swing
- -18.0pp toward R · 2008: -10.4pp · 2024: -28.4pp
- All cycles
- 2024: R+28.4 2020: R+19.2 2016: R+20.4 2012: R+16.6 2008: R+10.4
Not yet ingested
- Civics
- —
Market trends
- HPI YoY
- ▼ -55.34%
- Current HPI
- 337.0575
- Rent YoY
- ▼ -5.51%
- Metro
- Cape Coral-Fort Myers, FL
- State GDP YoY
- ▲ 3.28%
- F500 in state
- 36
Industry mix (Fortune 500 HQ in FL)
| Industry | F500 HQs | Revenue |
|---|---|---|
| Industrial Technology | 2 | $29B |
|
||
| Insurance | 2 | $17B |
|
||
| Retail | 1 | $60B |
|
||
| Technology Distribution | 1 | $58B |
|
||
| Homebuilding | 1 | $35B |
|
||
| Technology Manufacturing | 1 | $35B |
|
||
Price history
+211.8% since first listed28 events — show timeline
- 2026-06-20 Listed $265,000 FORTMLS
- 2026-03-01 Listing Removed — FORTMLS
- 2026-02-08 Price Changed $314,900 FORTMLS
- 2026-01-14 Listed $324,900 FORTMLS
- 2016-09-27 Sold (Public Records) $180,000 Public Records
- 2016-09-15 Price Changed $180,000 FORTMLS
- 2016-09-14 Sold (MLS) $180,000 FORTMLS
- 2016-09-11 Price Changed $185,000 FORTMLS
- 2016-08-08 Pending — FORTMLS
- 2016-06-15 Listed $185,000 FORTMLS
- 2016-05-21 Listing Removed — FORTMLS
- 2016-05-14 Pending — FORTMLS
- 2016-05-09 Relisted — FORTMLS
- 2016-05-03 Pending — FORTMLS
- 2016-04-23 Price Changed $174,900 FORTMLS
- 2016-04-19 Price Changed $177,000 FORTMLS
- 2016-04-07 Price Changed $178,000 FORTMLS
- 2016-04-06 Relisted — FORTMLS
- 2016-02-14 Pending — FORTMLS
- 2016-01-31 Price Changed $184,500 FORTMLS
- 2016-01-31 Price Changed $174,500 FORTMLS
- 2016-01-29 Price Changed $174,900 FORTMLS
- 2016-01-05 Price Changed $179,000 FORTMLS
- 2016-01-05 Price Changed $179,900 FORTMLS
- 2015-12-09 Listed $189,000 FORTMLS
- 2015-03-02 Price Changed $79,000 FORTMLS
- 2009-11-03 Sold (Public Records) $85,000 Public Records
- 2009-10-30 Sold (MLS) $85,000 FORTMLS
Property tax history
+2.0%/yrLatest (2025): $2,993 · +7.4% YoY. Source: county tax records.
Cash-flow waterfall
monthlySold comps — $/sqft
last 12 mo · ≤1 miLoading sold comps…