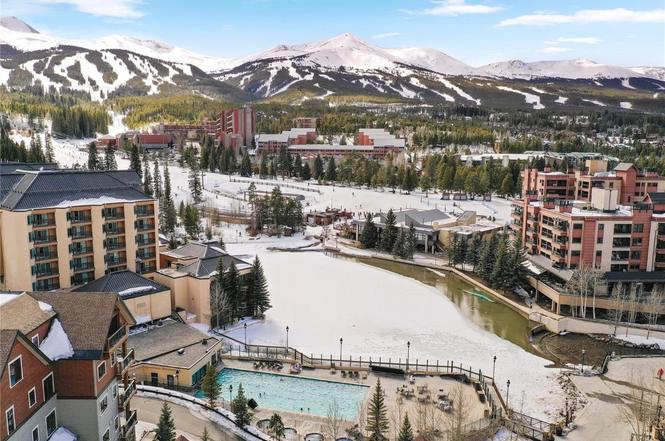
600 S Main St #4401 · Breckenridge, CO
Flood risk No data
- FEMA flood zone
- —
- Chance of flooding over 30 yrs
- —
- Est. flood insurance / yr
- —
Fire risk No data
- Est. fire insurance / yr
- —
Heat risk No data
- Hot days now (above threshold)
- —
- Hot days in 30 yrs
- —
Wind risk No data
- Chance of severe wind over 30 yrs
- —
Air-quality risk No data
- Unhealthy air days now
- —
- Unhealthy air days in 30 yrs
- —
Risk factors via First Street. Map © Google.
Why this score? — see what drove the D grade
The composite is a weighted blend of 9 inputs, each scored 0–100. Each bar is that input's sub-score; the figure is the points it added to the 100-point composite (weight × sub-score).
- Cash flow +15.0/30.0
- ARV discount +7.5/15.0
- 1% rule +5.0/10.0
- DSCR +5.0/10.0
- Livability +3.6/5.0
- Schools +3.2/10.0
- Rent growth +2.5/5.0
- Condition / age +2.5/5.0
- Appreciation +0.0/10.0
$34,000
🖨 Deal sheet 📄 Offer letter ✓ Due diligence
Listing remarks
Celebrate peak holiday ski season in Breckenridge with this 1/20th fractional ownership in what some consider the penthouse at The Residences at Main Street Station, Hyatt Vacation Club. Week 51 in this 3 bedroom, 3 bath unit is one of the most sought after winter weeks of the entire year, giving you 7 guaranteed days during the festive holiday period when the mountain is buzzing, the town is glowing, and the snow conditions are usually at their best. Along with your fixed winter week, you’ll also receive 10 additional float days to enjoy in the spring, summer, or fall. Whether you prefer wildflower trails, crisp fall paths, or simply relaxing in the mountains, these extra days give y
Key facts
- World class skiing
- Premium unit
- Desirable locations
Tags
Property features AI
Finance
- Other: Building amenities include elevators, meeting rooms, on-site management, screening room, and WiFi; Community features include a pool; Located in MAIN STREET STATION - VACATION CLUB
- HOA & community: Homeowners association with annual fee (fitness center available); Association fee shown annually
Exterior
- Parking: Assigned parking; Underground parking; Garage
- Utilities: Public water; No additional utilities listed
- Home design: Residential timeshare
- Construction: Concrete construction; Steel siding; Asphalt and metal roof
- Exterior features: Community pool; Storage; City lot; Near public transit; Paved road access; Has view
Interior
- Kitchen: Dryer; Dishwasher; Electric cooktop; Electric range; Disposal; Microwave; Washer
- Flooring: Carpet; Tile
- Bathrooms: 3 full bathrooms
- Heating & cooling: Baseboard heating; Radiant heating
- Interior features: Eat-in kitchen; Furnished; Gas fireplace
- Laundry & utility: In-unit laundry (washer and dryer included)
Neighborhood map
What this means for you Summary
Snapshot
- This is a 3-bed/3.0-bath timeshare listed at $34k.
Deal economics
- At list price, monthly cash flow is $2k ($29k/yr) — positive.
- The deal already cash-flows at list — no discount required.
- Meets the 1% rule at list price ($4k rent vs $34k).
- Recommended offer: $30k (12.0% below list) — sets the bar for market timing.
- Cap rate 90.2% vs local median 0.7% in Breckenridge — top-decile yield for the area; either an underpriced asset or a hidden risk that comps aren't pricing in. Stress-test before assuming the spread holds.
Location & tenants
- Location reads 72/100 on livability (#62 in CO) — a middle-class / working-renter tenant base. Strengths: commute A+, employment A+, housing B; Watch: health & safety C-, crime D, amenities F.
- Summit School District No. RE-1 (rural): math 27% / reading 43% proficiency, ranked #35 of 86 in CO (top 41%) — families likely to look elsewhere, expect single-tenant / working-renter base with shorter leases.
- Market conditions: 614 active listings in the ZIP; 1 comparable units currently listed for rent nearby; high-income renter base; 308 units permitted in Summit County in 2024 (123 in 5+ unit buildings).
- This rent runs 40% of the median local income ($121k/yr) — at the standard rent-burdened threshold; future hikes will face affordability resistance.
Forward outlook
- Local home prices are declining (-3.0%/yr); year-one equity from $235 of loan paydown is wiped out by about $1k of value loss. Plan a longer hold.
- Summit County population projected at +32% by 2050 — long-run rental-demand tailwind backs the buy-and-hold thesis.
- At projected returns (-3.0% appreciation + 3.0% rent growth), your $10k cash investment doubles in ~1 year — after that, you're playing with house money.
Negotiation context
- It's been on market 213 days — a 12% lower offer ($30k) is reasonable based on typical stale-listing flexibility.
- 7 sale attempts since 4y ago; this cycle's ask has dropped $26k (43%) from the opening price — seller is motivated, your offer sets the floor, not the list.
Questions for the listing agent
- It's been on market 213 days. Have you received any prior offers? Is the seller open to a 12% concession, seller financing, or rate buy-down credit?
- What does the HOA fee cover, when was the last increase, and are there any pending special assessments or reserve-fund shortfalls?
- Why hasn't it sold? Are there any deal-killer items the seller is aware of (foundation, flood, title, zoning, code violations)?
- Is there a deadline driving the sale (1031 exchange, divorce, estate, relocation)? That informs how much negotiation room exists.
- Schools are B-rated — typically a magnet for longer-tenancy family renters. What's the average tenant stay here, and is there a school-zone premium baked into asking?
- Crime grade is D in this area — have there been break-ins, vandalism, or insurance claims at this property in the last 3 years? What carrier currently insures it and at what premium?
- The area grade is low — what's the realistic commute time and amenity access for the typical tenant pool here? Any planned neighborhood developments (good or bad) we should know about?
- What's the average days-on-market for RENTAL listings here right now (not sales)? A rising rental-DOM trend means longer vacancies and softer asking-rent achievability than the comps imply.
- What's the recent tenant-quality profile in this submarket — average credit score on applications, eviction rate, late-payment / NSF rate, and stable-employment percentage? A property-management company in the area should have these aggregated.
- How much new for-sale + rental construction is in the pipeline within 1–3 miles? Heavy new supply typically softens prices + rents 12–24 months out; constrained supply supports both.
Investment metrics
- 1% rule
- 11.76% ✓
- Cap rate
- 90.18%
- Cash-on-cash
- 299.58%
- DSCR
- 14.33
- GRM
- 0.7
CMA / ARV
No comps found within radius.
Projected returns pro-forma
-3.0% appreciation · 3.0% rent growth · sell at horizon
- IRR
- —
- Equity multiple
- 16.36×
- Total profit
- $146,258
- Equity at exit
- $5,070
- IRR
- —
- Equity multiple
- 35.02×
- Total profit
- $323,882
- Equity at exit
- $2,940
Cash invested: $9,520 (down + closing). Projections, not guarantees.
Landlord ↔ Tenant lean methodology
- Overall (STATE)
- 38 Tenant-Leaning
- State Colorado
- 38 Tenant-Leaning · D+4
- County
- — inherits STATE
- City
- — inherits STATE
ZIP-level market 80424
- Active inventory
- 614
- Price-to-rent
- 0.7×
Monthly cashflow live
- Estimated rent
- $3,997 medium interval (Pro) →
- Mortgage (P&I)
- −$178
- Tax est. 1.5%
- −$42 /mo · $510/yr
- Insurance
- −$14
- HOA
- −$546
- Vacancy / Maint / Mgmt
- −$839
- Net cashflow
- $2,377
Break-even live
UW: 25.0% down · 7.5% · 30yr · 1.5% tax · 5.0% vac · 8.0% maint · 8.0% mgmt
Financing live
Cash to close
- Down payment
- $8,500
- Closing costs
- $1,020
- Reserves months
- —
- Total cash needed
- —
Loan-product check · same deal, 3 products live
Conventional
25% down · 7.5% · 30yr
- Down + closing
- —
- Monthly P&I
- —
- Monthly cashflow
- —
- DSCR
- —
- Eligible?
- —
Personal DTI + credit; lowest rate.
DSCR
20% down · 8.5% · 30yr
- Down + closing
- —
- Monthly P&I
- —
- Monthly cashflow
- —
- DSCR
- —
- Eligible?
- —
No personal income docs; deal must DSCR.
Hard money
10% down · 12.0% · 12mo
- Down + closing
- —
- Monthly P&I
- —
- Monthly cashflow
- —
- DSCR
- —
- Eligible?
- —
Short-term bridge; refi at stabilization.
Rent comps 1 comps
| Address | Beds | Baths | Sqft | Rent | $/sqft | DOM | Units | Dist |
|---|---|---|---|---|---|---|---|---|
| 304 E. Washington RD Breckenridge, CO | 1.0–4.0 | 1.0–4.5 | 1760 | $5,783 | $3.29 | 2d | 2 | 0.49mi |
HOA detail
- Monthly dues
- $546 · $6,552/yr
Listing history 25 events
-
2026-06-19days on market $34,000 Active 213 DOM
-
2026-06-18days on market $34,000 Active 212 DOM
-
2026-06-17days on market $34,000 Active 211 DOM
-
2026-06-16days on market $34,000 Active 210 DOM
-
2026-06-15days on market $34,000 Active 209 DOM
-
2026-06-14days on market $34,000 Active 207 DOM
-
2026-06-12days on market $34,000 Active 206 DOM
-
2026-06-09days on market $34,000 Active 203 DOM
-
2026-06-08days on market $34,000 Active 202 DOM
-
2026-06-07days on market $34,000 Active 201 DOM
-
2026-06-05days on market $34,000 Active 198 DOM
-
2026-06-02days on market $34,000 Active 196 DOM
-
2026-06-01days on market $34,000 Active 195 DOM
-
2026-05-31days on market $34,000 Active 194 DOM
-
2026-05-30days on market $34,000 Active 193 DOM
-
2026-01-13price $34,000
-
2025-11-18$60,000 Active
-
2023-08-25status Active
-
2023-08-25status Active
-
2023-08-15historical
-
2023-08-09historical
-
2022-11-14$80,000 Active
-
2022-11-09$27,000 Active
-
2022-06-26$8,000 Active
-
2022-05-02$99,000 Active
ⓘ Source: listings_history table (triggers on properties + properties_extension) + one-shot
backfill from property_details.listing_events for pre-trigger history.
Nearby sold comps map
Loading sold comps map…
Walkable amenities ~0.75 mi
Loading nearby amenities…
Taxation est. · year 1
- Rental income
- $47,964
- − Mortgage interest
- −$1,905
- − Property taxes
- −$510
- − Insurance
- −$170
- − Repairs & maintenance
- −$3,837
- − Management
- −$3,837
- − HOA
- −$6,552
- − Depreciation
- −$989
- Taxable income
- $30,164
- Est. tax owed @ 24.0%
- −$7,239
- After-tax cash flow
- $21,281/yr
For passive investors: Depreciation is non-cash, so a rental often shows a tax loss while cash-flowing — sheltering income. Rental losses are passive: they offset passive income freely, and up to $25,000/yr can offset ordinary (W-2) income if you actively participate and your MAGI is under $100k (phasing out to $0 by $150k); unused losses carry forward. On sale, claimed depreciation is recaptured at up to 25%, and gains may owe capital-gains tax (a 1031 exchange can defer both). Figures are a year-1 estimate at your 24.0% rate — not tax advice; consult a CPA.
Schools (NCES district)
- District
- Summit School District No. RE-1
- NCES district ID
- 0806810
- Math proficiency
- 27% ▼ -7.00%
- Reading proficiency
- 43% ▼ -7.00%
- Median HH income
- $67,591
- Composite
- 31.97/100
- National rank
- #5840
- State rank
- #35 of 86 in CO
Livability — Breckenridge
- Score
- 72/100
- State rank
- #62
- US rank
- #6014
Category grades
Schools grade is shown separately in the Schools card above.
Census & demographics
- Census place
- Breckenridge, CO
- County
- Summit County · 31,352 people
- City population
- 9,764
- Metro
- Breckenridge, CO
- Population (ZIP)
- 9,764
- Household income
- $120,907
- Rent vs Own
- Severe rent burden
- 181.0
Population outlook (Summit County) Hauer SSP2
- Today (2025)
- 35,421 people
- By 2030
- 37,983 · +7.2%
- By 2040
- 42,597 · +20.3%
- By 2050
- 46,695 · +31.8%
- By 2075
- 55,288 · +56.1%
- By 2100
- 61,033 · +72.3%
Race, ethnicity, and origin ACS 2023
- Neighborhood character
- Predominantly White (82%)
- Race & ethnicity
- White 82% Two or more races 11% Hispanic / Latino 7% Asian 3% Pacific Islander 1%
- Hispanic origin (detail)
- Mexican 6%
- Common ancestry
- Romanian 4% Slovak 4% Scotch-Irish 3%
- Foreign-born
- 5% · Canada, Dominican Republic
- Languages at home
- 95% English-only · Spanish 5%
Political lean MEDSL · Summit
- 2024 margin
- Solid D (+37.2) · D 67.0% · R 29.9% · Other 3.1%
- 2008→2024 swing
- +4.1pp toward D · 2008: 33.0pp · 2024: 37.2pp
- All cycles
- 2024: D+37.2 2020: D+39.5 2016: D+27.6 2012: D+24.4 2008: D+33.0
Not yet ingested
- Civics
- —
Market trends
- HPI YoY
- ▼ -389.29%
- Current HPI
- 311.0453
- Rent YoY
- —
- Metro
- Breckenridge, CO
- State GDP YoY
- ▲ 1.95%
- F500 in state
- 14
Industry mix (Fortune 500 HQ in CO)
| Industry | F500 HQs | Revenue |
|---|---|---|
| Technology Distribution | 1 | $31B |
|
||
| Food / Agriculture | 1 | $18B |
|
||
| Packaging | 1 | $14B |
|
||
| Healthcare | 1 | $13B |
|
||
| Energy | 1 | $10B |
|
||
| Technology | 1 | $4B |
|
||
Price history
-65.7% since first listed10 events — show timeline
- 2026-01-13 Price Changed $34,000 SAR
- 2025-11-18 Listed $60,000 SAR
- 2023-08-25 Relisted — SAR
- 2023-08-25 Relisted — SAR
- 2023-08-15 Delisted — SAR
- 2023-08-09 Delisted — SAR
- 2022-11-14 Listed $80,000 SAR
- 2022-11-09 Listed $27,000 SAR
- 2022-06-26 Listed $8,000 SAR
- 2022-05-02 Listed $99,000 SAR
Property tax history
+5.6%/yrLatest (2025): $4,747 · +4.4% YoY. Source: county tax records.
Cash-flow waterfall
monthlySold comps — $/sqft
last 12 mo · ≤1 miLoading sold comps…