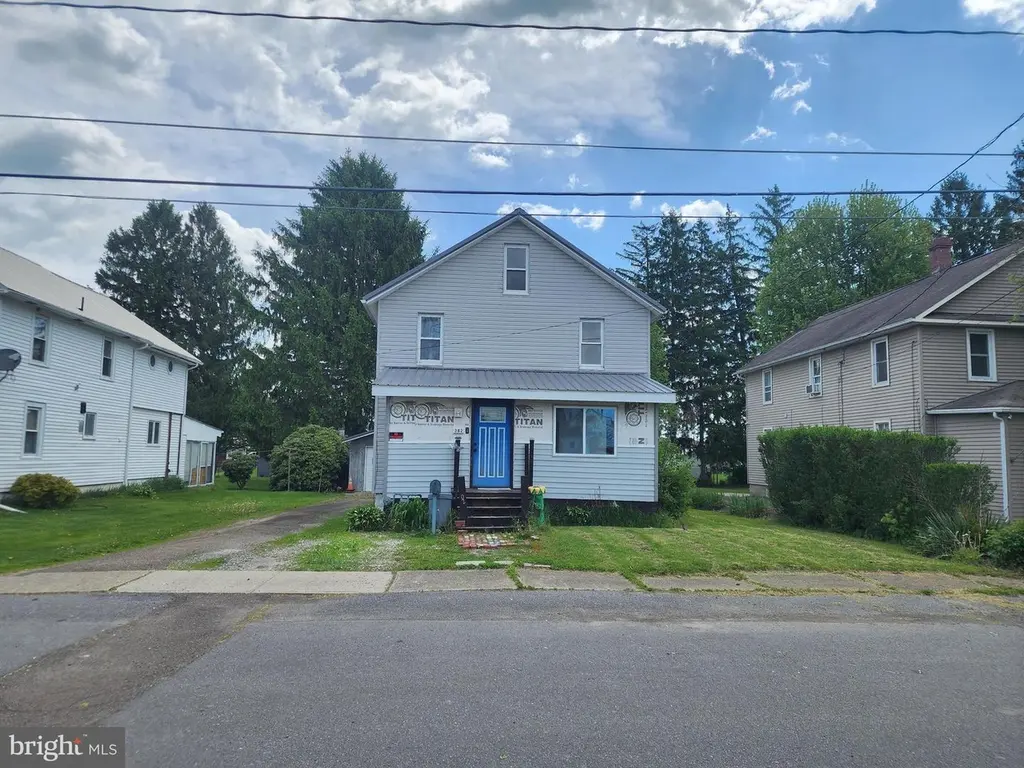
302 Proctor Ave · Elkland, PA
Flood risk 9/10 · Severe
- FEMA flood zone
- X (unshaded)
- Chance of flooding over 30 yrs
- 0.99%
- Est. flood insurance / yr
- $473 – $860
Fire risk 3/10 · Minor
- Est. fire insurance / yr
- $511 – $949
Heat risk 3/10 · Minor
- Hot days now (above 93°F)
- 8 days/yr
- Hot days in 30 yrs
- 18 days/yr
Wind risk 2/10 · Minimal
- Chance of severe wind over 30 yrs
- —
Air-quality risk 1/10 · Minimal
- Unhealthy air days now
- 0 days/yr
- Unhealthy air days in 30 yrs
- 0 days/yr
Risk factors via First Street. Map © Google.
Why this score? — see what drove the B grade
The composite is a weighted blend of 9 inputs, each scored 0–100. Each bar is that input's sub-score; the figure is the points it added to the 100-point composite (weight × sub-score).
- Cash flow +30.0/30.0
- 1% rule +10.0/10.0
- DSCR +10.0/10.0
- ARV discount +7.5/15.0
- Appreciation +5.2/10.0
- Schools +3.7/10.0
- Livability +3.2/5.0
- Rent growth +2.5/5.0
- Condition / age +2.5/5.0
$70,000
🖨 Deal sheet (PDF) 📄 Offer letter ✓ Due diligence
Listing remarks
Welcome to 302 Proctor Avenue — an incredible value opportunit for buyers looking to build equity fast. This move-in ready handyman special offers the perfect combination of immediate livability and upside potential. Whether you’re a first-time homebuyer, investor, landlord, or someone looking for an affordable property with room to improve over time, this home checks all the boxes. One of the standout features is the additional 624 square feet of basement space, providing endless possibilities for storage, a workshop, hobby area, home gym, finishing for additional living space, or future value-add potential. The home is functional and livable as-is, allowing a buyer to move rig
Key facts
- Workshop hobby area
- Home gym
- 7,680 sq ft lot
Tags
Property features AI
Finance
- Other: Ownership is fee simple; Pets allowed with no restrictions
Exterior
- Parking: Detached front-entry garage (1-car); Concrete driveway
- Utilities: Public water; Public sewer
- Home design: Detached home; Main entrance faces west
- Construction: Vinyl siding; Metal roof; Other foundation; Garage(s) listed as additional structure; Built year estimated
- Exterior features: Porch(es); Sidewalks; Level lot; Not in a federal flood zone
Interior
- Kitchen: Standard kitchen (appliances not specified)
- Bedrooms: Two bedrooms on the upper level
- Bathrooms: Two full bathrooms
- Heating & cooling: Forced air heating; Window air conditioning units (electric)
- Interior features: Living room; Dining room; Kitchen; Partial basement
- Laundry & utility: Hot water is electric
Neighborhood map
What this means for you Summary
Snapshot
- This is a 3-bed/2.0-bath single-family listed at $70k.
Deal economics
- At list price, monthly cash flow is $304 ($4k/yr) — positive.
- The deal already cash-flows at list — no discount required.
- Meets the 1% rule at list price ($1k rent vs $70k).
Location & tenants
- Location reads 65/100 on livability (#1,171 in PA) — a middle-class / working-renter tenant base. Strengths: cost of living A+, housing A+, health & safety A+; Watch: amenities F, commute F.
- Northern Tioga SD (rural): math 34% / reading 54% proficiency, ranked #301 of 539 in PA (top 56%) — families likely to look elsewhere, expect single-tenant / working-renter base with shorter leases.
- Zoned schools: Clark Wood El Sch (math 37% / reading 52%, grade F, #815 of 1,518 statewide, top 56%, 294 students, 100% FRL); Williamson Shs (math 26% / reading 50%, grade F, #285 of 437 statewide, top 65%, 535 students, 100% FRL) — zoned schools average 100% FRL vs 45% district-wide (55 pts higher); higher-poverty schools than district average — tighter screening recommended.
- Market conditions: 15 active listings in the ZIP; 32 units permitted in Tioga County in 2024 (0 in 5+ unit buildings).
Forward outlook
- In year one you build about $794 of equity ($484 loan paydown + $310 appreciation (0.4% local appreciation)).
- Tioga County population projected at -20% by 2050 — secular population decline; favor cash flow + early exit over multi-decade hold.
- At projected returns (0.4% appreciation + 3.0% rent growth), your $20k cash investment doubles in ~5 years — after that, you're playing with house money.
Negotiation context
- Only 11 days on market — expect competitive offers; lowballing is unlikely to land.
- Current owner paid $22k; list at $70k implies a 217% gain — meaningful room to come down on a strong offer.
Risks & watch-outs
- Watch-outs: property tax is 3.0% of price; flood insurance adds $56/mo; built in 1901 — expect roof / HVAC / electrical / plumbing capex.
- Climate carrying-cost: severe flood risk — expect insurance premiums to compound above CPI over the hold.
Questions for the listing agent
- Built in 1901 — when were the roof, HVAC, electrical panel, plumbing, and water heater last replaced?
- Property tax is high relative to price — has the assessment been appealed recently, and will the sale trigger a re-assessment?
- What's the actual annual flood-insurance premium (NFIP or private), and is the property in a SFHA with mandatory coverage?
- Is there a deadline driving the sale (1031 exchange, divorce, estate, relocation)? That informs how much negotiation room exists.
- Schools are D-rated, which usually means shorter tenancies and higher turnover. Who's the typical renter profile here, and what's been the actual vacancy rate?
- What's the average days-on-market for RENTAL listings here right now (not sales)? A rising rental-DOM trend means longer vacancies and softer asking-rent achievability than the comps imply.
- What's the recent tenant-quality profile in this submarket — average credit score on applications, eviction rate, late-payment / NSF rate, and stable-employment percentage? A property-management company in the area should have these aggregated.
- How much new for-sale + rental construction is in the pipeline within 1–3 miles? Heavy new supply typically softens prices + rents 12–24 months out; constrained supply supports both.
Investment metrics
- 1% rule
- 1.68% ✓
- Cap rate
- 12.45%
- Cash-on-cash
- 22.00%
- DSCR
- 1.98
- GRM
- 4.9
CMA / ARV
- ARV (on-the-fly)
- $160,888
- Comps found
- 6
Show comp detail 6 sales within ~0.75 mi
| Address | Dist | Beds/Ba | Sqft | Sold | Price | $/sf | Match |
|---|---|---|---|---|---|---|---|
| 409 E Main St | 0.26mi | 3/1.0 | 1,341 (-1%) | 2mo | $159,000 | $119 | 81 |
| 116 Coates Ave | 0.16mi | 3/2.0 | 1,370 (+1%) | 14mo | $135,000 | $99 | 79 |
| 232 Pattison Avenue Ext | 0.39mi | 3/1.0 | 1,380 (+2%) | 3mo | $60,000 | $43 | 72 |
| 119 First St | 0.38mi | 3/2.0 | 1,360 (+1%) | 21mo | $182,580 | $134 | 64 |
| 402 W Main St | 0.54mi | 4/2.0 (+1) | 1,380 (+2%) | 13mo | $135,000 | $98 | 55 |
| 206 W River St | 0.58mi | 3/2.0 | 1,496 (+11%) | 14mo | $195,000 | $130 | 44 |
Match score weights: distance 35% · size 25% · config 20% · recency 20%. Top-matched comps best support the ARV.
Projected returns pro-forma
0.44% appreciation · 3.0% rent growth · sell at horizon
- IRR
- 19.4%
- Equity multiple
- 1.96×
- Total profit
- $18,875
- Equity at exit
- $21,891
- IRR
- 23.3%
- Equity multiple
- 3.69×
- Total profit
- $52,655
- Equity at exit
- $27,598
Cash invested: $19,600 (down + closing). Projections, not guarantees.
Landlord ↔ Tenant lean methodology
- Overall (STATE)
- 62 Landlord-Friendly
- State Pennsylvania
- 62 Landlord-Friendly · EVEN
- County
- — inherits STATE
- City
- — inherits STATE
ZIP-level market 16920
- Home prices YoY
- 0.2%
- Active inventory
- 15
- Price-to-rent
- 4.9×
Monthly cashflow live
- Estimated rent
- $1,179 medium interval (Pro) →
- Mortgage (P&I)
- −$367
- Tax from tax record
- −$176 /mo · $2,111/yr
- Insurance
- −$29
- Flood insurance flood zone
- −$56 /mo · $666/yr
- HOA
- −$0
- Vacancy / Maint / Mgmt
- −$248
- Net cashflow
- $304
Break-even live
Sensitivity live
| Price | -10% $343 | -5% $324 | +0% $304 | +5% $284 | +10% $264 |
|---|---|---|---|---|---|
| Rent | -10% $211 | -5% $257 | +0% $304 | +5% $350 | +10% $397 |
| Rate | -1.0pp $339 | -0.5pp $322 | base $304 | +0.5pp $286 | +1.0pp $267 |
UW: 25.0% down · 7.5% · 30yr · 1.5% tax · 5.0% vac · 8.0% maint · 8.0% mgmt
Financing live
Cash to close
- Down payment
- $17,500
- Closing costs
- $2,100
- Reserves months
- —
- Total cash needed
- —
Loan-product check · same deal, 3 products live
Conventional
25% down · 7.5% · 30yr
- Down + closing
- —
- Monthly P&I
- —
- Monthly cashflow
- —
- DSCR
- —
- Eligible?
- —
Personal DTI + credit; lowest rate.
DSCR
20% down · 8.5% · 30yr
- Down + closing
- —
- Monthly P&I
- —
- Monthly cashflow
- —
- DSCR
- —
- Eligible?
- —
No personal income docs; deal must DSCR.
Hard money
10% down · 12.0% · 12mo
- Down + closing
- —
- Monthly P&I
- —
- Monthly cashflow
- —
- DSCR
- —
- Eligible?
- —
Short-term bridge; refi at stabilization.
Listing history 9 events
-
2026-06-21days on market $70,000 Active 11 DOM
-
2026-06-21days on market $70,000 Active 10 DOM
-
2026-06-18days on market $70,000 Active 8 DOM
-
2026-06-17days on market $70,000 Active 7 DOM
-
2026-06-16days on market $70,000 Active 6 DOM
-
2026-06-15days on market $70,000 Active 5 DOM
-
2026-06-13days on market $70,000 Active 3 DOM
-
2026-06-12remarks 687-char remark
-
2026-06-12$70,000 Active 2 DOM
ⓘ Source: listings_history table (triggers on properties + properties_extension) + one-shot
backfill from property_details.listing_events for pre-trigger history.
Tax reassessment forecast PA · Partial reset (capped growth)
- Current annual tax
- $2,111 · $176/mo
- Projected year-2 tax
- $2,111 · $176/mo
- Expected delta
- $0/yr ($0/mo · 0.0%)
ⓘ Screening estimate from a state-policy table — verify with the county assessor before closing.
Climate risk First Street
- Flood 9/10 Extreme FEMA zone X (unshaded) · 99% chance over 30 yrs
- Wildfire 3/10 Moderate
- Heat 3/10 Moderate 8 d/yr ≥93°F today · 18 d/yr by 30 yrs out
- Wind 2/10 Low
- Air quality 1/10 Low 0 unhealthy d/yr today · 0 by 30 yrs out
Nearby sold comps map
Loading sold comps map…
Walkable amenities ~0.75 mi
Loading nearby amenities…
Taxation est. · year 1
- Rental income
- $14,148
- − Mortgage interest
- −$3,921
- − Property taxes
- −$2,111
- − Insurance
- −$1,016
- − Repairs & maintenance
- −$1,132
- − Management
- −$1,132
- − Depreciation
- −$2,036
- Taxable income
- $2,800
- Est. tax owed @ 24.0%
- −$672
- After-tax cash flow
- $2,973/yr
For passive investors: Depreciation is non-cash, so a rental often shows a tax loss while cash-flowing — sheltering income. Rental losses are passive: they offset passive income freely, and up to $25,000/yr can offset ordinary (W-2) income if you actively participate and your MAGI is under $100k (phasing out to $0 by $150k); unused losses carry forward. On sale, claimed depreciation is recaptured at up to 25%, and gains may owe capital-gains tax (a 1031 exchange can defer both). Figures are a year-1 estimate at your 24.0% rate — not tax advice; consult a CPA.
Schools (NCES district)
- District
- Northern Tioga SD
- NCES district ID
- 4217730
- Math proficiency
- 34% ▼ -4.00%
- Reading proficiency
- 54% ▼ -4.00%
- Median HH income
- $41,816
- Composite
- 36.95/100
- National rank
- #4534
- State rank
- #301 of 539 in PA
Livability — Elkland
- Score
- 65/100
- State rank
- #1171
- US rank
- #13602
Category grades
Schools grade is shown separately in the Schools card above.
Census & demographics
- Census place
- Elkland, PA
- Population (ZIP)
- 1,749
Population outlook (Tioga County) Hauer SSP2
- Today (2025)
- 40,253 people
- By 2030
- 38,795 · -3.6%
- By 2040
- 35,376 · -12.1%
- By 2050
- 32,081 · -20.3%
- By 2075
- 24,341 · -39.5%
- By 2100
- 17,180 · -57.3%
Race, ethnicity, and origin ACS 2023
- Neighborhood character
- Predominantly White (95%)
- Race & ethnicity
- White 95% Hispanic / Latino 3% Two or more races 3%
- Common ancestry
- Romanian 3% Slovak 3% Portuguese 2%
- Foreign-born
- 0%
Political lean MEDSL · Tioga
- 2024 margin
- Solid R (+51.8) · D 23.6% · R 75.4% · Other 1.0%
- 2008→2024 swing
- -24.3pp toward R · 2008: -27.4pp · 2024: -51.8pp
- All cycles
- 2024: R+51.8 2020: R+51.2 2016: R+53.6 2012: R+34.8 2008: R+27.4
Not yet ingested
- Civics
- —
Market trends
- HPI YoY
- ▲ 0.44%
- Current HPI
- 237.1456
- Rent YoY
- —
- Metro
- —
- State GDP YoY
- ▲ 1.68%
- F500 in state
- 34
Industry mix (Fortune 500 HQ in PA)
| Industry | F500 HQs | Revenue |
|---|---|---|
| Healthcare | 2 | $309B |
|
||
| Insurance | 2 | $27B |
|
||
| Telecommunications / Media | 1 | $124B |
|
||
| Industrial Distribution | 1 | $22B |
|
||
| Financial Services | 1 | $20B |
|
||
| Chemicals / Materials | 1 | $18B |
|
||
Price history
+217.1% since first listed2 events — show timeline
- 2026-06-10 Listed $70,000 BRIGHT MLS
- 1991-01-31 Sold (Public Records) $22,074 Public Records
Property tax history
+5.1%/yrLatest (2026): $2,111 · +1.5% YoY. Source: county tax records.
Cash-flow waterfall
monthlySold comps — $/sqft
last 12 mo · ≤1 miLoading sold comps…