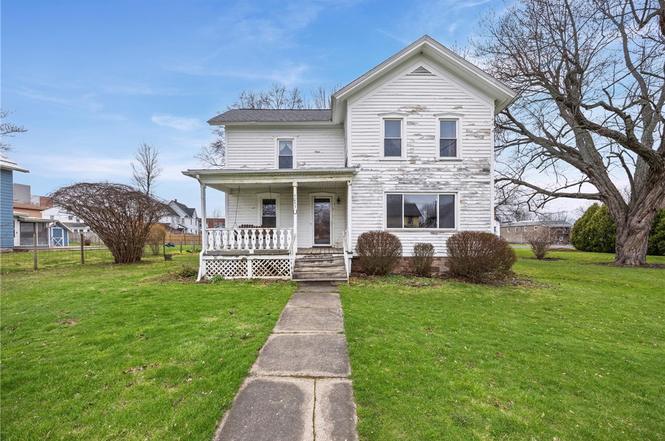
5043 Gray St · North Rose, NY
Flood risk 1/10 · Minimal
- FEMA flood zone
- —
- Chance of flooding over 30 yrs
- 0.0%
- Est. flood insurance / yr
- —
Fire risk 3/10 · Minor
- Est. fire insurance / yr
- $691 – $1,283
Heat risk 2/10 · Minimal
- Hot days now (above 96°F)
- 7 days/yr
- Hot days in 30 yrs
- 16 days/yr
Wind risk 1/10 · Minimal
- Chance of severe wind over 30 yrs
- —
Air-quality risk 2/10 · Minimal
- Unhealthy air days now
- 1 days/yr
- Unhealthy air days in 30 yrs
- 2 days/yr
Risk factors via First Street. Map © Google.
Why this score? — see what drove the B- grade
The composite is a weighted blend of 9 inputs, each scored 0–100. Each bar is that input's sub-score; the figure is the points it added to the 100-point composite (weight × sub-score).
- Cash flow +22.3/30.0
- ARV discount +15.0/15.0
- DSCR +7.1/10.0
- 1% rule +6.2/10.0
- Appreciation +5.7/10.0
- Schools +3.5/10.0
- Livability +3.1/5.0
- Rent growth +2.5/5.0
- Condition / age +2.5/5.0
$149,900
🖨 Deal sheet 📄 Offer letter ✓ Due diligence
Listing remarks
Welcome to 5043 Gray Street -Where opportunity meets charm! This classic colonial offers 3 bedrooms, 1.5 baths, and bright, sun-filled spaces throughout. The living room features a cozy wood-burning stove, and the formal dining room is perfect for hosting family and friends. The spacious eat-in kitchen includes all appliances and gives you the room to create the heart of the home you’ve been envisioning. Convenience shines with first-floor laundry, a powder room, and a flexible office/bedroom option on the main level. Upstairs, the primary bedroom includes a bonus room—an ideal nursery, walk-in closet, home office, or whatever flex space your life calls for. An additional bedroo
Key facts
- Eat in kitchen
- First floor laundry
- Bonus room
Tags
Property features AI
Exterior
- Parking: Detached garage; 2-car garage
- Utilities: Public water connected; Septic tank; Circuit breaker electric; Cable available; High-speed internet available
- Home design: 2-story home; Resale property; Architectural shingle roof
- Construction: Wood siding; Spray foam insulation; Copper plumbing; Stone foundation; Existing (year built details)
- Exterior features: Gravel driveway; Open porch
Interior
- Kitchen: Gas oven; Gas range; Refrigerator; Eat-in kitchen layout
- Bedrooms: 6 total rooms including living space, office and laundry
- Flooring: Carpet; Laminate; Vinyl; Varies
- Bathrooms: 1 full bathroom; 1 half bathroom; One main-level bathroom
- Heating & cooling: Gas forced-air heating
- Interior features: Ceiling fans; Separate/formal dining room; Eat-in kitchen; Separate/formal living room; Home office; Thermal windows
- Laundry & utility: Main-level laundry
Neighborhood map
What this means for you Summary
Snapshot
- This is a 4-bed/1.5-bath single-family listed at $150k.
Deal economics
- At list price, monthly cash flow is $246 ($3k/yr) — positive.
- The deal already cash-flows at list — no discount required.
- Meets the 1% rule at list price ($2k rent vs $150k).
- Recommended offer: $132k (12.0% below list) — sets the bar for market timing.
Location & tenants
- Location reads 61/100 on livability (#904 in NY) — a middle-class / working-renter tenant base. Strengths: cost of living A+, housing B+; Watch: commute D, schools D-, crime F.
- North Rose-Wolcott Central School District (rural): math 43% / reading 38% proficiency, ranked #514 of 590 in NY (top 87%) — families likely to look elsewhere, expect single-tenant / working-renter base with shorter leases.
- Market conditions: 12 active listings in the ZIP; 259 units permitted in Wayne County in 2024 (90 in 5+ unit buildings).
Forward outlook
- In year one you build about $3k of equity ($1k loan paydown + $2k appreciation (1.4% local appreciation)).
- Wayne County population projected at -24% by 2050 — secular population decline; favor cash flow + early exit over multi-decade hold.
- At projected returns (1.4% appreciation + 3.0% rent growth), your $42k cash investment doubles in ~6 years — after that, you're playing with house money.
- By year 10, paydown + projected appreciation supports a ~$32k cash-out refi (75% LTV) — recoverable capital for the next deal without selling this one.
Negotiation context
- It's been on market 196 days — a 12% lower offer ($132k) is reasonable based on typical stale-listing flexibility.
- 2 sale attempts with the ask held roughly flat each time — persistent listings suggest the price (not the market) is what's stuck; bring a comps-based counter.
- Current owner paid $48k; list at $150k implies a 213% gain — meaningful room to come down on a strong offer.
Risks & watch-outs
- Watch-outs: built in 1900 — expect roof / HVAC / electrical / plumbing capex.
Questions for the listing agent
- It's been on market 196 days. Have you received any prior offers? Is the seller open to a 12% concession, seller financing, or rate buy-down credit?
- Built in 1900 — when were the roof, HVAC, electrical panel, plumbing, and water heater last replaced?
- Why hasn't it sold? Are there any deal-killer items the seller is aware of (foundation, flood, title, zoning, code violations)?
- Is there a deadline driving the sale (1031 exchange, divorce, estate, relocation)? That informs how much negotiation room exists.
- Schools are D-rated, which usually means shorter tenancies and higher turnover. Who's the typical renter profile here, and what's been the actual vacancy rate?
- Crime grade is F in this area — have there been break-ins, vandalism, or insurance claims at this property in the last 3 years? What carrier currently insures it and at what premium?
- What's the average days-on-market for RENTAL listings here right now (not sales)? A rising rental-DOM trend means longer vacancies and softer asking-rent achievability than the comps imply.
- What's the recent tenant-quality profile in this submarket — average credit score on applications, eviction rate, late-payment / NSF rate, and stable-employment percentage? A property-management company in the area should have these aggregated.
- How much new for-sale + rental construction is in the pipeline within 1–3 miles? Heavy new supply typically softens prices + rents 12–24 months out; constrained supply supports both.
Investment metrics
- 1% rule
- 1.12% ✓
- Cap rate
- 8.26%
- Cash-on-cash
- 7.04%
- DSCR
- 1.31
- GRM
- 7.5
CMA / ARV
- ARV (on-the-fly)
- $190,240
- Comps found
- 2
Show comp detail 2 sales within ~0.75 mi
| Address | Dist | Beds/Ba | Sqft | Sold | Price | $/sf | Match |
|---|---|---|---|---|---|---|---|
| 4159 N Main St | 0.12mi | 3/2.0 (-1) | 1,744 (+6%) | 7mo | $125,000 | $72 | 71 |
| 5139 Gray St | 0.23mi | 3/2.0 (-1) | 1,728 (+5%) | 11mo | $200,290 | $116 | 64 |
Match score weights: distance 35% · size 25% · config 20% · recency 20%. Top-matched comps best support the ARV.
Projected returns pro-forma
1.39% appreciation · 3.0% rent growth · sell at horizon
- IRR
- 9.8%
- Equity multiple
- 1.51×
- Total profit
- $21,454
- Equity at exit
- $54,272
- IRR
- 13.4%
- Equity multiple
- 2.69×
- Total profit
- $70,884
- Equity at exit
- $74,583
Cash invested: $41,972 (down + closing). Projections, not guarantees.
Landlord ↔ Tenant lean methodology
- Overall (STATE)
- 15 Strongly Tenant-Friendly
- State New York
- 15 Strongly Tenant-Friendly · D+10
- County
- — inherits STATE
- City
- — inherits STATE
ZIP-level market 14516
- Home prices YoY
- 0.6%
- Active inventory
- 12
- Price-to-rent
- 7.5×
Monthly cashflow live
- Estimated rent
- $1,676 medium interval (Pro) →
- Mortgage (P&I)
- −$786
- Tax from tax record
- −$229 /mo · $2,747/yr
- Insurance
- −$62
- HOA
- −$0
- Vacancy / Maint / Mgmt
- −$352
- Net cashflow
- $246
Break-even live
UW: 25.0% down · 7.5% · 30yr · 1.5% tax · 5.0% vac · 8.0% maint · 8.0% mgmt
Financing live
Cash to close
- Down payment
- $37,475
- Closing costs
- $4,497
- Reserves months
- —
- Total cash needed
- —
Loan-product check · same deal, 3 products live
Conventional
25% down · 7.5% · 30yr
- Down + closing
- —
- Monthly P&I
- —
- Monthly cashflow
- —
- DSCR
- —
- Eligible?
- —
Personal DTI + credit; lowest rate.
DSCR
20% down · 8.5% · 30yr
- Down + closing
- —
- Monthly P&I
- —
- Monthly cashflow
- —
- DSCR
- —
- Eligible?
- —
No personal income docs; deal must DSCR.
Hard money
10% down · 12.0% · 12mo
- Down + closing
- —
- Monthly P&I
- —
- Monthly cashflow
- —
- DSCR
- —
- Eligible?
- —
Short-term bridge; refi at stabilization.
Listing history 19 events
-
2026-06-18days on market $149,900 Active 196 DOM
-
2026-06-17days on market $149,900 Active 195 DOM
-
2026-06-16days on market $149,900 Active 194 DOM
-
2026-06-15days on market $149,900 Active 193 DOM
-
2026-06-13days on market $149,900 Active 191 DOM
-
2026-06-12days on market $149,900 Active 190 DOM
-
2026-06-09days on market $149,900 Active 187 DOM
-
2026-06-08days on market $149,900 Active 186 DOM
-
2026-06-07days on market $149,900 Active 185 DOM
-
2026-06-05days on market $149,900 Active 183 DOM
-
2026-06-04days on market $149,900 Active 181 DOM
-
2026-06-02days on market $149,900 Active 180 DOM
-
2026-06-01days on market $149,900 Active 179 DOM
-
2026-05-31days on market $149,900 Active 178 DOM
-
2026-04-01price $149,900
-
2025-12-04$154,900 Active
-
2025-08-12historical
-
2025-07-02$166,000 Active
-
1999-02-26soldstatus $47,900
ⓘ Source: listings_history table (triggers on properties + properties_extension) + one-shot
backfill from property_details.listing_events for pre-trigger history.
Tax reassessment forecast NY · Partial reset (capped growth)
- Current annual tax
- $2,747 · $229/mo
- Projected year-2 tax
- $2,747 · $229/mo
- Expected delta
- $0/yr ($0/mo · 0.0%)
ⓘ Screening estimate from a state-policy table — verify with the county assessor before closing.
Climate risk First Street
- Flood 1/10 Low 0% chance over 30 yrs
- Wildfire 3/10 Moderate
- Heat 2/10 Low 7 d/yr ≥96°F today · 16 d/yr by 30 yrs out
- Wind 1/10 Low
- Air quality 2/10 Low 1 unhealthy d/yr today · 2 by 30 yrs out
Nearby sold comps map
Loading sold comps map…
Walkable amenities ~0.75 mi
Loading nearby amenities…
Taxation est. · year 1
- Rental income
- $20,108
- − Mortgage interest
- −$8,397
- − Property taxes
- −$2,747
- − Insurance
- −$750
- − Repairs & maintenance
- −$1,609
- − Management
- −$1,609
- − Depreciation
- −$4,361
- Taxable income
- $637
- Est. tax owed @ 24.0%
- −$153
- After-tax cash flow
- $2,803/yr
For passive investors: Depreciation is non-cash, so a rental often shows a tax loss while cash-flowing — sheltering income. Rental losses are passive: they offset passive income freely, and up to $25,000/yr can offset ordinary (W-2) income if you actively participate and your MAGI is under $100k (phasing out to $0 by $150k); unused losses carry forward. On sale, claimed depreciation is recaptured at up to 25%, and gains may owe capital-gains tax (a 1031 exchange can defer both). Figures are a year-1 estimate at your 24.0% rate — not tax advice; consult a CPA.
Schools (NCES district)
- District
- North Rose-Wolcott Central School District
- NCES district ID
- 3616980
- Math proficiency
- 43% ▬ 0.00%
- Reading proficiency
- 38% ▲ 3.00%
- Median HH income
- $47,545
- Composite
- 34.7/100
- National rank
- #5140
- State rank
- #514 of 590 in NY
Livability — North Rose
- Score
- 61/100
- State rank
- #904
- US rank
- #17636
Category grades
Schools grade is shown separately in the Schools card above.
Census & demographics
- Census place
- North Rose, NY
- Population (ZIP)
- 2,184
Population outlook (Wayne County) Hauer SSP2
- Today (2025)
- 85,662 people
- By 2030
- 81,945 · -4.3%
- By 2040
- 73,735 · -13.9%
- By 2050
- 65,029 · -24.1%
- By 2075
- 47,451 · -44.6%
- By 2100
- 31,574 · -63.1%
Race, ethnicity, and origin ACS 2023
- Neighborhood character
- Predominantly White (88%)
- Race & ethnicity
- White 88% Black 7% Asian 2% Hispanic / Latino 2% Two or more races 1%
- Common ancestry
- Iranian 8% Italian 2% Serbian 2%
- Foreign-born
- 3% · China, Canada
- Languages at home
- 96% English-only · Spanish 2% German/W. Germanic 2%
Political lean MEDSL · Wayne
- 2024 margin
- Strong R (+23.1) · D 38.5% · R 61.5%
- 2008→2024 swing
- -13.2pp toward R · 2008: -9.9pp · 2024: -23.1pp
- All cycles
- 2024: R+23.1 2020: R+19.6 2016: R+26.1 2012: R+9.3 2008: R+9.9
Not yet ingested
- Civics
- —
Market trends
- HPI YoY
- ▲ 1.39%
- Current HPI
- 217.5757
- Rent YoY
- —
- Metro
- —
- State GDP YoY
- ▲ 2.60%
- F500 in state
- 92
Industry mix (Fortune 500 HQ in NY)
| Industry | F500 HQs | Revenue |
|---|---|---|
| Financial Services | 10 | $950B |
|
||
| Consumer Goods | 9 | $162B |
|
||
| Insurance | 4 | $225B |
|
||
| Telecommunications | 2 | $144B |
|
||
| Pharmaceuticals | 2 | $112B |
|
||
| Media / Entertainment | 2 | $69B |
|
||
Price history
+212.9% since first listed5 events — show timeline
- 2026-04-01 Price Changed $149,900 UNYREIS
- 2025-12-04 Listed $154,900 UNYREIS
- 2025-08-12 Listing Removed — UNYREIS
- 2025-07-02 Listed $166,000 UNYREIS
- 1999-02-26 Sold (Public Records) $47,900 Public Records
Property tax history
+4.4%/yrLatest (2025): $2,747 · +15.8% YoY. Source: county tax records.
Cash-flow waterfall
monthlySold comps — $/sqft
last 12 mo · ≤1 miLoading sold comps…