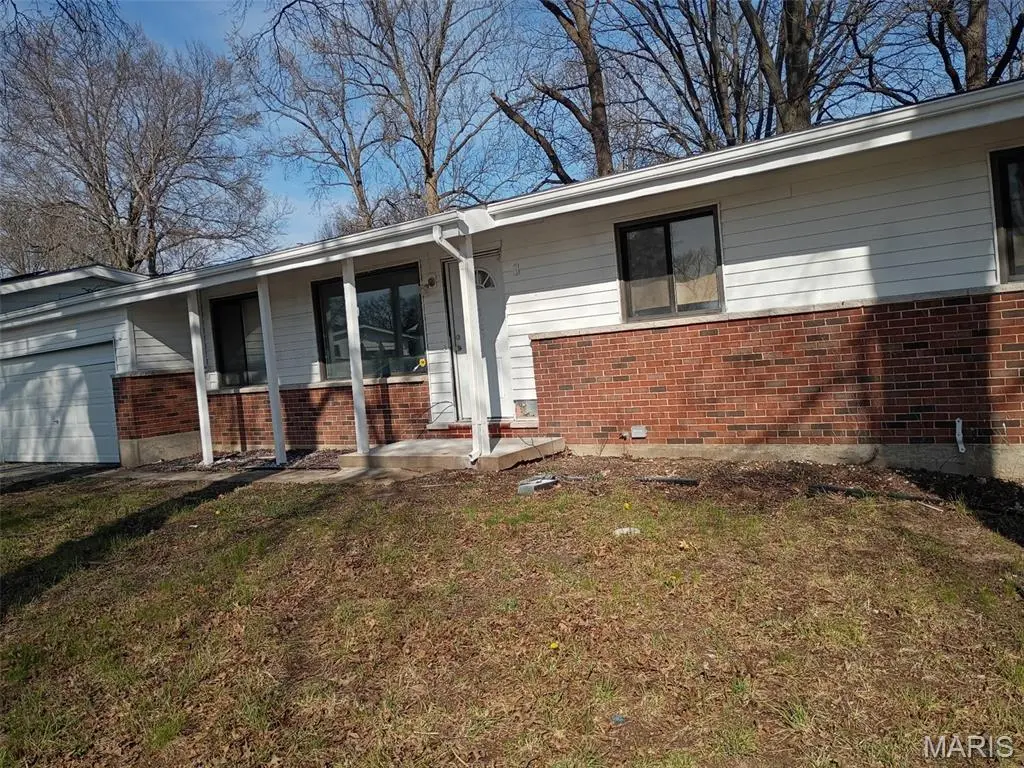
10804 Linnell Dr · Bellefontaine Neighbors, MO
Flood risk 1/10 · Minimal
- FEMA flood zone
- X (unshaded)
- Chance of flooding over 30 yrs
- 0.0%
- Est. flood insurance / yr
- $473 – $860
Fire risk 1/10 · Minimal
- Est. fire insurance / yr
- $1,054 – $1,958
Heat risk 5/10 · Moderate
- Hot days now (above 107°F)
- 7 days/yr
- Hot days in 30 yrs
- 21 days/yr
Wind risk 2/10 · Minimal
- Chance of severe wind over 30 yrs
- 1.0%
Air-quality risk 3/10 · Minor
- Unhealthy air days now
- 3 days/yr
- Unhealthy air days in 30 yrs
- 5 days/yr
Risk factors via First Street. Map © Google.
Why this score? — see what drove the B grade
The composite is a weighted blend of 9 inputs, each scored 0–100. Each bar is that input's sub-score; the figure is the points it added to the 100-point composite (weight × sub-score).
- Cash flow +26.0/30.0
- ARV discount +15.0/15.0
- DSCR +8.7/10.0
- 1% rule +7.0/10.0
- Appreciation +6.9/10.0
- Rent growth +3.7/5.0
- Livability +2.9/5.0
- Condition / age +2.5/5.0
- Schools +1.7/10.0
$125,000
🖨 Deal sheet 📄 Offer letter ✓ Due diligence
Listing remarks MLS
Welcome to 10804 Linnell Drive-where opportunity meets imagination! This 4 bedroom, 2 bath home is ready for its next chapter and just waiting for the right buyer to bring it back to life. With a spacious layout, generous room sizes and a nice sized lot, there's plenty of room to create something special. Calling all investors, flippers and visionaries-this one is your blank canvas! Whether you're looking to renovate and resell, build your rental portfolio, or design your dream home, the possibilities here are endless. Property is being sold as-is. Seller to make no repairs, inspections, or warranties. Special Sales Contract preferred. Utilities may not be on for inspections. Please use caution when showing. Convenient location with easy access to major highways, shopping, and amenities. With the right updates, this property presents as an excellent opportunity for rental income or your primary residence. Bring your ideas, your contractor, and your vision-this is the one you've been waiting for! Schedule through MLS. Proof of funds or pre-approval required with offers. All offers will be reviewed by 6:00 PM Sunday, April 12, 2026 after the open house. Great FHA203k opportunity. Sizeable work already completed.
Key facts
- 8,293 sq ft lot
- 2 garage spots
- Built 1959
Neighborhood map
What this means for you Summary
Snapshot
- This is a 3-bed/2.0-bath single-family listed at $125k.
Deal economics
- At list price, monthly cash flow is $311 ($4k/yr) — positive.
- The deal already cash-flows at list — no discount required.
- Meets the 1% rule at list price ($2k rent vs $125k).
- Recommended offer: $118k (6.0% below list) — sets the bar for market timing.
Location & tenants
- Location reads 58/100 on livability (#592 in MO) — a working-class tenant base; expect higher turnover. Strengths: cost of living A+, housing B+; Watch: employment D+, schools F, crime F.
- Hazelwood (suburban): math 11% / reading 26% proficiency, ranked #306 of 324 in MO (top 94%) — low school quality limits family demand, transient renter base, plan for 1-2y turnover.
- Market conditions: Rents rising fast (+5.0%/yr); 372 active listings in the ZIP; 35 comparable units currently listed for rent nearby; rentals at typical pace (median 24d on market — plan ~3-4 weeks tenant-placement turnaround); lower-income renter base — watch delinquency; 920 units permitted in St. Louis County in 2024 (250 in 5+ unit buildings).
- This rent runs 44% of the median local income ($41k/yr) — at the standard rent-burdened threshold; future hikes will face affordability resistance.
Forward outlook
- In year one you build about $6k of equity ($864 loan paydown + $5k appreciation (3.8% local appreciation)).
- At projected returns (3.8% appreciation + 5.0% rent growth), your $35k cash investment doubles in ~4 years — after that, you're playing with house money.
- By year 7, paydown + projected appreciation supports a ~$36k cash-out refi (75% LTV) — recoverable capital for the next deal without selling this one.
Negotiation context
- It's been on market 70 days — a 6% lower offer ($118k) is reasonable based on typical stale-listing flexibility.
- 2 sale attempts since 8y ago with the ask held roughly flat each time — persistent listings suggest the price (not the market) is what's stuck; bring a comps-based counter.
- Current owner paid $70k; list at $125k implies a 79% gain — meaningful room to come down on a strong offer.
Risks & watch-outs
- Watch-outs: built in 1959 — expect roof / HVAC / electrical / plumbing capex.
- Climate carrying-cost: extreme-heat days projected 7→21/yr by 2055 (HVAC capex compounding) — expect insurance premiums to compound above CPI over the hold.
Questions for the listing agent
- It's been on market 70 days. Have you received any prior offers? Is the seller open to a 6% concession, seller financing, or rate buy-down credit?
- Built in 1959 — when were the roof, HVAC, electrical panel, plumbing, and water heater last replaced?
- Why hasn't it sold? Are there any deal-killer items the seller is aware of (foundation, flood, title, zoning, code violations)?
- Is there a deadline driving the sale (1031 exchange, divorce, estate, relocation)? That informs how much negotiation room exists.
- Schools are F-rated, which usually means shorter tenancies and higher turnover. Who's the typical renter profile here, and what's been the actual vacancy rate?
- Crime grade is F in this area — have there been break-ins, vandalism, or insurance claims at this property in the last 3 years? What carrier currently insures it and at what premium?
- What's the average days-on-market for RENTAL listings here right now (not sales)? A rising rental-DOM trend means longer vacancies and softer asking-rent achievability than the comps imply.
- What's the recent tenant-quality profile in this submarket — average credit score on applications, eviction rate, late-payment / NSF rate, and stable-employment percentage? A property-management company in the area should have these aggregated.
- How much new for-sale + rental construction is in the pipeline within 1–3 miles? Heavy new supply typically softens prices + rents 12–24 months out; constrained supply supports both.
Investment metrics
- 1% rule
- 1.20% ✓
- Cap rate
- 9.27%
- Cash-on-cash
- 10.65%
- DSCR
- 1.47
- GRM
- 6.9
CMA / ARV
- ARV (median comp)
- $151,646
- List price
- $125,000
- Delta
- -17.57%
- Verdict
- UNDERPRICED
- Comps
- 20 within 1.0 mi
Show comp detail 12 sales within ~0.75 mi
| Address | Dist | Beds/Ba | Sqft | Sold | Price | $/sf | Match |
|---|---|---|---|---|---|---|---|
| 2291 Heritage Dr | 0.08mi | 3/2.0 | 1,276 (0%) | 7mo | $159,000 | $125 | 90 |
| 2241 Luxmore Dr | 0.16mi | 4/3.0 (+1) | 1,276 (0%) | 2mo | $187,500 | $147 | 82 |
| 2270 Ainsworth Dr | 0.19mi | 4/3.0 (+1) | 1,276 (0%) | 2mo | $94,900 | $74 | 80 |
| 11079 Worchester Dr | 0.37mi | 3/2.0 | 1,327 (+4%) | 4mo | $173,000 | $130 | 73 |
| 2559 Burchard Dr | 0.27mi | 3/2.5 | 1,350 (+6%) | 7mo | $190,000 | $141 | 70 |
| 10626 Landseer Dr | 0.25mi | 3/2.0 | 1,401 (+10%) | 5mo | $121,000 | $86 | 68 |
| 11148 Linnell Dr | 0.58mi | 3/1.5 | 1,302 (+2%) | 2mo | $186,500 | $143 | 66 |
| 11008 Saginaw Dr | 0.39mi | 4/2.0 (+1) | 1,344 (+5%) | 6mo | $154,900 | $115 | 62 |
| 10618 Woodwind Dr | 0.51mi | 3/2.0 | 1,406 (+10%) | 0mo | $129,900 | $92 | 59 |
| 11129 Old Halls Ferry Rd | 0.63mi | 3/1.0 | 1,216 (-5%) | 6mo | $75,000 | $62 | 53 |
| 11100 Landseer Dr | 0.47mi | 3/2.0 | 1,116 (-12%) | 6mo | $187,000 | $168 | 52 |
| 2633 Hadden Dr | 0.62mi | 3/3.0 | 1,164 (-9%) | 7mo | $120,000 | $103 | 46 |
Match score weights: distance 35% · size 25% · config 20% · recency 20%. Top-matched comps best support the ARV.
Projected returns pro-forma
3.79% appreciation · 4.97% rent growth · sell at horizon
- IRR
- 20.5%
- Equity multiple
- 2.23×
- Total profit
- $43,209
- Equity at exit
- $61,849
- IRR
- 22.1%
- Equity multiple
- 4.56×
- Total profit
- $124,633
- Equity at exit
- $99,958
Cash invested: $35,000 (down + closing). Projections, not guarantees.
Landlord ↔ Tenant lean methodology
- Overall (STATE)
- 81 Strongly Landlord-Friendly
- State Missouri
- 81 Strongly Landlord-Friendly · R+10
- County
- — inherits STATE
- City
- — inherits STATE
ZIP-level market 63136
- Home prices YoY
- 0.9%
- Rents YoY
- 5.0%
- Active inventory
- 372
- Price-to-rent
- 6.9×
Monthly cashflow live
- Estimated rent
- $1,504 high interval (Pro) →
- Mortgage (P&I)
- −$656
- Tax from tax record
- −$170 /mo · $2,038/yr
- Insurance
- −$52
- HOA
- −$0
- Vacancy / Maint / Mgmt
- −$316
- Net cashflow
- $311
Break-even live
UW: 25.0% down · 7.5% · 30yr · 1.5% tax · 5.0% vac · 8.0% maint · 8.0% mgmt
Financing live
Cash to close
- Down payment
- $31,250
- Closing costs
- $3,750
- Reserves months
- —
- Total cash needed
- —
Loan-product check · same deal, 3 products live
Conventional
25% down · 7.5% · 30yr
- Down + closing
- —
- Monthly P&I
- —
- Monthly cashflow
- —
- DSCR
- —
- Eligible?
- —
Personal DTI + credit; lowest rate.
DSCR
20% down · 8.5% · 30yr
- Down + closing
- —
- Monthly P&I
- —
- Monthly cashflow
- —
- DSCR
- —
- Eligible?
- —
No personal income docs; deal must DSCR.
Hard money
10% down · 12.0% · 12mo
- Down + closing
- —
- Monthly P&I
- —
- Monthly cashflow
- —
- DSCR
- —
- Eligible?
- —
Short-term bridge; refi at stabilization.
Rent comps 35 comps
| Address | Beds | Baths | Sqft | Rent | $/sqft | DOM | Units | Dist |
|---|---|---|---|---|---|---|---|---|
| 2257 Luxmore Dr Saint Louis, MO | 3.0 | 3.0 | 1073 | $1,495 | $1.39 | 24d | 1 | 0.13mi |
| 2259 Ainsworth Dr Saint Louis, MO | 4.0 | 2.0 | 1561 | $2,100 | $1.35 | 2d | 1 | 0.20mi |
| 2259 Ainsworth Dr Saint Louis, MO | 4.0 | 2.0 | 1500 | $1,776 | $1.18 | 44d | 1 | 0.20mi |
| 2544 Netherton Dr Saint Louis, MO | 3.0 | 2.0 | 1288 | $1,945 | $1.51 | 2d | 1 | 0.41mi |
| 13061 Lord Dr St. Louis, MO | 2.0 | 1.0 | 900 | $1,040 | $1.16 | 22d | 1 | 0.51mi |
| 10504 Baron Dr Saint Louis, MO | 3.0 | 1.0 | 1000 | $1,300 | $1.30 | 7d | 1 | 0.56mi |
| 10512 Count Dr Saint Louis, MO | 3.0 | 1.0 | 888 | $1,195 | $1.35 | 15d | 1 | 0.57mi |
| 10501 Duke Dr Saint Louis, MO | 2.0 | 1.0 | 1140 | $1,090 | $0.96 | 44d | 1 | 0.68mi |
| 2745 Rottingdean Dr St. Louis, MO | 1.0–2.0 | 1.0 | 825 | $975 | $1.18 | 44d | 1 | 0.69mi |
| 10409 Count Dr Saint Louis, MO | 3.0 | 1.0 | 912 | $1,100 | $1.21 | 22d | 1 | 0.69mi |
| 10557 Castle Dr Saint Louis, MO | 3.0 | 2.0 | 1023 | $1,300 | $1.27 | 15d | 1 | 0.74mi |
| 10322 Monarch Dr Saint Louis, MO | 3.0 | 2.0 | 1073 | $1,728 | $1.61 | 24d | 1 | 0.76mi |
| 62 Capitol Hill Dr Saint Louis, MO | 3.0 | 2.0 | 1239 | $1,250 | $1.01 | 44d | 1 | 0.79mi |
| 10441 Prince Dr Saint Louis, MO | 4.0 | 1.5 | 1380 | $1,380 | $1.00 | 44d | 1 | 0.80mi |
| 10421 Prince Dr Saint Louis, MO | 3.0 | 2.0 | 1023 | $1,275 | $1.25 | 24d | 1 | 0.83mi |
| 10239 Green Valley Dr Saint Louis, MO | 3.0 | 1.0 | 1014 | $1,395 | $1.38 | 24d | 1 | 0.95mi |
| 1915 Green Valley Dr Saint Louis, MO | 4.0 | 2.0 | 1740 | $1,500 | $0.86 | 4d | 1 | 0.97mi |
| 11321 Amboy Ln Saint Louis, MO | 3.0 | 3.0 | 1182 | $1,756 | $1.49 | 2d | 1 | 1.05mi |
| 10129 Cavalier Ct Saint Louis, MO | 3.0 | 1.5 | 912 | $1,250 | $1.37 | 24d | 1 | 1.06mi |
| 10113 Count Dr Saint Louis, MO | 2.0 | 1.0 | 882 | $775 | $0.88 | 44d | 1 | 1.08mi |
| 10139 Royal Dr Saint Louis, MO | 2.0 | 1.0 | 1016 | $900 | $0.89 | 44d | 1 | 1.12mi |
| 10304 Bon Oak Dr Saint Louis, MO | 3.0 | 1.5 | 1500 | $1,250 | $0.83 | 44d | 1 | 1.12mi |
| 10078 Green Valley Dr Saint Louis, MO | 3.0 | 1.0 | 900 | $1,325 | $1.47 | 7d | 1 | 1.23mi |
| 11635 Hazeloak Dr Black Jack, MO | 3.0 | 2.0 | 1124 | $1,728 | $1.54 | 17d | 1 | 1.26mi |
| 2257 Chambers Rd Saint Louis, MO | 3.0 | 1.0 | 1200 | $1,400 | $1.17 | 24d | 1 | 1.29mi |
| 2326 Chambers Rd Saint Louis, MO | 2.0 | 1.0 | 1056 | $1,050 | $0.99 | 24d | 1 | 1.29mi |
| 1520 Attica Dr Saint Louis, MO | 2.0 | 1.0 | 1062 | $1,200 | $1.13 | 24d | 1 | 1.30mi |
| 2321 Noll Dr Saint Louis, MO | 3.0 | 1.0 | 975 | $1,320 | $1.35 | 24d | 1 | 1.41mi |
| 4872 Bristol Rock Rd Black Jack, MO | 4.0 | 2.0 | 1448 | $2,061 | $1.42 | 2d | 1 | 1.43mi |
| 1547 Babcock Dr Saint Louis, MO | 3.0 | 1.0 | 1014 | $1,480 | $1.46 | 44d | 1 | 1.43mi |
| 10331 Ewell Dr Saint Louis, MO | 3.0 | 1.0 | 1658 | $1,540 | $0.93 | 4d | 1 | 1.44mi |
| 1238 Hoyt Dr Saint Louis, MO | 3.0 | 1.0 | 1176 | $1,400 | $1.19 | 22d | 1 | 1.44mi |
| 10329 Chesley Dr Saint Louis, MO | 3.0 | 1.0 | 1014 | $1,350 | $1.33 | 24d | 1 | 1.45mi |
| 1926 Chambers Rd Saint Louis, MO | 4.0 | 1.0 | 1095 | $995 | $0.91 | 15d | 1 | 1.47mi |
| 1230 Roxton Dr Saint Louis, MO | 3.0 | 1.0 | 912 | $1,400 | $1.54 | 22d | 1 | 1.48mi |
Listing history 21 events
-
2026-06-18days on market $125,000 Active 70 DOM
-
2026-06-17days on market $125,000 Active 69 DOM
-
2026-06-16days on market $125,000 Active 68 DOM
-
2026-06-15days on market $125,000 Active 67 DOM
-
2026-06-13days on market $125,000 Active 65 DOM
-
2026-06-13days on market $125,000 Active 64 DOM
-
2026-06-09days on market $125,000 Active 61 DOM
-
2026-06-08days on market $125,000 Active 60 DOM
-
2026-06-07days on market $125,000 Active 59 DOM
-
2026-06-05days on market $125,000 Active 56 DOM
-
2026-06-03days on market $125,000 Active 55 DOM
-
2026-06-02days on market $125,000 Active 54 DOM
-
2026-06-01days on market $125,000 Active 53 DOM
-
2026-05-31days on market $125,000 Active 52 DOM
-
2026-04-10$125,000 Active 1251-char remark
Show marketing remark (1251 chars)
Welcome to 10804 Linnell Drive-where opportunity meets imagination! This 4 bedroom, 2 bath home is ready for its next chapter and just waiting for the right buyer to bring it back to life. With a spacious layout, generous room sizes and a nice sized lot, there's plenty of room to create something special. Calling all investors, flippers and visionaries-this one is your blank canvas! Whether you're looking to renovate and resell, build your rental portfolio, or design your dream home, the possibilities here are endless. Property is being sold as-is. Seller to make no repairs, inspections, or warranties. Special Sales Contract preferred. Utilities may not be on for inspections. Please use caution when showing. Convenient location with easy access to major highways, shopping, and amenities. With the right updates, this property presents as an excellent opportunity for rental income or your primary residence. Bring your ideas, your contractor, and your vision-this is the one you've been waiting for! Schedule through MLS. Proof of funds or pre-approval required with offers. All offers will be reviewed by 6:00 PM Sunday, April 12, 2026 after the open house. Great FHA203k opportunity. Sizeable work already completed.
-
2026-04-05historical $125,000 1251-char remark
Show marketing remark (1251 chars)
Welcome to 10804 Linnell Drive-where opportunity meets imagination! This 4 bedroom, 2 bath home is ready for its next chapter and just waiting for the right buyer to bring it back to life. With a spacious layout, generous room sizes and a nice sized lot, there's plenty of room to create something special. Calling all investors, flippers and visionaries-this one is your blank canvas! Whether you're looking to renovate and resell, build your rental portfolio, or design your dream home, the possibilities here are endless. Property is being sold as-is. Seller to make no repairs, inspections, or warranties. Special Sales Contract preferred. Utilities may not be on for inspections. Please use caution when showing. Convenient location with easy access to major highways, shopping, and amenities. With the right updates, this property presents as an excellent opportunity for rental income or your primary residence. Bring your ideas, your contractor, and your vision-this is the one you've been waiting for! Schedule through MLS. Proof of funds or pre-approval required with offers. All offers will be reviewed by 6:00 PM Sunday, April 12, 2026 after the open house. Great FHA203k opportunity. Sizeable work already completed.
-
2018-11-21soldstatus Closed 303-char remark
Show marketing remark (303 chars)
Ranch style home w/open living area, 3 bedrooms, 2 baths, large family room, breakfast room features sliding doors that open to the backyard. Hardwood floors, partially finished basement, and 2 car attached garage. Needs updating & repairs to make move-in ready, but you can see the possibilities
-
2018-08-05status Pending 303-char remark
Show marketing remark (303 chars)
Ranch style home w/open living area, 3 bedrooms, 2 baths, large family room, breakfast room features sliding doors that open to the backyard. Hardwood floors, partially finished basement, and 2 car attached garage. Needs updating & repairs to make move-in ready, but you can see the possibilities
-
2018-07-27$40,700 Active 303-char remark
Show marketing remark (303 chars)
Ranch style home w/open living area, 3 bedrooms, 2 baths, large family room, breakfast room features sliding doors that open to the backyard. Hardwood floors, partially finished basement, and 2 car attached garage. Needs updating & repairs to make move-in ready, but you can see the possibilities
-
2010-07-12soldstatus
-
2003-10-01soldstatus $70,000
ⓘ Source: listings_history table (triggers on properties + properties_extension) + one-shot
backfill from property_details.listing_events for pre-trigger history.
Tax reassessment forecast MO · Resets to sale price
- Current annual tax
- $2,038 · $170/mo
- Projected year-2 tax
- $2,038 · $170/mo
- Expected delta
- $0/yr ($0/mo · 0.0%)
ⓘ Screening estimate from a state-policy table — verify with the county assessor before closing.
Climate risk First Street
- Flood 1/10 Low FEMA zone X (unshaded) · 0% chance over 30 yrs
- Wildfire 1/10 Low
- Heat 5/10 Major 7 d/yr ≥107°F today · 21 d/yr by 30 yrs out
- Wind 2/10 Low 100% chance of damaging wind over 30 yrs
- Air quality 3/10 Moderate 3 unhealthy d/yr today · 5 by 30 yrs out
Nearby sold comps map
Loading sold comps map…
Walkable amenities ~0.75 mi
Loading nearby amenities…
Taxation est. · year 1
- Rental income
- $18,045
- − Mortgage interest
- −$7,002
- − Property taxes
- −$2,038
- − Insurance
- −$625
- − Repairs & maintenance
- −$1,444
- − Management
- −$1,444
- − Depreciation
- −$3,636
- Taxable income
- $1,856
- Est. tax owed @ 24.0%
- −$445
- After-tax cash flow
- $3,281/yr
For passive investors: Depreciation is non-cash, so a rental often shows a tax loss while cash-flowing — sheltering income. Rental losses are passive: they offset passive income freely, and up to $25,000/yr can offset ordinary (W-2) income if you actively participate and your MAGI is under $100k (phasing out to $0 by $150k); unused losses carry forward. On sale, claimed depreciation is recaptured at up to 25%, and gains may owe capital-gains tax (a 1031 exchange can defer both). Figures are a year-1 estimate at your 24.0% rate — not tax advice; consult a CPA.
Schools (NCES district)
- District
- Hazelwood
- NCES district ID
- 2913830
- Math proficiency
- 11% ▼ -13.00%
- Reading proficiency
- 26% ▼ -6.00%
- Median HH income
- $51,621
- Composite
- 16.77/100
- National rank
- #9156
- State rank
- #306 of 324 in MO
Livability — Bellefontaine Neighbors
- Score
- 58/100
- State rank
- #592
- US rank
- #20944
Category grades
Schools grade is shown separately in the Schools card above.
Census & demographics
- County
- Saint Louis County · 888,823 people
- City population
- 19,684
- Metro
- St. Louis, MO-IL
- Population (ZIP)
- 40,929
- Household income
- $41,154
- Rent vs Own
- Severe rent burden
- 3085.0
Population outlook (St. Louis County) Hauer SSP2
- Today (2025)
- 1,025,227 people
- By 2030
- 1,028,023 · +0.3%
- By 2040
- 1,020,940 · -0.4%
- By 2050
- 1,007,280 · -1.8%
- By 2075
- 987,277 · -3.7%
- By 2100
- 921,984 · -10.1%
Race, ethnicity, and origin ACS 2023
- Neighborhood character
- Predominantly Black (90%)
- Race & ethnicity
- Black 90% White 5% Two or more races 3%
- Foreign-born
- 1% · Canada
Political lean MEDSL · St. Louis
- 2024 margin
- Strong D (+23.4) · D 60.8% · R 37.4% · Other 1.7%
- 2008→2024 swing
- +3.5pp toward D · 2008: 19.9pp · 2024: 23.4pp
- All cycles
- 2024: D+23.4 2020: D+24.0 2016: D+16.2 2012: D+13.7 2008: D+19.9
Not yet ingested
- Civics
- —
Market trends
- HPI YoY
- ▲ 3.79%
- Current HPI
- 420.28
- Rent YoY
- ▲ 4.97%
- Metro
- St. Louis, MO-IL
- State GDP YoY
- ▲ 1.84%
- F500 in state
- 20
Industry mix (Fortune 500 HQ in MO)
| Industry | F500 HQs | Revenue |
|---|---|---|
| Healthcare | 1 | $163B |
|
||
| Insurance | 1 | $21B |
|
||
| Industrial Technology | 1 | $17B |
|
||
| Retail | 1 | $16B |
|
||
| Industrial Distribution | 1 | $10B |
|
||
| Utilities | 1 | $9B |
|
||
Price history
+78.6% since first listed7 events — show timeline
- 2026-04-10 Listed $125,000 MARIS as Distributed by MLS Grid
- 2026-04-05 Coming Soon $125,000 MARIS as Distributed by MLS Grid
- 2018-11-21 Sold (MLS) — MARIS as Distributed by MLS Grid
- 2018-08-05 Pending — MARIS as Distributed by MLS Grid
- 2018-07-27 Listed $40,700 MARIS as Distributed by MLS Grid
- 2010-07-12 Sold (Public Records) — Public Records
- 2003-10-01 Sold (Public Records) $70,000 Public Records
Property tax history
+1.6%/yrLatest (2022): $2,038 · +5.6% YoY. Source: county tax records.
Cash-flow waterfall
monthlySold comps — $/sqft
last 12 mo · ≤1 miLoading sold comps…