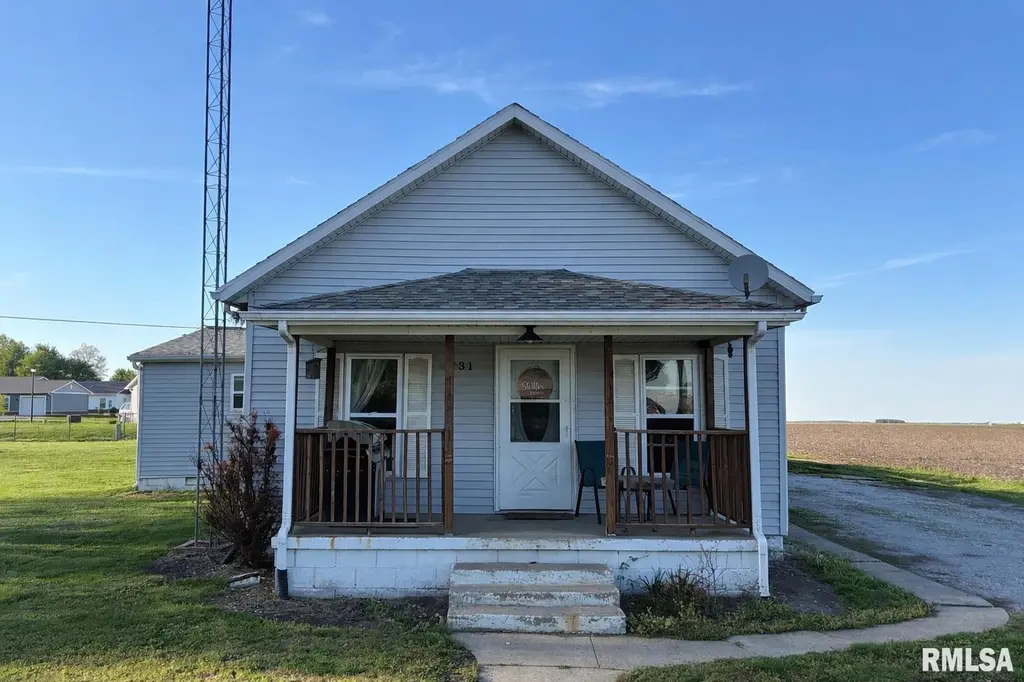
731 E Jackson St · Virden, IL
Flood risk 1/10 · Minimal
- FEMA flood zone
- X
- Chance of flooding over 30 yrs
- 0.0%
- Est. flood insurance / yr
- $473 – $860
Fire risk 1/10 · Minimal
- Est. fire insurance / yr
- $804 – $1,492
Heat risk 4/10 · Minor
- Hot days now (above 105°F)
- 7 days/yr
- Hot days in 30 yrs
- 20 days/yr
Wind risk 2/10 · Minimal
- Chance of severe wind over 30 yrs
- 2.0%
Air-quality risk 2/10 · Minimal
- Unhealthy air days now
- 1 days/yr
- Unhealthy air days in 30 yrs
- 2 days/yr
Risk factors via First Street. Map © Google.
Why this score? — see what drove the F grade
The composite is a weighted blend of 9 inputs, each scored 0–100. Each bar is that input's sub-score; the figure is the points it added to the 100-point composite (weight × sub-score).
- Cash flow +13.6/30.0
- Schools +5.0/10.0
- DSCR +4.1/10.0
- 1% rule +3.6/10.0
- Livability +3.0/5.0
- Rent growth +2.5/5.0
- Condition / age +2.5/5.0
- ARV discount +0.0/15.0
- Appreciation +0.0/10.0
$139,900
🖨 Deal sheet (PDF) 📄 Offer letter ✓ Due diligence
Listing remarks MLS
move in ready, 3 bed, 2 bath home on 3 lots. new flooring and paint throughout, new paint, new ac and furnace. selling "as is"
Key facts
- New furnace
- Newly installed ac
- Remodeled bathroom
Tags
Neighborhood map
What this means for you Summary
Snapshot
- This is a 3-bed/2.0-bath single-family listed at $140k.
Deal economics
- At list price, monthly cash flow is $7 ($90/yr) — positive.
- The deal already cash-flows at list — no discount required.
- To meet the 1% rule (rent ≥ 1% of price), the offer needs to be $120k (14.2% below list).
- Recommended offer: $120k (14.2% below list) — sets the bar for 1% rule.
Location & tenants
- Location reads 60/100 on livability (#975 in IL) — a middle-class / working-renter tenant base. Strengths: cost of living A+, housing A+; Watch: crime D+, schools D-, amenities F.
- Market conditions: 13 active listings in the ZIP; 1 comparable units currently listed for rent nearby; 70 units permitted in Macoupin County in 2024 (0 in 5+ unit buildings).
Forward outlook
- Local home prices are declining (-3.0%/yr); year-one equity from $967 of loan paydown is wiped out by about $4k of value loss. Plan a longer hold.
- Macoupin County population projected at -27% by 2050 — secular population decline; favor cash flow + early exit over multi-decade hold.
Negotiation context
- Only 1 days on market — expect competitive offers; lowballing is unlikely to land.
- 2 sale attempts since 5y ago with the ask held roughly flat each time — persistent listings suggest the price (not the market) is what's stuck; bring a comps-based counter.
- Current owner paid $65k; list at $140k implies a 115% gain — meaningful room to come down on a strong offer.
Risks & watch-outs
- Watch-outs: built in 1930 — expect roof / HVAC / electrical / plumbing capex.
Questions for the listing agent
- Built in 1930 — when were the roof, HVAC, electrical panel, plumbing, and water heater last replaced?
- Is there a deadline driving the sale (1031 exchange, divorce, estate, relocation)? That informs how much negotiation room exists.
- Schools are D-rated, which usually means shorter tenancies and higher turnover. Who's the typical renter profile here, and what's been the actual vacancy rate?
- Crime grade is D in this area — have there been break-ins, vandalism, or insurance claims at this property in the last 3 years? What carrier currently insures it and at what premium?
- The area grade is low — what's the realistic commute time and amenity access for the typical tenant pool here? Any planned neighborhood developments (good or bad) we should know about?
- What's the average days-on-market for RENTAL listings here right now (not sales)? A rising rental-DOM trend means longer vacancies and softer asking-rent achievability than the comps imply.
- What's the recent tenant-quality profile in this submarket — average credit score on applications, eviction rate, late-payment / NSF rate, and stable-employment percentage? A property-management company in the area should have these aggregated.
- How much new for-sale + rental construction is in the pipeline within 1–3 miles? Heavy new supply typically softens prices + rents 12–24 months out; constrained supply supports both.
Investment metrics
- 1% rule
- 0.86% ✗
- Cap rate
- 6.36%
- Cash-on-cash
- 0.23%
- DSCR
- 1.01
- GRM
- 9.7
CMA / ARV
- ARV (on-the-fly)
- $99,440
- Comps found
- 12
Show comp detail 12 sales within ~0.75 mi
| Address | Dist | Beds/Ba | Sqft | Sold | Price | $/sf | Match |
|---|---|---|---|---|---|---|---|
| 731 E Jackson St | 0.00mi | 3/2.0 | 1,130 (0%) | 1mo | $141,000 | $125 | 99 |
| 129 S Ring St | 0.18mi | 3/1.0 | 1,142 (+1%) | 11mo | $119,000 | $104 | 77 |
| 206 N Henderson St | 0.11mi | 3/1.0 | 1,209 (+7%) | 9mo | $125,000 | $103 | 72 |
| 444 S Emmett St | 0.49mi | 3/1.0 | 1,120 (-1%) | 11mo | $90,000 | $80 | 63 |
| 202 S Dye St | 0.48mi | 2/1.0 (-1) | 1,178 (+4%) | 4mo | $95,000 | $81 | 59 |
| 204 N Emmett St | 0.20mi | 2/1.0 (-1) | 1,242 (+10%) | 13mo | $109,900 | $88 | 54 |
| 528 S Emmett St | 0.56mi | 3/1.0 | 1,200 (+6%) | 7mo | $99,900 | $83 | 54 |
| 132 E Fortune St | 0.56mi | 3/1.0 | 1,200 (+6%) | 9mo | $110,000 | $92 | 52 |
| 231 E Stoddard Ave | 0.75mi | 2/1.0 (-1) | 1,244 (+10%) | 1mo | $19,000 | $15 | 38 |
| 119 N Church St | 0.63mi | 2/2.0 (-1) | 1,242 (+10%) | 15mo | $139,000 | $112 | 37 |
| 313 S Dye St | 0.56mi | 2/1.0 (-1) | 1,000 (-12%) | 14mo | $23,400 | $23 | 34 |
| 920 N Dye St | 0.75mi | 2/1.0 (-1) | 1,000 (-12%) | 9mo | $35,000 | $35 | 29 |
Match score weights: distance 35% · size 25% · config 20% · recency 20%. Top-matched comps best support the ARV.
Projected returns pro-forma
-3.0% appreciation · 3.0% rent growth · sell at horizon
- IRR
- -15.9%
- Equity multiple
- 0.43×
- Total profit
- $-22,193
- Equity at exit
- $20,860
- IRR
- -7.6%
- Equity multiple
- 0.52×
- Total profit
- $-18,705
- Equity at exit
- $12,096
Cash invested: $39,172 (down + closing). Projections, not guarantees.
Landlord ↔ Tenant lean methodology
- Overall (STATE)
- 43 Moderately Tenant-Leaning
- State Illinois
- 43 Moderately Tenant-Leaning · D+7
- County
- — inherits STATE
- City
- — inherits STATE
ZIP-level market 62690
- Home prices YoY
- -28.3%
- Active inventory
- 13
- Price-to-rent
- 9.7×
Monthly cashflow live
- Estimated rent
- $1,200 medium interval (Pro) →
- Mortgage (P&I)
- −$734
- Tax from tax record
- −$149 /mo · $1,783/yr
- Insurance
- −$58
- HOA
- −$0
- Vacancy / Maint / Mgmt
- −$252
- Net cashflow
- $7
Break-even live
Sensitivity live
| Price | -10% $87 | -5% $47 | +0% $7 | +5% $-32 | +10% $-72 |
|---|---|---|---|---|---|
| Rent | -10% $-87 | -5% $-40 | +0% $7 | +5% $55 | +10% $102 |
| Rate | -1.0pp $78 | -0.5pp $43 | base $7 | +0.5pp $-29 | +1.0pp $-66 |
UW: 25.0% down · 7.5% · 30yr · 1.5% tax · 5.0% vac · 8.0% maint · 8.0% mgmt
Financing live
Cash to close
- Down payment
- $34,975
- Closing costs
- $4,197
- Reserves months
- —
- Total cash needed
- —
Loan-product check · same deal, 3 products live
Conventional
25% down · 7.5% · 30yr
- Down + closing
- —
- Monthly P&I
- —
- Monthly cashflow
- —
- DSCR
- —
- Eligible?
- —
Personal DTI + credit; lowest rate.
DSCR
20% down · 8.5% · 30yr
- Down + closing
- —
- Monthly P&I
- —
- Monthly cashflow
- —
- DSCR
- —
- Eligible?
- —
No personal income docs; deal must DSCR.
Hard money
10% down · 12.0% · 12mo
- Down + closing
- —
- Monthly P&I
- —
- Monthly cashflow
- —
- DSCR
- —
- Eligible?
- —
Short-term bridge; refi at stabilization.
Rent comps 1 comps
| Address | Beds | Baths | Sqft | Rent | $/sqft | DOM | Units | Dist |
|---|---|---|---|---|---|---|---|---|
| 206 S Springfield St Virden, IL | 3.0 | 2.0 | 1200 | $1,200 | $1.00 | 22d | 1 | 0.55mi |
Listing history 5 events
-
2026-04-22status Pending
-
2026-04-21$139,900 Active
-
2021-11-12soldstatus $65,000 136-char remark
Show marketing remark (136 chars)
move in ready, 3 bed, 2 bath home on 3 lots. new flooring and paint throughout, new paint, new ac and furnace. selling "as is"
-
2021-10-05$65,000 136-char remark
Show marketing remark (136 chars)
move in ready, 3 bed, 2 bath home on 3 lots. new flooring and paint throughout, new paint, new ac and furnace. selling "as is"
-
2021-02-04soldstatus $27,500
ⓘ Source: listings_history table (triggers on properties + properties_extension) + one-shot
backfill from property_details.listing_events for pre-trigger history.
Tax reassessment forecast IL · Partial reset (capped growth)
- Current annual tax
- $1,783 · $149/mo
- Projected year-2 tax
- $2,479 · $207/mo
- Expected delta
- +$696/yr (+$58/mo · 39.0%)
ⓘ Screening estimate from a state-policy table — verify with the county assessor before closing.
Climate risk First Street
- Flood 1/10 Low FEMA zone X · 0% chance over 30 yrs
- Wildfire 1/10 Low
- Heat 4/10 Moderate 7 d/yr ≥105°F today · 20 d/yr by 30 yrs out
- Wind 2/10 Low 2% chance of damaging wind over 30 yrs
- Air quality 2/10 Low 1 unhealthy d/yr today · 2 by 30 yrs out
Nearby sold comps map
Loading sold comps map…
Walkable amenities ~0.75 mi
Loading nearby amenities…
Taxation est. · year 1
- Rental income
- $14,400
- − Mortgage interest
- −$7,837
- − Property taxes
- −$1,783
- − Insurance
- −$700
- − Repairs & maintenance
- −$1,152
- − Management
- −$1,152
- − Depreciation
- −$4,070
- Taxable loss
- −$2,293
- Est. tax savings @ 24.0%
- +$550
- After-tax cash flow
- $640/yr
For passive investors: Depreciation is non-cash, so a rental often shows a tax loss while cash-flowing — sheltering income. Rental losses are passive: they offset passive income freely, and up to $25,000/yr can offset ordinary (W-2) income if you actively participate and your MAGI is under $100k (phasing out to $0 by $150k); unused losses carry forward. On sale, claimed depreciation is recaptured at up to 25%, and gains may owe capital-gains tax (a 1031 exchange can defer both). Figures are a year-1 estimate at your 24.0% rate — not tax advice; consult a CPA.
Schools (NCES district)
No district data.
Livability — Virden
- Score
- 60/100
- State rank
- #975
- US rank
- #18878
Category grades
Schools grade is shown separately in the Schools card above.
Census & demographics
- City population
- 3,878
- Population (ZIP)
- 3,878
Population outlook (Macoupin County) Hauer SSP2
- Today (2025)
- 42,867 people
- By 2030
- 40,796 · -4.8%
- By 2040
- 36,135 · -15.7%
- By 2050
- 31,469 · -26.6%
- By 2075
- 22,102 · -48.4%
- By 2100
- 15,380 · -64.1%
Race, ethnicity, and origin ACS 2023
- Neighborhood character
- Predominantly White (98%)
- Race & ethnicity
- White 98% Two or more races 1%
- Common ancestry
- Iranian 7% Lithuanian 2% Italian 1%
- Foreign-born
- 1%
Political lean MEDSL · Macoupin
- 2024 margin
- Solid R (+39.2) · D 29.4% · R 68.7% · Other 1.9%
- 2008→2024 swing
- -49.0pp toward R · 2008: 9.8pp · 2024: -39.2pp
- All cycles
- 2024: R+39.2 2020: R+36.5 2016: R+35.0 2012: R+7.0 2008: D+9.8
Not yet ingested
- Civics
- —
Market trends
- HPI YoY
- ▼ -49.41%
- Current HPI
- 125.3599
- Rent YoY
- —
- Metro
- —
- State GDP YoY
- ▲ 1.59%
- F500 in state
- 60
Industry mix (Fortune 500 HQ in IL)
| Industry | F500 HQs | Revenue |
|---|---|---|
| Insurance | 4 | $201B |
|
||
| Consumer Goods | 4 | $87B |
|
||
| Industrial Machinery | 3 | $64B |
|
||
| Healthcare | 2 | $55B |
|
||
| Retail / Pharmacy | 1 | $148B |
|
||
| Agriculture / Food | 1 | $86B |
|
||
Price history
+408.7% since first listed5 events — show timeline
- 2026-04-22 Pending — RMLSA as Distributed by MLS Grid
- 2026-04-21 Listed $139,900 RMLSA as Distributed by MLS Grid
- 2021-11-12 Sold (MLS) $65,000 RMLSA as Distributed by MLS Grid
- 2021-10-05 Listed $65,000 RMLSA as Distributed by MLS Grid
- 2021-02-04 Sold (Public Records) $27,500 Public Records
Property tax history
+6.9%/yrLatest (2024): $1,783 · +45.8% YoY. Source: county tax records.
Cash-flow waterfall
monthlySold comps — $/sqft
last 12 mo · ≤1 miLoading sold comps…