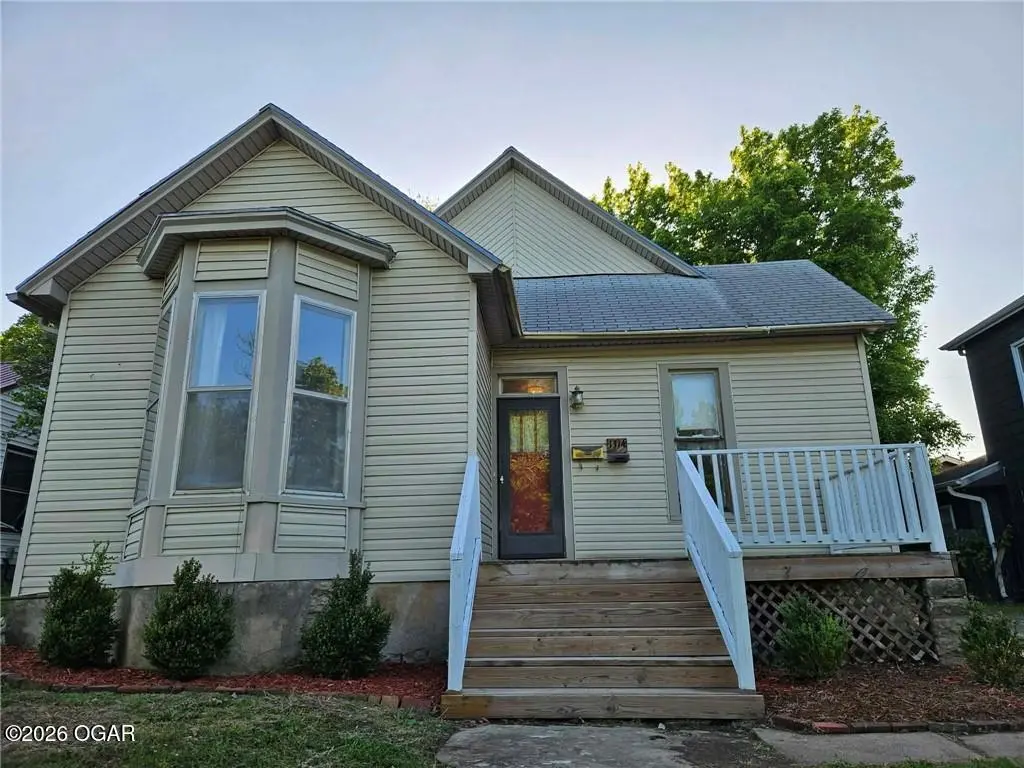
1314 S Judson St · Fort Scott, KS
Flood risk 1/10 · Minimal
- FEMA flood zone
- X (unshaded)
- Chance of flooding over 30 yrs
- 0.0%
- Est. flood insurance / yr
- $473 – $860
Fire risk 5/10 · Moderate
- Est. fire insurance / yr
- $1,154 – $2,142
Heat risk 5/10 · Moderate
- Hot days now (above 109°F)
- 7 days/yr
- Hot days in 30 yrs
- 19 days/yr
Wind risk 2/10 · Minimal
- Chance of severe wind over 30 yrs
- 1.0%
Air-quality risk 2/10 · Minimal
- Unhealthy air days now
- 1 days/yr
- Unhealthy air days in 30 yrs
- 1 days/yr
Risk factors via First Street. Map © Google.
Why this score? — see what drove the B- grade
The composite is a weighted blend of 9 inputs, each scored 0–100. Each bar is that input's sub-score; the figure is the points it added to the 100-point composite (weight × sub-score).
- Cash flow +30.0/30.0
- 1% rule +10.0/10.0
- DSCR +10.0/10.0
- ARV discount +7.5/15.0
- Livability +3.3/5.0
- Rent growth +2.5/5.0
- Condition / age +2.5/5.0
- Schools +2.0/10.0
- Appreciation +0.0/10.0
$59,900
🖨 Deal sheet 📄 Offer letter ✓ Due diligence
Listing remarks MLS
3 bedroom, 1 bath bungalow located on paved street, central to city amenities, priced right and has a 1 car detached garage. Sold "as is/where is"
Key facts
- Built-in seating
- Attached dining area
- Laundry area
Tags
Property features AI
Finance
- Other: Living area reported as 1,477 (source: public records)
- Financial info: No investor/multifamily financial data provided
- HOA & community: No HOA fees
Exterior
- Parking: Detached 1-car garage
- Utilities: Public water; Public sewer
- Home design: Single-family residence; 1.5-story floor plan; Located inside city limits
- Construction: Frame construction with vinyl siding; Composition roof; Approximately 101+ years old
- Exterior features: Metal fencing; 50 x 120 lot dimensions
Interior
- Kitchen: Kitchen with dining combo
- Bedrooms: 3 bedrooms
- Bathrooms: 1 full bath; 1 half bath
- Heating & cooling: Natural gas heating; Cooling system present (no central A/C specified)
- Interior features: Enclosed porch; Entry; Sun room; Kit/Dining combo; Partial basement
- Laundry & utility: Laundry on main level; Laundry located off the kitchen
Neighborhood map
What this means for you Summary
Snapshot
- This is a 3-bed/1.5-bath single-family listed at $60k.
Deal economics
- At list price, monthly cash flow is $520 ($6k/yr) — positive.
- The deal already cash-flows at list — no discount required.
- Meets the 1% rule at list price ($1k rent vs $60k).
- Recommended offer: $58k (3.0% below list) — sets the bar for market timing.
- Cap rate 16.7% vs local median 4.9% in Fort Scott — top-decile yield for the area; either an underpriced asset or a hidden risk that comps aren't pricing in. Stress-test before assuming the spread holds.
Location & tenants
- Location reads 66/100 on livability (#259 in KS) — a middle-class / working-renter tenant base. Strengths: cost of living A+, health & safety A+, housing A; Watch: schools D, amenities F, commute F.
- Fort Scott (town): math 19% / reading 28% proficiency, ranked #150 of 169 in KS (top 89%) — low school quality limits family demand, transient renter base, plan for 1-2y turnover.
- Market conditions: 70 active listings in the ZIP; 5 units permitted in Bourbon County in 2024 (0 in 5+ unit buildings).
Forward outlook
- Local home prices are declining (-3.0%/yr); year-one equity from $414 of loan paydown is wiped out by about $2k of value loss. Plan a longer hold.
- Bourbon County population projected at -21% by 2050 — secular population decline; favor cash flow + early exit over multi-decade hold.
- At projected returns (-3.0% appreciation + 3.0% rent growth), your $17k cash investment doubles in ~4 years — after that, you're playing with house money.
Negotiation context
- It's been on market 56 days — a 3% lower offer ($58k) is reasonable based on typical stale-listing flexibility.
- 4 sale attempts since 11y ago; this cycle's ask has dropped $10k (14%) from the opening price — seller is motivated, your offer sets the floor, not the list.
- Current owner paid $35k; list at $60k implies a 72% gain — meaningful room to come down on a strong offer.
Risks & watch-outs
- Watch-outs: built in 1920 — expect roof / HVAC / electrical / plumbing capex.
- Climate carrying-cost: moderate wildfire risk; extreme-heat days projected 7→19/yr by 2055 (HVAC capex compounding) — expect insurance premiums to compound above CPI over the hold.
Questions for the listing agent
- It's been on market 56 days. Have you received any prior offers? Is the seller open to a 3% concession, seller financing, or rate buy-down credit?
- Built in 1920 — when were the roof, HVAC, electrical panel, plumbing, and water heater last replaced?
- Is there a deadline driving the sale (1031 exchange, divorce, estate, relocation)? That informs how much negotiation room exists.
- Schools are D-rated, which usually means shorter tenancies and higher turnover. Who's the typical renter profile here, and what's been the actual vacancy rate?
- What's the average days-on-market for RENTAL listings here right now (not sales)? A rising rental-DOM trend means longer vacancies and softer asking-rent achievability than the comps imply.
- What's the recent tenant-quality profile in this submarket — average credit score on applications, eviction rate, late-payment / NSF rate, and stable-employment percentage? A property-management company in the area should have these aggregated.
- How much new for-sale + rental construction is in the pipeline within 1–3 miles? Heavy new supply typically softens prices + rents 12–24 months out; constrained supply supports both.
Investment metrics
- 1% rule
- 1.92% ✓
- Cap rate
- 16.71%
- Cash-on-cash
- 37.19%
- DSCR
- 2.65
- GRM
- 4.3
CMA / ARV
- ARV (on-the-fly)
- $132,930
- Comps found
- 12
Show comp detail 12 sales within ~0.75 mi
| Address | Dist | Beds/Ba | Sqft | Sold | Price | $/sf | Match |
|---|---|---|---|---|---|---|---|
| 1428 S Main St | 0.16mi | 3/1.5 | 1,544 (+4%) | 3mo | $72,500 | $47 | 82 |
| 621 Tiffany Ln | 0.41mi | 3/2.0 | 1,500 (+2%) | 1mo | $300,000 | $200 | 75 |
| 1387 Marblecrest Dr | 0.33mi | 3/2.0 | 1,440 (-2%) | 7mo | $155,000 | $108 | 73 |
| 830 S Judson St | 0.41mi | 3/2.0 | 1,476 (-0%) | 8mo | $99,000 | $67 | 73 |
| 813 S National Ave | 0.45mi | 3/1.0 | 1,496 (+1%) | 10mo | $135,000 | $90 | 67 |
| 1707 Tomahawk Ln | 0.63mi | 3/2.0 | 1,440 (-2%) | 1mo | $187,500 | $130 | 64 |
| 910 S Judson St | 0.33mi | 2/1.0 (-1) | 1,340 (-9%) | 2mo | $87,500 | $65 | 60 |
| 850 State St | 0.45mi | 2/1.0 (-1) | 1,606 (+9%) | 3mo | $44,000 | $27 | 55 |
| 716 S Osbun St | 0.69mi | 3/2.0 | 1,385 (-6%) | 7mo | $100,000 | $72 | 49 |
| 523 S Crawford St | 0.73mi | 3/2.0 | 1,332 (-10%) | 5mo | $159,900 | $120 | 43 |
| 316 W St Marys St | 0.55mi | 3/2.0 | 1,696 (+15%) | 6mo | $165,000 | $97 | 43 |
| 608 S Lowman St | 0.74mi | 2/1.0 (-1) | 1,280 (-13%) | 8mo | $110,000 | $86 | 30 |
Match score weights: distance 35% · size 25% · config 20% · recency 20%. Top-matched comps best support the ARV.
Projected returns pro-forma
-3.0% appreciation · 3.0% rent growth · sell at horizon
- IRR
- 33.1%
- Equity multiple
- 2.40×
- Total profit
- $23,398
- Equity at exit
- $8,931
- IRR
- 40.1%
- Equity multiple
- 4.76×
- Total profit
- $63,003
- Equity at exit
- $5,179
Cash invested: $16,772 (down + closing). Projections, not guarantees.
Landlord ↔ Tenant lean methodology
- Overall (STATE)
- 83 Strongly Landlord-Friendly
- State Kansas
- 83 Strongly Landlord-Friendly · R+10
- County
- — inherits STATE
- City
- — inherits STATE
ZIP-level market 66701
- Home prices YoY
- -10.4%
- Active inventory
- 70
- Price-to-rent
- 4.3×
Monthly cashflow live
- Estimated rent
- $1,148 medium interval (Pro) →
- Mortgage (P&I)
- −$314
- Tax from tax record
- −$48 /mo · $576/yr
- Insurance
- −$25
- HOA
- −$0
- Vacancy / Maint / Mgmt
- −$241
- Net cashflow
- $520
Break-even live
UW: 25.0% down · 7.5% · 30yr · 1.5% tax · 5.0% vac · 8.0% maint · 8.0% mgmt
Financing live
Cash to close
- Down payment
- $14,975
- Closing costs
- $1,797
- Reserves months
- —
- Total cash needed
- —
Loan-product check · same deal, 3 products live
Conventional
25% down · 7.5% · 30yr
- Down + closing
- —
- Monthly P&I
- —
- Monthly cashflow
- —
- DSCR
- —
- Eligible?
- —
Personal DTI + credit; lowest rate.
DSCR
20% down · 8.5% · 30yr
- Down + closing
- —
- Monthly P&I
- —
- Monthly cashflow
- —
- DSCR
- —
- Eligible?
- —
No personal income docs; deal must DSCR.
Hard money
10% down · 12.0% · 12mo
- Down + closing
- —
- Monthly P&I
- —
- Monthly cashflow
- —
- DSCR
- —
- Eligible?
- —
Short-term bridge; refi at stabilization.
Listing history 23 events
-
2026-06-18days on market $59,900 Active 56 DOM
-
2026-06-17days on market $59,900 Active 55 DOM
-
2026-06-16days on market $59,900 Active 54 DOM
-
2026-06-15days on market $59,900 Active 53 DOM
-
2026-06-13days on market $59,900 Active 51 DOM
-
2026-06-12days on market $59,900 Active 50 DOM
-
2026-06-09days on market $59,900 Active 47 DOM
-
2026-06-08days on market $59,900 Active 46 DOM
-
2026-06-07days on market $59,900 Active 45 DOM
-
2026-06-07days on market $59,900 Active 44 DOM
-
2026-06-04days on market $59,900 Active 41 DOM
-
2026-06-02days on market $59,900 Active 40 DOM
-
2026-06-01days on market $59,900 Active 39 DOM
-
2026-05-31days on market $59,900 Active 38 DOM
-
2026-05-31days on market $59,900 Active 37 DOM
-
2026-05-12price $59,900
-
2026-04-23$69,900 Active
-
2018-04-13soldstatus
-
2018-04-12soldstatus 156-char remark
Show marketing remark (156 chars)
3 bedroom, 1 bath bungalow located on paved street, central to city amenities, priced right and has a 1 car detached garage. Sold "as is/where is"
-
2018-03-05$10,000 156-char remark
Show marketing remark (156 chars)
3 bedroom, 1 bath bungalow located on paved street, central to city amenities, priced right and has a 1 car detached garage. Sold "as is/where is"
-
2016-04-12$10,000 77-char remark
Show marketing remark (77 chars)
3 bedroom 1.5 bath bungalow on nice street, sold "as is'/where is".
-
2015-07-14$12,000
-
2002-09-01soldstatus $34,900
ⓘ Source: listings_history table (triggers on properties + properties_extension) + one-shot
backfill from property_details.listing_events for pre-trigger history.
Tax reassessment forecast KS · Resets to sale price
- Current annual tax
- $576 · $48/mo
- Projected year-2 tax
- $845 · $70/mo
- Expected delta
- +$268/yr (+$22/mo · 46.6%)
ⓘ Screening estimate from a state-policy table — verify with the county assessor before closing.
Climate risk First Street
- Flood 1/10 Low FEMA zone X (unshaded) · 0% chance over 30 yrs
- Wildfire 5/10 Major
- Heat 5/10 Major 7 d/yr ≥109°F today · 19 d/yr by 30 yrs out
- Wind 2/10 Low 100% chance of damaging wind over 30 yrs
- Air quality 2/10 Low 1 unhealthy d/yr today · 1 by 30 yrs out
Nearby sold comps map
Loading sold comps map…
Walkable amenities ~0.75 mi
Loading nearby amenities…
Taxation est. · year 1
- Rental income
- $13,775
- − Mortgage interest
- −$3,355
- − Property taxes
- −$576
- − Insurance
- −$300
- − Repairs & maintenance
- −$1,102
- − Management
- −$1,102
- − Depreciation
- −$1,743
- Taxable income
- $5,597
- Est. tax owed @ 24.0%
- −$1,343
- After-tax cash flow
- $4,894/yr
For passive investors: Depreciation is non-cash, so a rental often shows a tax loss while cash-flowing — sheltering income. Rental losses are passive: they offset passive income freely, and up to $25,000/yr can offset ordinary (W-2) income if you actively participate and your MAGI is under $100k (phasing out to $0 by $150k); unused losses carry forward. On sale, claimed depreciation is recaptured at up to 25%, and gains may owe capital-gains tax (a 1031 exchange can defer both). Figures are a year-1 estimate at your 24.0% rate — not tax advice; consult a CPA.
Schools (NCES district)
- District
- Fort Scott
- NCES district ID
- 2006180
- Math proficiency
- 19% ▼ -3.00%
- Reading proficiency
- 28% ▬ 0.00%
- Median HH income
- $38,034
- Composite
- 19.64/100
- National rank
- #8741
- State rank
- #150 of 169 in KS
Livability — Fort Scott
- Score
- 66/100
- State rank
- #259
- US rank
- #11422
Category grades
Schools grade is shown separately in the Schools card above.
Census & demographics
- Census place
- Fort Scott, KS
- Population (ZIP)
- 11,075
Population outlook (Bourbon County) Hauer SSP2
- Today (2025)
- 13,761 people
- By 2030
- 13,139 · -4.5%
- By 2040
- 11,920 · -13.4%
- By 2050
- 10,892 · -20.8%
- By 2075
- 8,645 · -37.2%
- By 2100
- 6,751 · -50.9%
Race, ethnicity, and origin ACS 2023
- Neighborhood character
- Predominantly White (89%)
- Race & ethnicity
- White 89% Two or more races 5% Hispanic / Latino 3% Black 2%
- Common ancestry
- Lithuanian 2% Serbian 2% Slovak 2%
- Foreign-born
- 1%
- Languages at home
- 97% English-only · Spanish 1% Other Asian/Pacific 1% German/W. Germanic 1%
Political lean MEDSL · Bourbon
- 2024 margin
- Solid R (+54.2) · D 22.0% · R 76.1% · Other 1.9%
- 2008→2024 swing
- -26.9pp toward R · 2008: -27.2pp · 2024: -54.2pp
- All cycles
- 2024: R+54.2 2020: R+52.0 2016: R+50.8 2012: R+33.9 2008: R+27.2
Not yet ingested
- Civics
- —
Market trends
- HPI YoY
- ▼ -20.03%
- Current HPI
- 172.2531
- Rent YoY
- —
- Metro
- —
- State GDP YoY
- —
- F500 in state
- 0
Price history
+71.6% since first listed8 events — show timeline
- 2026-05-12 Price Changed $59,900 Heartland MLS as Distributed by MLS Grid
- 2026-04-23 Listed $69,900 Heartland MLS as Distributed by MLS Grid
- 2018-04-13 Sold (Public Records) — Public Records
- 2018-04-12 Sold (MLS) — Heartland MLS as Distributed by MLS Grid
- 2018-03-05 Listed $10,000 Heartland MLS as Distributed by MLS Grid
- 2016-04-12 Listed $10,000 Heartland MLS as Distributed by MLS Grid
- 2015-07-14 Listed $12,000 Heartland MLS as Distributed by MLS Grid
- 2002-09-01 Sold (Public Records) $34,900 Public Records
Property tax history
-3.2%/yrLatest (2025): $576 · +2.8% YoY. Source: county tax records.
Cash-flow waterfall
monthlySold comps — $/sqft
last 12 mo · ≤1 miLoading sold comps…