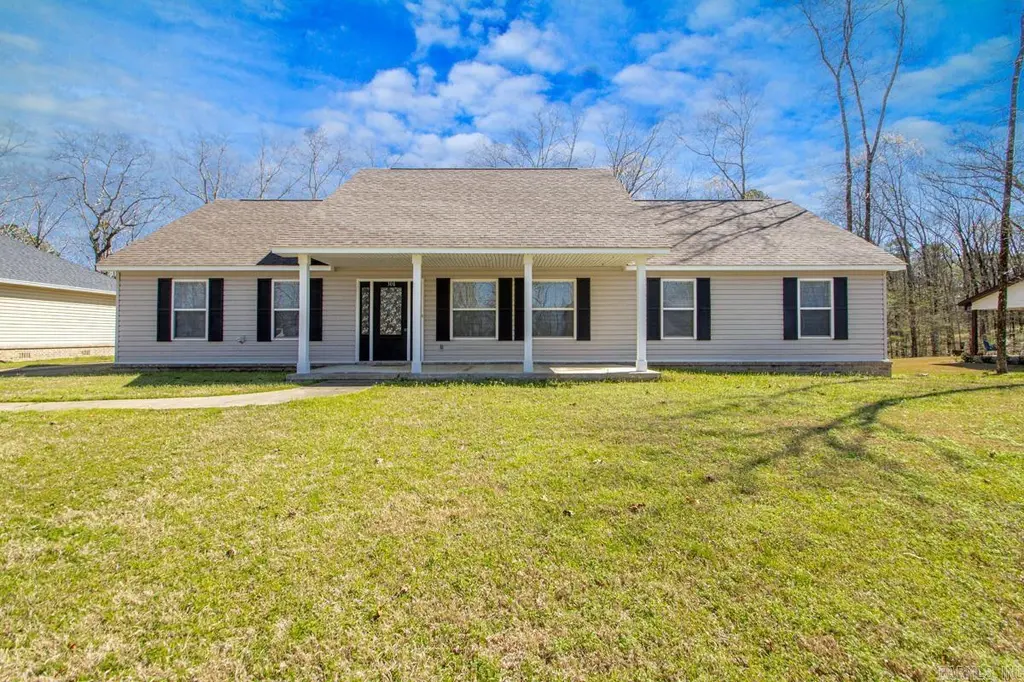
308 Diamondhead Dr · Hot Springs, AR
Flood risk 1/10 · Minimal
- FEMA flood zone
- X (unshaded)
- Chance of flooding over 30 yrs
- 0.0%
- Est. flood insurance / yr
- $507 – $1,088
Fire risk 4/10 · Minor
- Est. fire insurance / yr
- $1,499 – $2,785
Heat risk 6/10 · Moderate
- Hot days now (above 109°F)
- 7 days/yr
- Hot days in 30 yrs
- 20 days/yr
Wind risk 4/10 · Minor
- Chance of severe wind over 30 yrs
- 10.0%
Air-quality risk 1/10 · Minimal
- Unhealthy air days now
- 0 days/yr
- Unhealthy air days in 30 yrs
- 0 days/yr
Risk factors via First Street. Map © Google.
Why this score? — see what drove the C grade
The composite is a weighted blend of 9 inputs, each scored 0–100. Each bar is that input's sub-score; the figure is the points it added to the 100-point composite (weight × sub-score).
- Cash flow +18.6/30.0
- ARV discount +13.1/15.0
- DSCR +5.8/10.0
- 1% rule +4.5/10.0
- Rent growth +4.1/5.0
- Schools +4.0/10.0
- Livability +3.2/5.0
- Condition / age +2.5/5.0
- Appreciation +0.0/10.0
$272,500
🖨 Deal sheet 📄 Offer letter ✓ Due diligence
Listing remarks
Welcome to this 3-bedroom, 2-bath home located in the desirable gated community of Diamondhead. Designed with an open-concept layout, the home features beautiful tile flooring throughout the main living areas for easy maintenance, with carpet reserved for the bedrooms. The stunning kitchen offers a large prep island perfect for cooking and entertaining, while vaulted ceilings enhance the spacious feel of the living area. The primary suite includes a dual-sink vanity, walk-in shower, separate soaking tub, and a generous walk-in closet. Residents of Diamondhead enjoy access to Lake Catherine and a golf course within the neighborhood, along with excellent POA amenities including gated entrance
Key facts
- Gated community
- Dual-sink vanity
- Tile flooring
Tags
Property features AI
Finance
- Financial info: Financing options may include VA, FHA, conventional, and rural development loans
- HOA & community: Annual association fee of $1,300; Association maintains private roads
Exterior
- Parking: Attached garage for 2 cars
- Security: Gated entrance
- Utilities: Public sewer; Public water; Municipal electric service (Entergy)
- Home design: Brick and frame combination exterior; Irregular lot shape
- Construction: Architectural shingle roof; Slab foundation
- Exterior features: Swimming pool(s); Tennis court(s); Playground; Clubhouse; Party room; Gated entrance; Private roads (association); Paved road access; Sloped lot
Interior
- Kitchen: Electric range; Dishwasher
- Flooring: Carpet; Tile
- Bathrooms: 2 full bathrooms
- Heating & cooling: Central electric heating; Central electric cooling
- Interior features: Electric water heater; Sheetrock walls/ceilings
- Laundry & utility: Laundry room
Neighborhood map
What this means for you Summary
Snapshot
- This is a 3-bed/2.0-bath single-family listed at $272k.
Deal economics
- At list price, monthly cash flow is $264 ($3k/yr) — positive.
- The deal already cash-flows at list — no discount required.
- To meet the 1% rule (rent ≥ 1% of price), the offer needs to be $259k (5.0% below list).
- Recommended offer: $248k (9.0% below list) — sets the bar for market timing.
- Cap rate 7.5% vs local median 2.8% in Hot Springs — top-decile yield for the area; either an underpriced asset or a hidden risk that comps aren't pricing in. Stress-test before assuming the spread holds.
Location & tenants
- Location reads 65/100 on livability (#140 in AR) — a middle-class / working-renter tenant base. Strengths: cost of living A+, housing A+, health & safety A-; Watch: schools D, crime F, amenities F.
- Lakeside School District (urban): math 47% / reading 45% proficiency, ranked #28 of 238 in AR (top 12%) — families likely to look elsewhere, expect single-tenant / working-renter base with shorter leases.
- Market conditions: Rents rising fast (+6.4%/yr); 986 active listings in the ZIP; 3 comparable units currently listed for rent nearby; rentals lingering (median 44d on market — plan ~5-8 weeks vacancy on turnover, expect pricing pressure); 100% of comp listings sitting > 30 days — soft ceiling on asking rent; 117 units permitted in Garland County in 2024 (24 in 5+ unit buildings).
- At $2,589/mo this rent would consume 55% of the median local household income ($56k/yr) (locally 1442% of renters already pay >50% of income on rent) — very limited rent-growth headroom before tenants either downsize or default.
Forward outlook
- Local home prices are declining (-3.0%/yr); year-one equity from $2k of loan paydown is wiped out by about $8k of value loss. Plan a longer hold.
- Garland County population projected at +7% by 2050 — modest demand growth; plan on rents tracking national, not racing it.
Negotiation context
- It's been on market 95 days — a 9% lower offer ($248k) is reasonable based on typical stale-listing flexibility.
- 2 sale attempts since 13y ago; this cycle's ask has dropped $17k (6%) from the opening price — seller is motivated, your offer sets the floor, not the list.
- Current owner paid $179k; list at $272k implies a 52% gain — meaningful room to come down on a strong offer.
Risks & watch-outs
- Climate carrying-cost: extreme-heat days projected 7→20/yr by 2055 (HVAC capex compounding) — expect insurance premiums to compound above CPI over the hold.
Questions for the listing agent
- It's been on market 95 days. Have you received any prior offers? Is the seller open to a 9% concession, seller financing, or rate buy-down credit?
- What does the HOA fee cover, when was the last increase, and are there any pending special assessments or reserve-fund shortfalls?
- Why hasn't it sold? Are there any deal-killer items the seller is aware of (foundation, flood, title, zoning, code violations)?
- Is there a deadline driving the sale (1031 exchange, divorce, estate, relocation)? That informs how much negotiation room exists.
- Schools are D-rated, which usually means shorter tenancies and higher turnover. Who's the typical renter profile here, and what's been the actual vacancy rate?
- Crime grade is F in this area — have there been break-ins, vandalism, or insurance claims at this property in the last 3 years? What carrier currently insures it and at what premium?
- What's the average days-on-market for RENTAL listings here right now (not sales)? A rising rental-DOM trend means longer vacancies and softer asking-rent achievability than the comps imply.
- What's the recent tenant-quality profile in this submarket — average credit score on applications, eviction rate, late-payment / NSF rate, and stable-employment percentage? A property-management company in the area should have these aggregated.
- How much new for-sale + rental construction is in the pipeline within 1–3 miles? Heavy new supply typically softens prices + rents 12–24 months out; constrained supply supports both.
Investment metrics
- 1% rule
- 0.95% ✗
- Cap rate
- 7.45%
- Cash-on-cash
- 4.15%
- DSCR
- 1.18
- GRM
- 8.8
CMA / ARV
- ARV (on-the-fly)
- $311,296
- Comps found
- 12
Show comp detail 12 sales within ~0.75 mi
| Address | Dist | Beds/Ba | Sqft | Sold | Price | $/sf | Match |
|---|---|---|---|---|---|---|---|
| 307 Diamondhead Dr | 0.05mi | 3/2.0 | 1,951 (-5%) | 0mo | $360,000 | $185 | 90 |
| 310 Diamondhead | 0.02mi | 3/2.0 | 1,991 (-3%) | 17mo | $250,000 | $126 | 80 |
| 154 Diamondhead Dr | 0.43mi | 3/2.0 | 2,046 (-0%) | 18mo | $340,000 | $166 | 64 |
| 341 Diamondhead Dr | 0.20mi | 3/2.0 | 1,803 (-12%) | 9mo | $275,000 | $153 | 63 |
| 112 Blue Moon Ter | 0.42mi | 3/2.5 | 2,100 (+2%) | 20mo | $300,000 | $143 | 57 |
| 106 Tam O Shanter Ct | 0.30mi | 2/3.0 (-1) | 1,854 (-10%) | 8mo | $175,000 | $94 | 55 |
| 137 Wayfare Ct | 0.61mi | 4/2.0 (+1) | 2,013 (-2%) | 13mo | $241,000 | $120 | 53 |
| 104 Waterfall Ct | 0.66mi | 3/2.5 | 1,942 (-5%) | 13mo | $350,000 | $180 | 48 |
| 108 Waterfall Ct | 0.66mi | 3/2.0 | 1,838 (-10%) | 6mo | $280,000 | $152 | 47 |
| 210 Waikiki Dr | 0.56mi | 3/2.0 | 1,917 (-6%) | 21mo | $250,000 | $130 | 46 |
| 206 Pebble Beach Dr | 0.53mi | 4/2.0 (+1) | 1,885 (-8%) | 15mo | $329,900 | $175 | 44 |
| 116 Midpines | 0.65mi | 4/2.5 (+1) | 1,889 (-8%) | 12mo | $285,000 | $151 | 40 |
Match score weights: distance 35% · size 25% · config 20% · recency 20%. Top-matched comps best support the ARV.
Projected returns pro-forma
-3.0% appreciation · 6.43% rent growth · sell at horizon
- IRR
- -6.2%
- Equity multiple
- 0.76×
- Total profit
- $-18,137
- Equity at exit
- $40,631
- IRR
- 7.0%
- Equity multiple
- 1.61×
- Total profit
- $46,446
- Equity at exit
- $23,561
Cash invested: $76,300 (down + closing). Projections, not guarantees.
Landlord ↔ Tenant lean methodology
- Overall (STATE)
- 92 Strongly Landlord-Friendly
- State Arkansas
- 92 Strongly Landlord-Friendly · R+14
- County
- — inherits STATE
- City
- — inherits STATE
ZIP-level market 71913
- Home prices YoY
- -33.9%
- Rents YoY
- 6.4%
- Active inventory
- 986
- Price-to-rent
- 8.8×
Monthly cashflow live
- Estimated rent
- $2,589 medium interval (Pro) →
- Mortgage (P&I)
- −$1,429
- Tax from tax record
- −$131 /mo · $1,573/yr
- Insurance
- −$114
- HOA
- −$108
- Vacancy / Maint / Mgmt
- −$544
- Net cashflow
- $264
Break-even live
UW: 25.0% down · 7.5% · 30yr · 1.5% tax · 5.0% vac · 8.0% maint · 8.0% mgmt
Financing live
Cash to close
- Down payment
- $68,125
- Closing costs
- $8,175
- Reserves months
- —
- Total cash needed
- —
Loan-product check · same deal, 3 products live
Conventional
25% down · 7.5% · 30yr
- Down + closing
- —
- Monthly P&I
- —
- Monthly cashflow
- —
- DSCR
- —
- Eligible?
- —
Personal DTI + credit; lowest rate.
DSCR
20% down · 8.5% · 30yr
- Down + closing
- —
- Monthly P&I
- —
- Monthly cashflow
- —
- DSCR
- —
- Eligible?
- —
No personal income docs; deal must DSCR.
Hard money
10% down · 12.0% · 12mo
- Down + closing
- —
- Monthly P&I
- —
- Monthly cashflow
- —
- DSCR
- —
- Eligible?
- —
Short-term bridge; refi at stabilization.
Rent comps 3 comps
| Address | Beds | Baths | Sqft | Rent | $/sqft | DOM | Units | Dist |
|---|---|---|---|---|---|---|---|---|
| 167 Pebble Beach Pl Unit 1B Hot Springs National Park, AR | 3.0 | 2.5 | 1550 | $3,000 | $1.94 | 44d | 1 | 0.49mi |
| 167 Pebble Beach Pl Unit 1C Hot Springs National Park, AR | 3.0 | 2.5 | 1550 | $3,000 | $1.94 | 44d | 1 | 0.49mi |
| 113 Ohio Dr Hot Springs National Park, AR | 3.0 | 3.5 | 2869 | $3,500 | $1.22 | 44d | 1 | 0.63mi |
HOA detail
- Monthly dues
- $108 · $1,296/yr
- Likely covers
- security
Listing history 25 events
-
2026-06-19days on market $272,500 Active 95 DOM
-
2026-06-18days on market $272,500 Active 94 DOM
-
2026-06-17days on market $272,500 Active 93 DOM
-
2026-06-16days on market $272,500 Active 92 DOM
-
2026-06-15days on market $272,500 Active 91 DOM
-
2026-06-14days on market $272,500 Active 89 DOM
-
2026-06-13days on market $272,500 Active 88 DOM
-
2026-06-10days on market $272,500 Active 86 DOM
-
2026-06-09days on market $272,500 Active 85 DOM
-
2026-06-08days on market $272,500 Active 84 DOM
-
2026-06-07days on market $272,500 Active 83 DOM
-
2026-06-05days on market $272,500 Active 80 DOM
-
2026-06-03days on market $272,500 Active 79 DOM
-
2026-06-02days on market $272,500 Active 78 DOM
-
2026-06-01days on market $272,500 Active 77 DOM
-
2026-05-31days on market $272,500 Active 76 DOM
-
2026-05-30days on market $272,500 Active 75 DOM
-
2026-05-21price $272,500
-
2026-04-20price $280,000
-
2026-03-16$289,900 New Listing
-
2015-01-13soldstatus $179,000
-
2014-03-07historical
-
2013-12-18$189,900
-
2006-02-08soldstatus $16,000
-
1994-12-08soldstatus $2,000
ⓘ Source: listings_history table (triggers on properties + properties_extension) + one-shot
backfill from property_details.listing_events for pre-trigger history.
Tax reassessment forecast AR · Resets to sale price
- Current annual tax
- $1,573 · $131/mo
- Projected year-2 tax
- $1,744 · $145/mo
- Expected delta
- +$171/yr (+$14/mo · 10.9%)
ⓘ Screening estimate from a state-policy table — verify with the county assessor before closing.
Climate risk First Street
- Flood 1/10 Low FEMA zone X (unshaded) · 0% chance over 30 yrs
- Wildfire 4/10 Moderate
- Heat 6/10 Major 7 d/yr ≥109°F today · 20 d/yr by 30 yrs out
- Wind 4/10 Moderate 10% chance of damaging wind over 30 yrs
- Air quality 1/10 Low 0 unhealthy d/yr today · 0 by 30 yrs out
Nearby sold comps map
Loading sold comps map…
Walkable amenities ~0.75 mi
Loading nearby amenities…
Taxation est. · year 1
- Rental income
- $31,069
- − Mortgage interest
- −$15,264
- − Property taxes
- −$1,573
- − Insurance
- −$1,362
- − Repairs & maintenance
- −$2,486
- − Management
- −$2,486
- − HOA
- −$1,296
- − Depreciation
- −$7,927
- Taxable loss
- −$1,324
- Est. tax savings @ 24.0%
- +$318
- After-tax cash flow
- $3,483/yr
For passive investors: Depreciation is non-cash, so a rental often shows a tax loss while cash-flowing — sheltering income. Rental losses are passive: they offset passive income freely, and up to $25,000/yr can offset ordinary (W-2) income if you actively participate and your MAGI is under $100k (phasing out to $0 by $150k); unused losses carry forward. On sale, claimed depreciation is recaptured at up to 25%, and gains may owe capital-gains tax (a 1031 exchange can defer both). Figures are a year-1 estimate at your 24.0% rate — not tax advice; consult a CPA.
Schools (NCES district)
- District
- Lakeside School District
- NCES district ID
- 0508670
- Math proficiency
- 47% ▼ -16.00%
- Reading proficiency
- 45% ▼ -9.00%
- Median HH income
- $52,849
- Composite
- 39.76/100
- National rank
- #3884
- State rank
- #28 of 238 in AR
Livability — Hot Springs
- Score
- 65/100
- State rank
- #140
- US rank
- #12498
Category grades
Schools grade is shown separately in the Schools card above.
Census & demographics
- County
- Garland County · 76,414 people
- Metro
- Hot Springs, AR
- Population (ZIP)
- 47,477
- Household income
- $56,010
- Rent vs Own
- Severe rent burden
- 1442.0
Population outlook (Garland County) Hauer SSP2
- Today (2025)
- 100,343 people
- By 2030
- 101,880 · +1.5%
- By 2040
- 104,804 · +4.4%
- By 2050
- 107,292 · +6.9%
- By 2075
- 113,182 · +12.8%
- By 2100
- 112,247 · +11.9%
Race, ethnicity, and origin ACS 2023
- Neighborhood character
- Predominantly White (79%)
- Race & ethnicity
- White 79% Hispanic / Latino 8% Black 8% Two or more races 6% Asian 1%
- Hispanic origin (detail)
- Mexican 6%
- Common ancestry
- Italian 3% Lithuanian 2% Slovak 2%
- Foreign-born
- 5% · Canada
- Languages at home
- 91% English-only · Spanish 7% Other Indo-European 1%
Political lean MEDSL · Garland
- 2024 margin
- Solid R (+36.2) · D 30.8% · R 67.0% · Other 2.2%
- 2008→2024 swing
- -11.3pp toward R · 2008: -25.0pp · 2024: -36.2pp
- All cycles
- 2024: R+36.2 2020: R+34.0 2016: R+34.1 2012: R+29.9 2008: R+25.0
Not yet ingested
- Civics
- —
Market trends
- HPI YoY
- ▼ -137.67%
- Current HPI
- 268.5228
- Rent YoY
- ▲ 6.43%
- Metro
- Hot Springs, AR
- State GDP YoY
- ▲ 3.80%
- F500 in state
- 10
Industry mix (Fortune 500 HQ in AR)
| Industry | F500 HQs | Revenue |
|---|---|---|
| Retail | 1 | $681B |
|
||
| Food / Agriculture | 1 | $53B |
|
||
| Retail / Energy | 1 | $22B |
|
||
| Transportation / Logistics | 1 | $12B |
|
||
| Energy | 1 | $4B |
|
||
Price history
+13525.0% since first listed8 events — show timeline
- 2026-05-21 Price Changed $272,500 CARMLS
- 2026-04-20 Price Changed $280,000 CARMLS
- 2026-03-16 Listed $289,900 CARMLS
- 2015-01-13 Sold (Public Records) $179,000 Public Records
- 2014-03-07 Listing Removed — CARMLS
- 2013-12-18 Listed $189,900 CARMLS
- 2006-02-08 Sold (Public Records) $16,000 Public Records
- 1994-12-08 Sold (Public Records) $2,000 Public Records
Property tax history
+33.5%/yrLatest (2025): $1,573 · -1.2% YoY. Source: county tax records.
Cash-flow waterfall
monthlySold comps — $/sqft
last 12 mo · ≤1 miLoading sold comps…