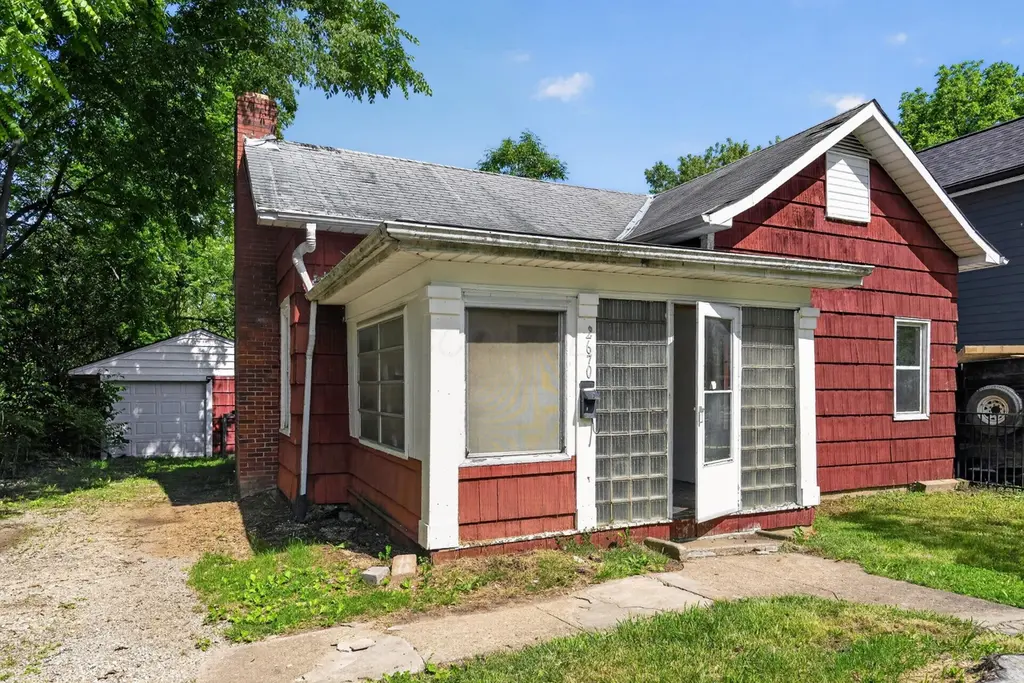
2670 Berrell Ave · Columbus, OH
Flood risk 1/10 · Minimal
- FEMA flood zone
- X (unshaded)
- Chance of flooding over 30 yrs
- 0.0%
- Est. flood insurance / yr
- $473 – $860
Fire risk 1/10 · Minimal
- Est. fire insurance / yr
- $713 – $1,323
Heat risk 3/10 · Minor
- Hot days now (above 99°F)
- 7 days/yr
- Hot days in 30 yrs
- 18 days/yr
Wind risk 2/10 · Minimal
- Chance of severe wind over 30 yrs
- 1.0%
Air-quality risk 3/10 · Minor
- Unhealthy air days now
- 2 days/yr
- Unhealthy air days in 30 yrs
- 4 days/yr
Risk factors via First Street. Map © Google.
Why this score? — see what drove the B- grade
The composite is a weighted blend of 9 inputs, each scored 0–100. Each bar is that input's sub-score; the figure is the points it added to the 100-point composite (weight × sub-score).
- Cash flow +25.1/30.0
- ARV discount +15.0/15.0
- DSCR +8.2/10.0
- 1% rule +7.2/10.0
- Livability +4.0/5.0
- Rent growth +3.4/5.0
- Condition / age +2.5/5.0
- Schools +1.7/10.0
- Appreciation +0.0/10.0
$99,900
🖨 Deal sheet 📄 Offer letter ✓ Due diligence
Listing remarks MLS
CORPORATE OWNER SELLING IN 'AS IS' CONDITION! EASY TO SHOW AND MAKE OFFER!
Key facts
- Functional layout
- Convenient location
- Easy access to parks
Tags
Property features AI
Exterior
- Parking: Detached garage (1 car)
- Utilities: Public water; Public sewer
- Home design: Single-family residence; One level; Built in 1919; No shared walls
- Construction: Block foundation
- Exterior features: Fenced yard
Interior
- Bedrooms: 3 main-level bedrooms
- Flooring: Wood flooring; Laminate flooring; Carpet; Vinyl
- Bathrooms: 1 full bathroom
- Heating & cooling: Forced air heating; Central air conditioning
- Interior features: Full basement; Insulated windows
Neighborhood map
What this means for you Summary
Snapshot
- This is a 3-bed/1.0-bath single-family listed at $100k.
Deal economics
- At list price, monthly cash flow is $222 ($3k/yr) — positive.
- The deal already cash-flows at list — no discount required.
- Meets the 1% rule at list price ($1k rent vs $100k).
- Cap rate 9.0% vs local median 3.8% in Columbus — top-decile yield for the area; either an underpriced asset or a hidden risk that comps aren't pricing in. Stress-test before assuming the spread holds.
Location & tenants
- Location reads 81/100 on livability (#97 in OH, #1,491 nationally) — a professional / high-income tenant draw. Strengths: commute A+, cost of living A+, housing A+; Watch: employment C-, crime F.
- Columbus City School District (urban): math 15% / reading 26% proficiency, ranked #626 of 656 in OH (top 95%) — low school quality limits family demand, transient renter base, plan for 1-2y turnover; 72% free/reduced lunch — lower-income household profile, screen leases tightly.
- Market conditions: Rents rising (+3.4%/yr); 166 active listings in the ZIP; 40 comparable units currently listed for rent nearby; rentals at typical pace (median 24d on market — plan ~3-4 weeks tenant-placement turnaround); lower-income renter base — watch delinquency; 8,139 units permitted in Franklin County in 2024 (5,940 in 5+ unit buildings).
- This rent runs 34% of the median local income ($43k/yr) — at the standard rent-burdened threshold; future hikes will face affordability resistance.
Forward outlook
- Local home prices are declining (-3.0%/yr); year-one equity from $691 of loan paydown is wiped out by about $3k of value loss. Plan a longer hold.
- Franklin County population projected at +34% by 2050 — long-run rental-demand tailwind backs the buy-and-hold thesis.
Negotiation context
- Only 14 days on market — expect competitive offers; lowballing is unlikely to land.
- 6 sale attempts since 25y ago with the ask held roughly flat each time — persistent listings suggest the price (not the market) is what's stuck; bring a comps-based counter.
Risks & watch-outs
- Watch-outs: built in 1919 — expect roof / HVAC / electrical / plumbing capex.
Questions for the listing agent
- Built in 1919 — when were the roof, HVAC, electrical panel, plumbing, and water heater last replaced?
- Is there a deadline driving the sale (1031 exchange, divorce, estate, relocation)? That informs how much negotiation room exists.
- Crime grade is F in this area — have there been break-ins, vandalism, or insurance claims at this property in the last 3 years? What carrier currently insures it and at what premium?
- What's the average days-on-market for RENTAL listings here right now (not sales)? A rising rental-DOM trend means longer vacancies and softer asking-rent achievability than the comps imply.
- What's the recent tenant-quality profile in this submarket — average credit score on applications, eviction rate, late-payment / NSF rate, and stable-employment percentage? A property-management company in the area should have these aggregated.
- How much new for-sale + rental construction is in the pipeline within 1–3 miles? Heavy new supply typically softens prices + rents 12–24 months out; constrained supply supports both.
Investment metrics
- 1% rule
- 1.22% ✓
- Cap rate
- 8.96%
- Cash-on-cash
- 9.52%
- DSCR
- 1.42
- GRM
- 6.8
CMA / ARV
- ARV (on-the-fly)
- $129,024
- Comps found
- 12
Show comp detail 12 sales within ~0.75 mi
| Address | Dist | Beds/Ba | Sqft | Sold | Price | $/sf | Match |
|---|---|---|---|---|---|---|---|
| 2805 Baughman Ave | 0.22mi | 3/1.0 | 956 (+7%) | 1mo | $125,000 | $131 | 78 |
| 2967 Woodland Ave | 0.51mi | 3/1.0 | 912 (+2%) | 0mo | $68,000 | $75 | 73 |
| 1888 Aberdeen Ave | 0.33mi | 3/1.0 | 948 (+6%) | 3mo | $125,000 | $132 | 72 |
| 2068 Agler Rd | 0.33mi | 2/1.0 (-1) | 960 (+7%) | 2mo | $138,500 | $144 | 66 |
| 2795 Perdue Ave | 0.25mi | 2/1.0 (-1) | 801 (-11%) | 2mo | $60,000 | $75 | 64 |
| 2224 Marcia Dr | 0.64mi | 2/1.0 (-1) | 884 (-1%) | 4mo | $100,500 | $114 | 60 |
| 2902 Northglen Dr | 0.60mi | 3/1.0 | 979 (+9%) | 0mo | $150,000 | $153 | 56 |
| 2861 Woodland Ave | 0.36mi | 3/2.0 | 1,011 (+13%) | 4mo | $185,000 | $183 | 55 |
| 2282 Dawnlight Ave | 0.69mi | 3/1.0 | 960 (+7%) | 3mo | $107,500 | $112 | 54 |
| 2468 Dawnlight Ave | 0.55mi | 2/1.0 (-1) | 800 (-11%) | 1mo | $180,000 | $225 | 50 |
| 2310 Brentnell Ave | 0.60mi | 2/1.0 (-1) | 984 (+10%) | 3mo | $183,000 | $186 | 48 |
| 1660 E Weber Rd | 0.65mi | 2/1.0 (-1) | 1,030 (+15%) | 0mo | $190,750 | $185 | 39 |
Match score weights: distance 35% · size 25% · config 20% · recency 20%. Top-matched comps best support the ARV.
Projected returns pro-forma
-3.0% appreciation · 3.41% rent growth · sell at horizon
- IRR
- -1.4%
- Equity multiple
- 0.95×
- Total profit
- $-1,501
- Equity at exit
- $14,895
- IRR
- 8.8%
- Equity multiple
- 1.69×
- Total profit
- $19,194
- Equity at exit
- $8,638
Cash invested: $27,972 (down + closing). Projections, not guarantees.
Landlord ↔ Tenant lean methodology
- Overall (STATE)
- 73 Landlord-Friendly
- State Ohio
- 73 Landlord-Friendly · R+6
- County
- — inherits STATE
- City
- — inherits STATE
ZIP-level market 43211
- Home prices YoY
- -27.3%
- Rents YoY
- 3.4%
- Active inventory
- 166
- Price-to-rent
- 6.8×
Monthly cashflow live
- Estimated rent
- $1,223 high interval (Pro) →
- Mortgage (P&I)
- −$524
- Tax from tax record
- −$179 /mo · $2,150/yr
- Insurance
- −$42
- HOA
- −$0
- Vacancy / Maint / Mgmt
- −$257
- Net cashflow
- $222
Break-even live
UW: 25.0% down · 7.5% · 30yr · 1.5% tax · 5.0% vac · 8.0% maint · 8.0% mgmt
Financing live
Cash to close
- Down payment
- $24,975
- Closing costs
- $2,997
- Reserves months
- —
- Total cash needed
- —
Loan-product check · same deal, 3 products live
Conventional
25% down · 7.5% · 30yr
- Down + closing
- —
- Monthly P&I
- —
- Monthly cashflow
- —
- DSCR
- —
- Eligible?
- —
Personal DTI + credit; lowest rate.
DSCR
20% down · 8.5% · 30yr
- Down + closing
- —
- Monthly P&I
- —
- Monthly cashflow
- —
- DSCR
- —
- Eligible?
- —
No personal income docs; deal must DSCR.
Hard money
10% down · 12.0% · 12mo
- Down + closing
- —
- Monthly P&I
- —
- Monthly cashflow
- —
- DSCR
- —
- Eligible?
- —
Short-term bridge; refi at stabilization.
Rent comps 40 comps
| Address | Beds | Baths | Sqft | Rent | $/sqft | DOM | Units | Dist |
|---|---|---|---|---|---|---|---|---|
| 2718 Fern Ave Columbus, OH | 3.0 | 1.0 | 1100 | $1,640 | $1.49 | 43d | 1 | 0.16mi |
| 2707 Woodland Ave Columbus, OH | 3.0 | 1.0 | 957 | $1,400 | $1.46 | 17d | 1 | 0.26mi |
| 2836-2850 Baughman Ave Unit 2846 Columbus, OH | 2.0 | 1.0 | 765 | $950 | $1.24 | 43d | 1 | 0.28mi |
| 2836-2850 Baughman Ave Unit 2844 Columbus, OH | 2.0 | 1.0 | 1020 | $950 | $0.93 | 16d | 1 | 0.28mi |
| 2844 Baughman Ave Columbus, OH | 2.0 | 1.0 | 1020 | $950 | $0.93 | 16d | 1 | 0.28mi |
| 2846 Baughman Ave Columbus, OH | 2.0 | 1.0 | 765 | $950 | $1.24 | 43d | 1 | 0.28mi |
| 1911 Denune Ave Columbus, OH | 2.0 | 1.0 | 645 | $925 | $1.43 | 43d | 1 | 0.30mi |
| 1911 Denune Ave Columbus, OH | 2.0 | 1.0 | 645 | $795 | $1.23 | 1d | 1 | 0.30mi |
| 2846 Joyce Ave Apt C Columbus, OH | 2.0 | 1.0 | 645 | $815 | $1.26 | 23d | 1 | 0.31mi |
| 2228 Minnesota Ave Columbus, OH | 2.0 | 1.0 | 1025 | $1,245 | $1.21 | 16d | 1 | 0.36mi |
| 1928 Agler Rd Columbus, OH | 2.0 | 1.0 | 1000 | $875 | $0.88 | 43d | 1 | 0.44mi |
| 1849 Robert St Columbus, OH | 3.0 | 1.0 | 816 | $1,300 | $1.59 | 3d | 1 | 0.46mi |
| 2317 Parkwood Ave Columbus, OH | 2.0 | 1.0 | 672 | $995 | $1.48 | 7d | 1 | 0.53mi |
| 2765 Cleveland Ave Unit B Columbus, OH | 2.0 | 1.0 | 1100 | $990 | $0.90 | 17d | 1 | 0.53mi |
| 2919 Bridgewalk St Unit 2919 Columbus, OH | 2.0 | 1.0 | 806 | $995 | $1.23 | 7d | 1 | 0.57mi |
| 2291 Taylor Ave Columbus, OH | 3.0 | 1.0 | 979 | $1,300 | $1.33 | 43d | 1 | 0.59mi |
| 2901 Bridgewalk St Unit 2901 Columbus, OH | 3.0 | 1.5 | 950 | $1,295 | $1.36 | 23d | 1 | 0.59mi |
| 2761 Wedge St Columbus, OH | 2.0 | 1.0 | 765 | $995 | $1.30 | 21d | 1 | 0.62mi |
| 2761 Wedge St Columbus, OH | 2.0 | 1.0 | 765 | $970 | $1.27 | 7d | 1 | 0.62mi |
| 2695 Divot Pl Unit 2676 Columbus, OH | 3.0 | 2.0 | 1050 | $1,149 | $1.09 | 43d | 1 | 0.62mi |
| 2341 Dawnlight Ave Columbus, OH | 3.0 | 1.0 | 920 | $1,550 | $1.68 | 3d | 1 | 0.63mi |
| 1954 Oakland Park Ave Unit C Columbus, OH | 2.0 | 1.0 | 1000 | $1,050 | $1.05 | 43d | 1 | 0.65mi |
| 1952 Oakland Park Ave Unit C Columbus, OH | 2.0 | 1.0 | 1000 | $900 | $0.90 | 23d | 1 | 0.67mi |
| 1952 Oakland Park Ave Apt A Columbus, OH | 2.0 | 1.0 | 1000 | $1,050 | $1.05 | 43d | 1 | 0.67mi |
| 1576-1578 Arlington Ave Unit 1576 Columbus, OH | 2.0 | 1.0 | 902 | $1,000 | $1.11 | 43d | 1 | 0.79mi |
| 1530 Genessee Ave Unit B Columbus, OH | 2.0 | 1.0 | 800 | $1,150 | $1.44 | 3d | 1 | 0.83mi |
| 1524 Genessee Ave Unit A Columbus, OH | 2.0 | 1.0 | 800 | $1,150 | $1.44 | 2d | 1 | 0.85mi |
| 3257 Cleveland Ave Apt C Columbus, OH | 2.0 | 1.0 | 975 | $1,000 | $1.03 | 43d | 1 | 0.91mi |
| 1435 Republic Ave Columbus, OH | 3.0 | 1.0 | 908 | $1,395 | $1.54 | 7d | 1 | 1.04mi |
| 1435 Republic Ave Columbus, OH | 3.0 | 1.0 | 908 | $1,425 | $1.57 | 19d | 1 | 1.04mi |
| 1577 Cordell Ave Columbus, OH | 2.0 | 1.0 | 882 | $1,000 | $1.13 | 2d | 1 | 1.05mi |
| 1549-1551 Oakland Park Ave Columbus, OH | 2.0 | 1.0 | 832 | $1,100 | $1.32 | 21d | 1 | 1.06mi |
| 1879 Jermain Dr Columbus, OH | 4.0 | 1.0 | 1077 | $1,800 | $1.67 | 43d | 1 | 1.13mi |
| 1352 E Hudson St Columbus, OH | 2.0 | 1.0 | 800 | $1,150 | $1.44 | 43d | 1 | 1.17mi |
| 1269 Minnesota Ave Columbus, OH | 3.0 | 1.0 | 1075 | $1,550 | $1.44 | 7d | 1 | 1.20mi |
| 1609-1611 E 26th Ave Columbus, OH | 2.0 | 1.0 | 1080 | $1,150 | $1.06 | 2d | 1 | 1.21mi |
| 1609-1611 E 26th Ave Columbus, OH | 2.0 | 1.0 | 1080 | $1,200 | $1.11 | 23d | 1 | 1.21mi |
| 1500 E 25th Ave Columbus, OH | 2.0 | 1.0 | 720 | $850 | $1.18 | 43d | 1 | 1.31mi |
| 1500 E 25th Ave Unit 2 Columbus, OH | 2.0 | 1.0 | 720 | $850 | $1.18 | 23d | 1 | 1.31mi |
| 2132 Elmore Ave Columbus, OH | 3.0 | 1.0 | 1000 | $1,245 | $1.25 | 23d | 1 | 1.32mi |
Listing history 11 events
-
2026-06-18days on market $99,900 Active 14 DOM
-
2026-06-17days on market $99,900 Active 13 DOM
-
2026-06-16days on market $99,900 Active 12 DOM
-
2026-06-15days on market $99,900 Active 11 DOM
-
2026-06-13days on market $99,900 Active 9 DOM
-
2026-06-13days on market $99,900 Active 8 DOM
-
2026-06-09days on market $99,900 Active 5 DOM
-
2026-06-08days on market $99,900 Active 4 DOM
-
2026-06-07days on market $99,900 Active 3 DOM
-
2026-06-05remarks 432-char remark
-
2026-06-05$99,900 Active 1 DOM
ⓘ Source: listings_history table (triggers on properties + properties_extension) + one-shot
backfill from property_details.listing_events for pre-trigger history.
Tax reassessment forecast OH · Partial reset (capped growth)
- Current annual tax
- $2,150 · $179/mo
- Projected year-2 tax
- $2,150 · $179/mo
- Expected delta
- $0/yr ($0/mo · 0.0%)
ⓘ Screening estimate from a state-policy table — verify with the county assessor before closing.
Climate risk First Street
- Flood 1/10 Low FEMA zone X (unshaded) · 0% chance over 30 yrs
- Wildfire 1/10 Low
- Heat 3/10 Moderate 7 d/yr ≥99°F today · 18 d/yr by 30 yrs out
- Wind 2/10 Low 100% chance of damaging wind over 30 yrs
- Air quality 3/10 Moderate 2 unhealthy d/yr today · 4 by 30 yrs out
Nearby sold comps map
Loading sold comps map…
Walkable amenities ~0.75 mi
Loading nearby amenities…
Taxation est. · year 1
- Rental income
- $14,682
- − Mortgage interest
- −$5,596
- − Property taxes
- −$2,150
- − Insurance
- −$500
- − Repairs & maintenance
- −$1,175
- − Management
- −$1,175
- − Depreciation
- −$2,906
- Taxable income
- $1,181
- Est. tax owed @ 24.0%
- −$283
- After-tax cash flow
- $2,379/yr
For passive investors: Depreciation is non-cash, so a rental often shows a tax loss while cash-flowing — sheltering income. Rental losses are passive: they offset passive income freely, and up to $25,000/yr can offset ordinary (W-2) income if you actively participate and your MAGI is under $100k (phasing out to $0 by $150k); unused losses carry forward. On sale, claimed depreciation is recaptured at up to 25%, and gains may owe capital-gains tax (a 1031 exchange can defer both). Figures are a year-1 estimate at your 24.0% rate — not tax advice; consult a CPA.
Schools (NCES district)
- District
- Columbus City School District
- NCES district ID
- 3904380
- Math proficiency
- 15% ▼ -17.00%
- Reading proficiency
- 26% ▼ -12.00%
- Median HH income
- $38,483
- Composite
- 17.19/100
- National rank
- #9105
- State rank
- #626 of 656 in OH
Livability — Columbus
- Score
- 81/100
- State rank
- #97
- US rank
- #1491
Category grades
Schools grade is shown separately in the Schools card above.
Census & demographics
- County
- Franklin County · 1,351,780 people
- City population
- 612,189
- Metro
- Columbus, OH
- Population (ZIP)
- 22,313
- Household income
- $42,579
- Rent vs Own
- Severe rent burden
- 1282.0
Population outlook (Franklin County) Hauer SSP2
- Today (2025)
- 1,456,139 people
- By 2030
- 1,556,890 · +6.9%
- By 2040
- 1,757,349 · +20.7%
- By 2050
- 1,950,539 · +34.0%
- By 2075
- 2,376,171 · +63.2%
- By 2100
- 2,636,796 · +81.1%
Race, ethnicity, and origin ACS 2023
- Neighborhood character
- Diverse neighborhood (Simpson 0.60)
- Race & ethnicity
- Black 58% White 21% Hispanic / Latino 13% Two or more races 12% Asian 2%
- Hispanic origin (detail)
- Mexican 8% Dominican 1%
- Common ancestry
- Italian 1%
- Foreign-born
- 10% · Canada, India
- Languages at home
- 84% English-only · Spanish 11% Other Indo-European 2% Arabic 1%
Political lean MEDSL · Franklin
- 2024 margin
- Strong D (+28.4) · D 63.7% · R 35.3% · Other 1.0%
- 2008→2024 swing
- +7.7pp toward D · 2008: 20.7pp · 2024: 28.4pp
- All cycles
- 2024: D+28.4 2020: D+31.4 2016: D+25.9 2012: D+21.7 2008: D+20.7
Not yet ingested
- Civics
- —
Market trends
- HPI YoY
- ▼ -94.10%
- Current HPI
- 250.3885
- Rent YoY
- ▲ 3.41%
- Metro
- Columbus, OH
- State GDP YoY
- ▲ 1.98%
- F500 in state
- 48
Industry mix (Fortune 500 HQ in OH)
| Industry | F500 HQs | Revenue |
|---|---|---|
| Insurance | 3 | $145B |
|
||
| Industrial Machinery | 3 | $49B |
|
||
| Financial Services | 3 | $24B |
|
||
| Consumer Goods | 2 | $93B |
|
||
| Aerospace / Defense | 2 | $47B |
|
||
| Utilities | 2 | $33B |
|
||
Price history
+100.2% since first listed15 events — show timeline
- 2026-06-04 Listed $99,900 CBRMLS
- 2022-11-02 Sold (Public Records) $3,601,400 Public Records
- 2006-08-21 Sold (MLS) $35,000 CBRMLS
- 2006-08-02 Listing Removed — CBRMLS
- 2006-06-27 Listed $38,000 CBRMLS
- 2006-01-03 Listing Removed — CBRMLS
- 2005-07-07 Listed $49,000 CBRMLS
- 2004-12-17 Listing Removed — CBRMLS
- 2004-02-07 Listed $47,000 CBRMLS
- 2002-04-01 Sold (Public Records) $35,000 Public Records
- 2002-03-25 Sold (MLS) $35,000 CBRMLS
- 2002-02-19 Listing Removed — CBRMLS
- 2002-01-08 Listed $39,800 CBRMLS
- 2001-12-02 Listing Removed — CBRMLS
- 2001-05-09 Listed $49,900 CBRMLS
Property tax history
+8.8%/yrLatest (2024): $2,150 · +1.3% YoY. Source: county tax records.
Cash-flow waterfall
monthlySold comps — $/sqft
last 12 mo · ≤1 miLoading sold comps…