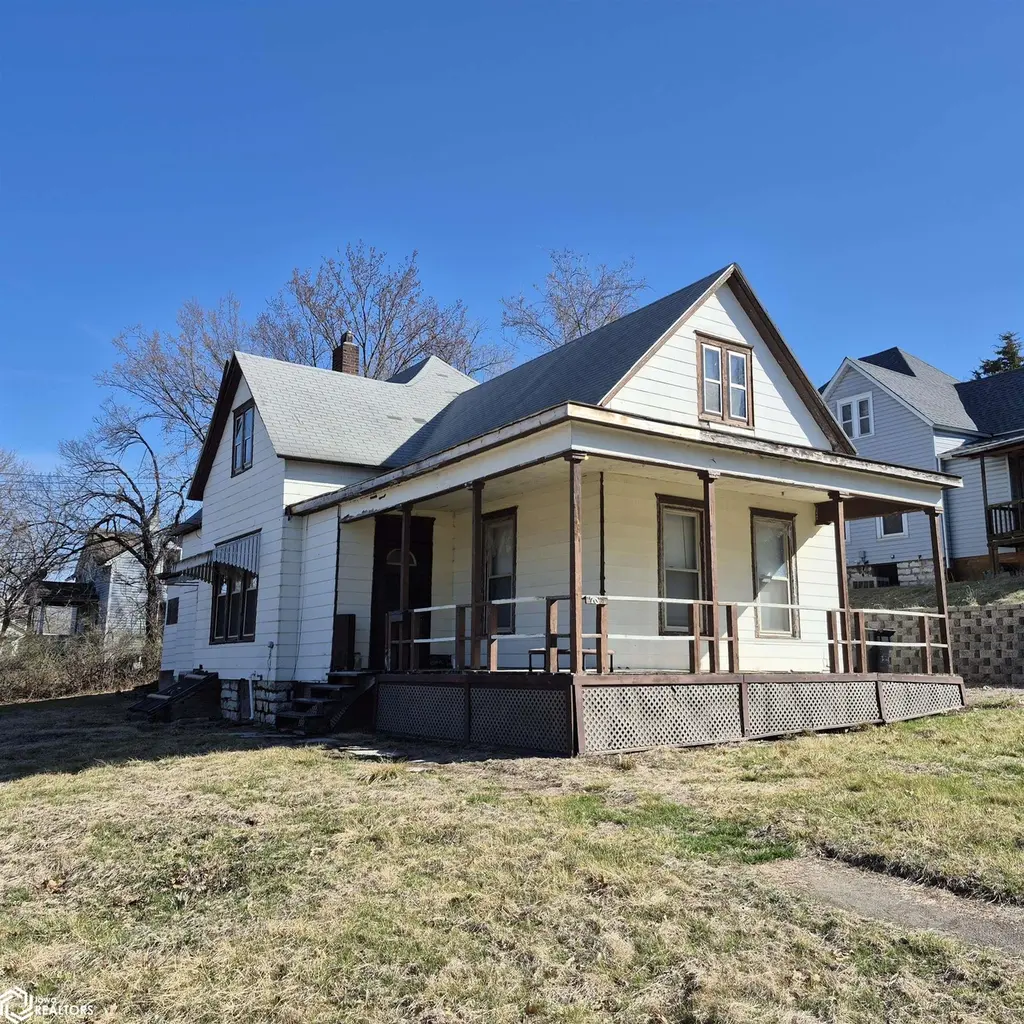
703 Center Ave · Ottumwa, IA
Flood risk 1/10 · Minimal
- FEMA flood zone
- X (unshaded)
- Chance of flooding over 30 yrs
- 0.0%
- Est. flood insurance / yr
- $473 – $860
Fire risk 4/10 · Minor
- Est. fire insurance / yr
- $902 – $1,676
Heat risk 3/10 · Minor
- Hot days now (above 106°F)
- 7 days/yr
- Hot days in 30 yrs
- 15 days/yr
Wind risk 2/10 · Minimal
- Chance of severe wind over 30 yrs
- —
Air-quality risk 2/10 · Minimal
- Unhealthy air days now
- 1 days/yr
- Unhealthy air days in 30 yrs
- 1 days/yr
Risk factors via First Street. Map © Google.
Why this score? — see what drove the B grade
The composite is a weighted blend of 9 inputs, each scored 0–100. Each bar is that input's sub-score; the figure is the points it added to the 100-point composite (weight × sub-score).
- Cash flow +25.7/30.0
- ARV discount +15.0/15.0
- 1% rule +8.7/10.0
- DSCR +8.6/10.0
- Schools +4.3/10.0
- Livability +4.0/5.0
- Rent growth +2.5/5.0
- Condition / age +2.5/5.0
- Appreciation +0.0/10.0
$47,500
🖨 Deal sheet 📄 Offer letter ✓ Due diligence
Listing remarks MLS
Offered for sale for the first time in 30 years. Lots of floor space with tall ceilings in this home. Wrap around front porch & walk up attic ideal for additional finished living space. Several updates but needs more. Located close to the high school and athletic activities centers.
Key facts
- Walk up attic
- Close to high school
- 8,382 sq ft lot
Tags
Neighborhood map
What this means for you Summary
Snapshot
- This is a 3-bed/1.0-bath single-family listed at $48k.
Deal economics
- At list price, monthly cash flow is $114 ($1k/yr) — positive.
- The deal already cash-flows at list — no discount required.
- Meets the 1% rule at list price ($650 rent vs $48k).
- Recommended offer: $45k (6.0% below list) — sets the bar for market timing.
- Cap rate 9.2% vs local median 5.9% in Ottumwa — top-decile yield for the area; either an underpriced asset or a hidden risk that comps aren't pricing in. Stress-test before assuming the spread holds.
Location & tenants
- Location reads 80/100 on livability (#91 in IA, #1,900 nationally) — a professional / high-income tenant draw. Strengths: cost of living A+, housing A+, health & safety A+; Watch: crime D-, employment D-.
- Ottumwa Community School District (town): math 50% / reading 54% proficiency, ranked #277 of 289 in IA (top 96%) — acceptable for families but not a draw, mixed tenant base, ~2y average lease.
- Market conditions: 186 active listings in the ZIP; 1 comparable units currently listed for rent nearby; 44 units permitted in Wapello County in 2024 (0 in 5+ unit buildings).
Forward outlook
- Local home prices are declining (-3.0%/yr); year-one equity from $328 of loan paydown is wiped out by about $1k of value loss. Plan a longer hold.
- Wapello County population projected at +5% by 2050 — modest demand growth; plan on rents tracking national, not racing it.
Negotiation context
- It's been on market 89 days — a 6% lower offer ($45k) is reasonable based on typical stale-listing flexibility.
Risks & watch-outs
- Watch-outs: property tax is 3.3% of price; built in 1910 — expect roof / HVAC / electrical / plumbing capex.
Questions for the listing agent
- It's been on market 89 days. Have you received any prior offers? Is the seller open to a 6% concession, seller financing, or rate buy-down credit?
- Built in 1910 — when were the roof, HVAC, electrical panel, plumbing, and water heater last replaced?
- Property tax is high relative to price — has the assessment been appealed recently, and will the sale trigger a re-assessment?
- Why hasn't it sold? Are there any deal-killer items the seller is aware of (foundation, flood, title, zoning, code violations)?
- Is there a deadline driving the sale (1031 exchange, divorce, estate, relocation)? That informs how much negotiation room exists.
- Crime grade is D in this area — have there been break-ins, vandalism, or insurance claims at this property in the last 3 years? What carrier currently insures it and at what premium?
- What's the average days-on-market for RENTAL listings here right now (not sales)? A rising rental-DOM trend means longer vacancies and softer asking-rent achievability than the comps imply.
- What's the recent tenant-quality profile in this submarket — average credit score on applications, eviction rate, late-payment / NSF rate, and stable-employment percentage? A property-management company in the area should have these aggregated.
- How much new for-sale + rental construction is in the pipeline within 1–3 miles? Heavy new supply typically softens prices + rents 12–24 months out; constrained supply supports both.
Investment metrics
- 1% rule
- 1.37% ✓
- Cap rate
- 9.18%
- Cash-on-cash
- 10.31%
- DSCR
- 1.46
- GRM
- 6.1
CMA / ARV
- ARV (median comp)
- $91,079
- List price
- $47,500
- Delta
- -47.85%
- Verdict
- UNDERPRICED
- Comps
- 20 within 1.0 mi
Show comp detail 11 sales within ~0.75 mi
| Address | Dist | Beds/Ba | Sqft | Sold | Price | $/sf | Match |
|---|---|---|---|---|---|---|---|
| 222 N Fellows Ave | 0.37mi | 3/1.5 | 2,164 (+1%) | 13mo | $121,000 | $56 | 68 |
| 427 N Court St | 0.50mi | 4/2.0 (+1) | 2,155 (+1%) | 4mo | $35,500 | $16 | 63 |
| 513 Camille St | 0.28mi | 3/1.5 | 1,898 (-11%) | 4mo | $12,000 | $6 | 62 |
| 624 E 2nd St | 0.32mi | 3/2.0 | 2,040 (-5%) | 14mo | $110,000 | $54 | 62 |
| 115 N Elm St | 0.37mi | 3/2.0 | 2,004 (-6%) | 13mo | $137,000 | $68 | 57 |
| 359 N Marion St | 0.62mi | 3/2.0 | 2,027 (-5%) | 7mo | $208,000 | $103 | 52 |
| 322 N Fellows Ave | 0.33mi | 4/2.0 (+1) | 2,068 (-3%) | 22mo | $129,000 | $62 | 52 |
| 132 Lincoln Ave | 0.49mi | 4/1.5 (+1) | 2,328 (+9%) | 13mo | $45,000 | $19 | 45 |
| 146 S Cooper Ave | 0.50mi | 3/1.0 | 1,948 (-9%) | 20mo | $110,697 | $57 | 45 |
| 328 N Washington St | 0.51mi | 4/2.0 (+1) | 1,867 (-13%) | 3mo | $60,500 | $32 | 43 |
| 210 E Pennsylvania Ave | 0.73mi | 3/2.5 | 2,400 (+12%) | 20mo | $224,000 | $93 | 23 |
Match score weights: distance 35% · size 25% · config 20% · recency 20%. Top-matched comps best support the ARV.
Projected returns pro-forma
-3.0% appreciation · 3.0% rent growth · sell at horizon
- IRR
- -0.7%
- Equity multiple
- 0.97×
- Total profit
- $-365
- Equity at exit
- $7,082
- IRR
- 9.0%
- Equity multiple
- 1.70×
- Total profit
- $9,271
- Equity at exit
- $4,107
Cash invested: $13,300 (down + closing). Projections, not guarantees.
Landlord ↔ Tenant lean methodology
- Overall (STATE)
- 83 Strongly Landlord-Friendly
- State Iowa
- 83 Strongly Landlord-Friendly · R+6
- County
- — inherits STATE
- City
- — inherits STATE
ZIP-level market 52501
- Active inventory
- 186
- Price-to-rent
- 6.1×
Monthly cashflow live
- Estimated rent
- $650 medium interval (Pro) →
- Mortgage (P&I)
- −$249
- Tax from tax record
- −$130 /mo · $1,564/yr
- Insurance
- −$20
- HOA
- −$0
- Vacancy / Maint / Mgmt
- −$136
- Net cashflow
- $114
Break-even live
UW: 25.0% down · 7.5% · 30yr · 1.5% tax · 5.0% vac · 8.0% maint · 8.0% mgmt
Financing live
Cash to close
- Down payment
- $11,875
- Closing costs
- $1,425
- Reserves months
- —
- Total cash needed
- —
Loan-product check · same deal, 3 products live
Conventional
25% down · 7.5% · 30yr
- Down + closing
- —
- Monthly P&I
- —
- Monthly cashflow
- —
- DSCR
- —
- Eligible?
- —
Personal DTI + credit; lowest rate.
DSCR
20% down · 8.5% · 30yr
- Down + closing
- —
- Monthly P&I
- —
- Monthly cashflow
- —
- DSCR
- —
- Eligible?
- —
No personal income docs; deal must DSCR.
Hard money
10% down · 12.0% · 12mo
- Down + closing
- —
- Monthly P&I
- —
- Monthly cashflow
- —
- DSCR
- —
- Eligible?
- —
Short-term bridge; refi at stabilization.
Rent comps 1 comps
| Address | Beds | Baths | Sqft | Rent | $/sqft | DOM | Units | Dist |
|---|---|---|---|---|---|---|---|---|
| 951 N Court St Ottumwa, IA | 2.0 | 1.0 | 1900 | $650 | $0.34 | 43d | 1 | 0.92mi |
Listing history 16 events
-
2026-06-18days on market $47,500 Active 89 DOM
-
2026-06-17days on market $47,500 Active 88 DOM
-
2026-06-16days on market $47,500 Active 87 DOM
-
2026-06-15days on market $47,500 Active 86 DOM
-
2026-06-13days on market $47,500 Active 84 DOM
-
2026-06-12days on market $47,500 Active 83 DOM
-
2026-06-09days on market $47,500 Active 80 DOM
-
2026-06-08days on market $47,500 Active 79 DOM
-
2026-06-07days on market $47,500 Active 78 DOM
-
2026-06-07days on market $47,500 Active 77 DOM
-
2026-06-04days on market $47,500 Active 74 DOM
-
2026-06-02days on market $47,500 Active 73 DOM
-
2026-06-01days on market $47,500 Active 72 DOM
-
2026-05-31days on market $47,500 Active 71 DOM
-
2026-05-31pricedays on market $47,500 Active 70 DOM
-
2026-03-19$52,000 Active 289-char remark
Show marketing remark (289 chars)
Offered for sale for the first time in 30 years. Lots of floor space with tall ceilings in this home. Wrap around front porch & walk up attic ideal for additional finished living space. Several updates but needs more. Located close to the high school and athletic activities centers.
ⓘ Source: listings_history table (triggers on properties + properties_extension) + one-shot
backfill from property_details.listing_events for pre-trigger history.
Tax reassessment forecast IA · Partial reset (capped growth)
- Current annual tax
- $1,564 · $130/mo
- Projected year-2 tax
- $1,564 · $130/mo
- Expected delta
- $0/yr ($0/mo · 0.0%)
ⓘ Screening estimate from a state-policy table — verify with the county assessor before closing.
Climate risk First Street
- Flood 1/10 Low FEMA zone X (unshaded) · 0% chance over 30 yrs
- Wildfire 4/10 Moderate
- Heat 3/10 Moderate 7 d/yr ≥106°F today · 15 d/yr by 30 yrs out
- Wind 2/10 Low
- Air quality 2/10 Low 1 unhealthy d/yr today · 1 by 30 yrs out
Nearby sold comps map
Loading sold comps map…
Walkable amenities ~0.75 mi
Loading nearby amenities…
Taxation est. · year 1
- Rental income
- $7,800
- − Mortgage interest
- −$2,661
- − Property taxes
- −$1,564
- − Insurance
- −$238
- − Repairs & maintenance
- −$624
- − Management
- −$624
- − Depreciation
- −$1,382
- Taxable income
- $708
- Est. tax owed @ 24.0%
- −$170
- After-tax cash flow
- $1,201/yr
For passive investors: Depreciation is non-cash, so a rental often shows a tax loss while cash-flowing — sheltering income. Rental losses are passive: they offset passive income freely, and up to $25,000/yr can offset ordinary (W-2) income if you actively participate and your MAGI is under $100k (phasing out to $0 by $150k); unused losses carry forward. On sale, claimed depreciation is recaptured at up to 25%, and gains may owe capital-gains tax (a 1031 exchange can defer both). Figures are a year-1 estimate at your 24.0% rate — not tax advice; consult a CPA.
Schools (NCES district)
- District
- Ottumwa Community School District
- NCES district ID
- 1922110
- Math proficiency
- 50% ▼ -9.00%
- Reading proficiency
- 54% ▲ 1.00%
- Median HH income
- $39,864
- Composite
- 43.46/100
- National rank
- #3004
- State rank
- #277 of 289 in IA
Livability — Ottumwa
- Score
- 80/100
- State rank
- #91
- US rank
- #1900
Category grades
Schools grade is shown separately in the Schools card above.
Census & demographics
- Census place
- Ottumwa, IA
- Population (ZIP)
- 30,341
Population outlook (Wapello County) Hauer SSP2
- Today (2025)
- 35,472 people
- By 2030
- 35,563 · +0.3%
- By 2040
- 36,083 · +1.7%
- By 2050
- 37,287 · +5.1%
- By 2075
- 43,898 · +23.8%
- By 2100
- 52,973 · +49.3%
Race, ethnicity, and origin ACS 2023
- Neighborhood character
- Predominantly White (74%)
- Race & ethnicity
- White 74% Hispanic / Latino 14% Two or more races 7% Black 4% Pacific Islander 2% Asian 2%
- Hispanic origin (detail)
- Mexican 9%
- Common ancestry
- Iranian 4% Italian 1% Slovak 1%
- Foreign-born
- 11% · Canada
- Languages at home
- 84% English-only · Spanish 10% Other Asian/Pacific 3% Tagalog/Filipino 1%
Political lean MEDSL · Wapello
- 2024 margin
- Solid R (+31.4) · D 33.6% · R 65.0% · Other 1.4%
- 2008→2024 swing
- -45.0pp toward R · 2008: 13.5pp · 2024: -31.4pp
- All cycles
- 2024: R+31.4 2020: R+23.6 2016: R+20.8 2012: D+11.8 2008: D+13.5
Not yet ingested
- Civics
- —
Market trends
- HPI YoY
- ▼ -94.66%
- Current HPI
- 174.6021
- Rent YoY
- —
- Metro
- —
- State GDP YoY
- ▲ 2.48%
- F500 in state
- 4
Industry mix (Fortune 500 HQ in IA)
| Industry | F500 HQs | Revenue |
|---|---|---|
| Financial Services | 1 | $16B |
|
||
| Retail / Convenience | 1 | $15B |
|
||
Price history
1 event — show timeline
- 2026-03-19 Listed $52,000 IAR
Property tax history
+6.4%/yrLatest (2025): $1,564 · +5.7% YoY. Source: county tax records.
Cash-flow waterfall
monthlySold comps — $/sqft
last 12 mo · ≤1 miLoading sold comps…