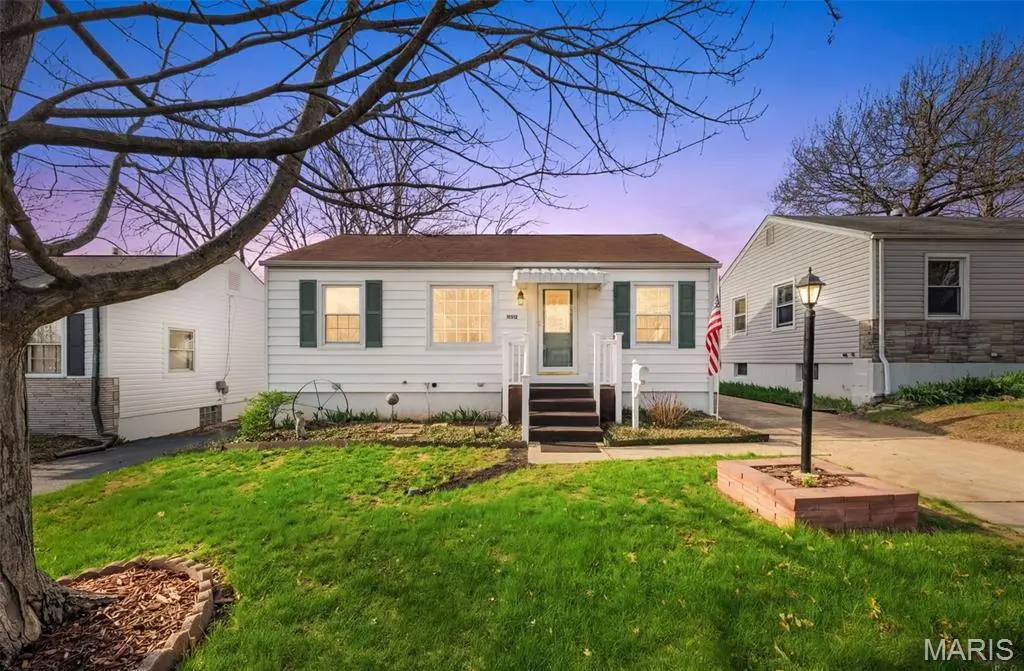
10512 Saint Francis Ln · St. Ann, MO
Flood risk 1/10 · Minimal
- FEMA flood zone
- X (unshaded)
- Chance of flooding over 30 yrs
- 0.0%
- Est. flood insurance / yr
- $473 – $860
Fire risk 1/10 · Minimal
- Est. fire insurance / yr
- $1,054 – $1,958
Heat risk 4/10 · Minor
- Hot days now (above 106°F)
- 7 days/yr
- Hot days in 30 yrs
- 21 days/yr
Wind risk 2/10 · Minimal
- Chance of severe wind over 30 yrs
- 1.0%
Air-quality risk 2/10 · Minimal
- Unhealthy air days now
- 1 days/yr
- Unhealthy air days in 30 yrs
- 3 days/yr
Risk factors via First Street. Map © Google.
Why this score? — see what drove the D grade
The composite is a weighted blend of 9 inputs, each scored 0–100. Each bar is that input's sub-score; the figure is the points it added to the 100-point composite (weight × sub-score).
- Cash flow +14.6/30.0
- ARV discount +7.9/15.0
- DSCR +4.5/10.0
- 1% rule +3.7/10.0
- Rent growth +3.5/5.0
- Livability +2.5/5.0
- Condition / age +2.5/5.0
- Schools +1.7/10.0
- Appreciation +0.0/10.0
$149,900
🖨 Deal sheet 📄 Offer letter ✓ Due diligence
Listing remarks
Cute bungalow style Ranch. Hardwood floors and hardwood panel doors plus archway's make this home both functional and beautiful with architectural details. Backs to Tiemeyer Park with a level fenced back yard and a driveway that goes all the way into the back yard for plenty of off street parking. Basement is partially finished for extra living area. Beautiful back deck off updated Kitchen with LOT of tall, wood cabinets. A loved and well maintained home shows Owners pride. HV and AC is new as of 2023. Windows are about 10, double hung for easy cleaning and thermally insulated. Bathroom was updated by Bathfitters. Motivated seller and great opportunity.
Key facts
- Hardwood panel doors
- Bungalow style ranch
- Hardwood floors
Tags
Property features AI
Finance
- Financial info: Lease not considered; Seller may consider concessions
Exterior
- Parking: Driveway with space for 5 vehicles
- Utilities: Public water; Public sewer; Single phase electric; Cable available; Natural gas connected; Phone available; Electricity, sewer and water connected
- Home design: Single family residence; One level
- Construction: Vinyl siding; Shingle roof
- Exterior features: Front porch; Deck; Awnings; Back yard fencing; Shed(s); Adjoins government land; Level front and back yard
Interior
- Bedrooms: 2 bedrooms (both on the main level)
- Flooring: Hardwood
- Bathrooms: 1 full bath (main level)
- Heating & cooling: Forced air heating (natural gas); Central air conditioning (electric)
- Interior features: Hardwood flooring; Partially finished full basement
Neighborhood map
What this means for you Summary
Snapshot
- This is a 2-bed/1.0-bath single-family listed at $150k.
Deal economics
- At list price, monthly cash flow is $36 ($427/yr) — positive.
- The deal already cash-flows at list — no discount required.
- To meet the 1% rule (rent ≥ 1% of price), the offer needs to be $130k (13.3% below list).
- Recommended offer: $130k (13.3% below list) — sets the bar for 1% rule.
Location & tenants
- Location reads: area grade D — affects rentability + tenant quality, not the cash-flow math above.
- Ritenour (suburban): math 13% / reading 27% proficiency, ranked #304 of 324 in MO (top 94%) — low school quality limits family demand, transient renter base, plan for 1-2y turnover; 66% free/reduced lunch — lower-income household profile, screen leases tightly.
- Zoned schools: Buder Elem. (math 17% / reading 22%, grade F, #941 of 1,115 statewide, top 86%, 406 students, 99% FRL); Ritenour Sr. High (math 9% / reading 36%, grade F, #455 of 521 statewide, top 88%, 1,873 students, 100% FRL) — zoned schools average 100% FRL vs 66% district-wide (34 pts higher); higher-poverty schools than district average — tighter screening recommended.
- Market conditions: Rents rising fast (+4.1%/yr); 61 active listings in the ZIP; 30 comparable units currently listed for rent nearby; rentals at typical pace (median 24d on market — plan ~3-4 weeks tenant-placement turnaround); 43% of comp listings sitting > 30 days — soft ceiling on asking rent; 920 units permitted in St. Louis County in 2024 (250 in 5+ unit buildings).
- This rent runs 30% of the median local income ($52k/yr) — at the standard rent-burdened threshold; future hikes will face affordability resistance.
Forward outlook
- Local home prices are declining (-3.0%/yr); year-one equity from $1k of loan paydown is wiped out by about $4k of value loss. Plan a longer hold.
Negotiation context
- It's been on market 40 days — a 3% lower offer ($145k) is reasonable based on typical stale-listing flexibility.
- Current owner paid $54k; list at $150k implies a 180% gain — meaningful room to come down on a strong offer.
Risks & watch-outs
- Watch-outs: built in 1949 — expect roof / HVAC / electrical / plumbing capex.
Questions for the listing agent
- It's been on market 40 days. Have you received any prior offers? Is the seller open to a 13% concession, seller financing, or rate buy-down credit?
- Built in 1949 — when were the roof, HVAC, electrical panel, plumbing, and water heater last replaced?
- Is there a deadline driving the sale (1031 exchange, divorce, estate, relocation)? That informs how much negotiation room exists.
- The area grade is low — what's the realistic commute time and amenity access for the typical tenant pool here? Any planned neighborhood developments (good or bad) we should know about?
- What's the average days-on-market for RENTAL listings here right now (not sales)? A rising rental-DOM trend means longer vacancies and softer asking-rent achievability than the comps imply.
- What's the recent tenant-quality profile in this submarket — average credit score on applications, eviction rate, late-payment / NSF rate, and stable-employment percentage? A property-management company in the area should have these aggregated.
- How much new for-sale + rental construction is in the pipeline within 1–3 miles? Heavy new supply typically softens prices + rents 12–24 months out; constrained supply supports both.
Investment metrics
- 1% rule
- 0.87% ✗
- Cap rate
- 6.58%
- Cash-on-cash
- 1.02%
- DSCR
- 1.05
- GRM
- 9.6
CMA / ARV
- ARV (on-the-fly)
- $151,272
- Comps found
- 12
Show comp detail 12 sales within ~0.75 mi
| Address | Dist | Beds/Ba | Sqft | Sold | Price | $/sf | Match |
|---|---|---|---|---|---|---|---|
| 10512 Saint Francis Ln | 0.00mi | 2/1.0 | 792 (0%) | 1mo | $149,900 | $189 | 99 |
| 3438 Ashby Rd | 0.12mi | 2/1.0 | 816 (+3%) | 1mo | $159,900 | $196 | 88 |
| 10764 Saint Dismas Ct | 0.28mi | 2/1.5 | 792 (0%) | 6mo | $115,000 | $145 | 80 |
| 10262 Breckenridge Rd | 0.49mi | 2/1.0 | 792 (0%) | 2mo | $99,900 | $126 | 75 |
| 10212 Saint Arthur Ln | 0.53mi | 2/1.0 | 784 (-1%) | 3mo | $154,900 | $198 | 71 |
| 3548 Saint Genevieve Ln | 0.45mi | 2/1.0 | 774 (-2%) | 6mo | $120,000 | $155 | 70 |
| 10346 Saint Henry Ln | 0.39mi | 2/1.0 | 864 (+9%) | 1mo | $155,000 | $179 | 66 |
| 10500 Saint Michael Ln | 0.32mi | 2/2.0 | 888 (+12%) | 5mo | $125,900 | $142 | 57 |
| 10335 Saint Joan Ln | 0.50mi | 2/1.0 | 897 (+13%) | 2mo | $174,900 | $195 | 53 |
| 3507 Westridge Ln | 0.60mi | 3/1.0 (+1) | 864 (+9%) | 1mo | $165,000 | $191 | 51 |
| 10738 Saint Cosmas Ln | 0.47mi | 3/2.0 (+1) | 864 (+9%) | 5mo | $214,900 | $249 | 50 |
| 10019 Saint Martha Ln | 0.66mi | 3/1.0 (+1) | 864 (+9%) | 4mo | $188,000 | $218 | 46 |
Match score weights: distance 35% · size 25% · config 20% · recency 20%. Top-matched comps best support the ARV.
Projected returns pro-forma
-3.0% appreciation · 4.14% rent growth · sell at horizon
- IRR
- -13.5%
- Equity multiple
- 0.51×
- Total profit
- $-20,524
- Equity at exit
- $22,351
- IRR
- -2.9%
- Equity multiple
- 0.79×
- Total profit
- $-8,652
- Equity at exit
- $12,961
Cash invested: $41,972 (down + closing). Projections, not guarantees.
Landlord ↔ Tenant lean methodology
- Overall (STATE)
- 81 Strongly Landlord-Friendly
- State Missouri
- 81 Strongly Landlord-Friendly · R+10
- County
- — inherits STATE
- City
- — inherits STATE
ZIP-level market 63074
- Rents YoY
- 4.1%
- Active inventory
- 61
- Price-to-rent
- 9.6×
Monthly cashflow live
- Estimated rent
- $1,300 high interval (Pro) →
- Mortgage (P&I)
- −$786
- Tax from tax record
- −$143 /mo · $1,716/yr
- Insurance
- −$62
- HOA
- −$0
- Vacancy / Maint / Mgmt
- −$273
- Net cashflow
- $36
Break-even live
UW: 25.0% down · 7.5% · 30yr · 1.5% tax · 5.0% vac · 8.0% maint · 8.0% mgmt
Financing live
Cash to close
- Down payment
- $37,475
- Closing costs
- $4,497
- Reserves months
- —
- Total cash needed
- —
Loan-product check · same deal, 3 products live
Conventional
25% down · 7.5% · 30yr
- Down + closing
- —
- Monthly P&I
- —
- Monthly cashflow
- —
- DSCR
- —
- Eligible?
- —
Personal DTI + credit; lowest rate.
DSCR
20% down · 8.5% · 30yr
- Down + closing
- —
- Monthly P&I
- —
- Monthly cashflow
- —
- DSCR
- —
- Eligible?
- —
No personal income docs; deal must DSCR.
Hard money
10% down · 12.0% · 12mo
- Down + closing
- —
- Monthly P&I
- —
- Monthly cashflow
- —
- DSCR
- —
- Eligible?
- —
Short-term bridge; refi at stabilization.
Rent comps 30 comps
| Address | Beds | Baths | Sqft | Rent | $/sqft | DOM | Units | Dist |
|---|---|---|---|---|---|---|---|---|
| 10214 Saint Anthony Ln Saint Ann, MO | 2.0 | 1.0 | 734 | $1,200 | $1.63 | 44d | 1 | 0.39mi |
| 3529 Saint Joachim Ln Unit NA St Ann, MO | 2.0 | 1.0 | 900 | $1,450 | $1.61 | 20d | 1 | 0.40mi |
| 3529 Saint Joachim Ln Saint Ann, MO | 2.0 | 1.0 | 900 | $1,450 | $1.61 | 24d | 1 | 0.40mi |
| 10116 Saint Katherine Ln Saint Ann, MO | 3.0 | 1.0 | 984 | $1,865 | $1.90 | 17d | 1 | 0.50mi |
| 10205 Saint Daniel Ln Saint Ann, MO | 2.0 | 1.0 | 792 | $1,450 | $1.83 | 44d | 1 | 0.58mi |
| 3434 Sims Ave Saint Ann, MO | 3.0 | 1.5 | 988 | $1,545 | $1.56 | 44d | 1 | 0.75mi |
| 11042 Florence Ave Saint Ann, MO | 3.0 | 1.0 | 864 | $1,300 | $1.50 | 12d | 1 | 0.80mi |
| 10069 Livingston Ave St Ann, MO | 2.0 | 1.0 | 875 | $1,100 | $1.26 | 24d | 1 | 0.87mi |
| 11120 Graben Dr St Ann, MO | 1.0–2.0 | 1.0–1.5 | 850 | $1,250 | $1.47 | 2d | 14 | 0.90mi |
| 10742 Tropic Dr Unit VACANT St Ann, MO | 2.0 | 1.0 | 800 | $1,200 | $1.50 | 44d | 1 | 1.01mi |
| 3961 Jane Ave Unit 3963 St Ann, MO | 2.0 | 1.0 | 750 | $1,195 | $1.59 | 15d | 1 | 1.01mi |
| 10788 Tropic Dr Saint Ann, MO | 2.0 | 1.0 | 828 | $1,260 | $1.52 | 44d | 1 | 1.01mi |
| 3219 Royalton Ave Saint Louis, MO | 2.0 | 1.0 | 792 | $1,095 | $1.38 | 22d | 1 | 1.05mi |
| 3209 Royalton Ave Saint Louis, MO | 2.0 | 1.0 | 805 | $1,150 | $1.43 | 44d | 1 | 1.07mi |
| 9675 Muriel Ave Unit 9733 Overland, MO | 2.0 | 1.5 | 830 | $1,200 | $1.45 | 3d | 1 | 1.08mi |
| 9675 Muriel Ave Unit 9627 Overland, MO | 2.0 | 1.5 | 830 | $1,200 | $1.45 | 44d | 1 | 1.08mi |
| 9618 De Porres Ln Saint Louis, MO | 2.0 | 1.0 | 875 | $1,200 | $1.37 | 44d | 1 | 1.11mi |
| 9807 Guthrie Ave Saint Louis, MO | 3.0 | 2.0 | 1068 | $1,700 | $1.59 | 24d | 1 | 1.16mi |
| 11276 Liana Ln Saint Ann, MO | 2.0 | 1.0 | 780 | $1,189 | $1.52 | 4d | 1 | 1.19mi |
| 10145 Cabana Club Dr St Ann, MO | 1.0–2.0 | 1.0–2.0 | 776 | $1,060 | $1.37 | 44d | 8 | 1.20mi |
| 3648 Edmundson Rd Unit 1 St. Louis, MO | 2.0 | 1.0 | 900 | $995 | $1.11 | 44d | 1 | 1.31mi |
| 4120 Geraldine Ave St Ann, MO | 2.0 | 1.5 | 922 | $1,200 | $1.30 | 18d | 1 | 1.32mi |
| 4120 Geraldine Ave St Ann, MO | 1.0 | 1.0 | 540 | $875 | $1.62 | 22d | 1 | 1.32mi |
| 4120 Geraldine Ave St Ann, MO | 1.0 | 1.0 | 540 | $875 | $1.62 | 44d | 1 | 1.32mi |
| 11091 Saxonhall Dr Bridgeton, MO | 3.0 | 1.0 | 1034 | $1,706 | $1.65 | 18d | 1 | 1.37mi |
| 9535 Baltimore Ave Saint Louis, MO | 2.0 | 1.0 | 800 | $1,145 | $1.43 | 24d | 1 | 1.38mi |
| 3209 Dix Ave Saint Louis, MO | 3.0 | 1.0 | 1122 | $1,550 | $1.38 | 24d | 1 | 1.39mi |
| 3208 Dix Ave Saint Louis, MO | 2.0 | 1.0 | 656 | $1,235 | $1.88 | 11d | 1 | 1.41mi |
| 9448 Harold Dr Saint Louis, MO | 2.0 | 1.0 | 864 | $1,495 | $1.73 | 44d | 1 | 1.42mi |
| 2732 Annapolis Ave Saint Louis, MO | 2.0 | 1.0 | 768 | $1,250 | $1.63 | 44d | 1 | 1.47mi |
Listing history 7 events
-
2026-05-11status Pending
-
2026-04-12historical Active Under Contract
-
2026-04-01$149,900 Active
-
1998-03-25soldstatus
-
1998-03-25soldstatus $53,500
-
1997-01-23soldstatus
-
1997-01-23soldstatus
ⓘ Source: listings_history table (triggers on properties + properties_extension) + one-shot
backfill from property_details.listing_events for pre-trigger history.
Tax reassessment forecast MO · Resets to sale price
- Current annual tax
- $1,716 · $143/mo
- Projected year-2 tax
- $1,716 · $143/mo
- Expected delta
- $0/yr ($0/mo · 0.0%)
ⓘ Screening estimate from a state-policy table — verify with the county assessor before closing.
Climate risk First Street
- Flood 1/10 Low FEMA zone X (unshaded) · 0% chance over 30 yrs
- Wildfire 1/10 Low
- Heat 4/10 Moderate 7 d/yr ≥106°F today · 21 d/yr by 30 yrs out
- Wind 2/10 Low 100% chance of damaging wind over 30 yrs
- Air quality 2/10 Low 1 unhealthy d/yr today · 3 by 30 yrs out
Nearby sold comps map
Loading sold comps map…
Walkable amenities ~0.75 mi
Loading nearby amenities…
Taxation est. · year 1
- Rental income
- $15,601
- − Mortgage interest
- −$8,397
- − Property taxes
- −$1,716
- − Insurance
- −$750
- − Repairs & maintenance
- −$1,248
- − Management
- −$1,248
- − Depreciation
- −$4,361
- Taxable loss
- −$2,117
- Est. tax savings @ 24.0%
- +$508
- After-tax cash flow
- $935/yr
For passive investors: Depreciation is non-cash, so a rental often shows a tax loss while cash-flowing — sheltering income. Rental losses are passive: they offset passive income freely, and up to $25,000/yr can offset ordinary (W-2) income if you actively participate and your MAGI is under $100k (phasing out to $0 by $150k); unused losses carry forward. On sale, claimed depreciation is recaptured at up to 25%, and gains may owe capital-gains tax (a 1031 exchange can defer both). Figures are a year-1 estimate at your 24.0% rate — not tax advice; consult a CPA.
Schools (NCES district)
- District
- Ritenour
- NCES district ID
- 2926640
- Math proficiency
- 13% ▼ -14.00%
- Reading proficiency
- 27% ▼ -7.00%
- Median HH income
- $41,410
- Composite
- 17.04/100
- National rank
- #9125
- State rank
- #304 of 324 in MO
Livability — St. Ann
No livability data for this city. (Only ~50 U.S. cities are tracked.)
Census & demographics
- Census place
- St. Ann, MO
- County
- Saint Louis County · 888,823 people
- City population
- 16,237
- Metro
- St. Louis, MO-IL
- Population (ZIP)
- 15,793
- Household income
- $51,610
- Rent vs Own
- Severe rent burden
- 782.0
Population outlook (St. Louis County) Hauer SSP2
- Today (2025)
- 1,025,227 people
- By 2030
- 1,028,023 · +0.3%
- By 2040
- 1,020,940 · -0.4%
- By 2050
- 1,007,280 · -1.8%
- By 2075
- 987,277 · -3.7%
- By 2100
- 921,984 · -10.1%
Race, ethnicity, and origin ACS 2023
- Neighborhood character
- Diverse neighborhood (Simpson 0.65)
- Race & ethnicity
- White 50% Black 27% Hispanic / Latino 19% Two or more races 5% Asian 2%
- Hispanic origin (detail)
- Mexican 16%
- Common ancestry
- Lithuanian 2% Italian 1% Romanian 1%
- Foreign-born
- 13% · Canada, China
- Languages at home
- 80% English-only · Spanish 17% Chinese 1% German/W. Germanic 1%
Political lean MEDSL · St. Louis
- 2024 margin
- Strong D (+23.4) · D 60.8% · R 37.4% · Other 1.7%
- 2008→2024 swing
- +3.5pp toward D · 2008: 19.9pp · 2024: 23.4pp
- All cycles
- 2024: D+23.4 2020: D+24.0 2016: D+16.2 2012: D+13.7 2008: D+19.9
Not yet ingested
- Civics
- —
Market trends
- HPI YoY
- ▼ -242.89%
- Current HPI
- 210.6588
- Rent YoY
- ▲ 4.14%
- Metro
- St. Louis, MO-IL
- State GDP YoY
- ▲ 1.84%
- F500 in state
- 20
Industry mix (Fortune 500 HQ in MO)
| Industry | F500 HQs | Revenue |
|---|---|---|
| Healthcare | 1 | $163B |
|
||
| Insurance | 1 | $21B |
|
||
| Industrial Technology | 1 | $17B |
|
||
| Retail | 1 | $16B |
|
||
| Industrial Distribution | 1 | $10B |
|
||
| Utilities | 1 | $9B |
|
||
Price history
+180.2% since first listed7 events — show timeline
- 2026-05-11 Pending — MARIS as Distributed by MLS Grid
- 2026-04-12 Contingent — MARIS as Distributed by MLS Grid
- 2026-04-01 Listed $149,900 MARIS as Distributed by MLS Grid
- 1998-03-25 Sold (Public Records) $53,500 Public Records
- 1998-03-25 Sold (Public Records) — Public Records
- 1997-01-23 Sold (Public Records) — Public Records
- 1997-01-23 Sold (Public Records) — Public Records
Property tax history
+3.4%/yrLatest (2022): $1,716 · +0.1% YoY. Source: county tax records.
Cash-flow waterfall
monthlySold comps — $/sqft
last 12 mo · ≤1 miLoading sold comps…