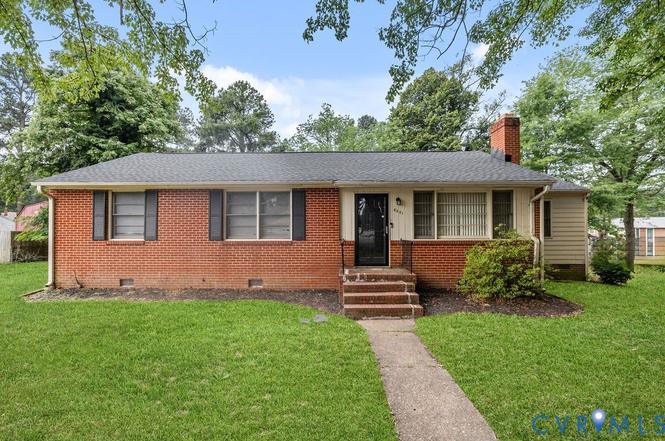
6201 Binns Ave · Richmond, VA
Flood risk 1/10 · Minimal
- FEMA flood zone
- X (unshaded)
- Chance of flooding over 30 yrs
- 0.0%
- Est. flood insurance / yr
- $507 – $1,088
Fire risk 1/10 · Minimal
- Est. fire insurance / yr
- $666 – $1,236
Heat risk 7/10 · Major
- Hot days now (above 105°F)
- 7 days/yr
- Hot days in 30 yrs
- 16 days/yr
Wind risk 6/10 · Moderate
- Chance of severe wind over 30 yrs
- 27.0%
Air-quality risk 2/10 · Minimal
- Unhealthy air days now
- 1 days/yr
- Unhealthy air days in 30 yrs
- 1 days/yr
Risk factors via First Street. Map © Google.
Why this score? — see what drove the D+ grade
The composite is a weighted blend of 9 inputs, each scored 0–100. Each bar is that input's sub-score; the figure is the points it added to the 100-point composite (weight × sub-score).
- ARV discount +15.0/15.0
- Cash flow +13.7/30.0
- Livability +4.2/5.0
- DSCR +4.1/10.0
- 1% rule +3.3/10.0
- Schools +3.3/10.0
- Rent growth +2.7/5.0
- Condition / age +2.5/5.0
- Appreciation +0.0/10.0
$239,999
🖨 Deal sheet (PDF) 📄 Offer letter ✓ Due diligence
Listing remarks MLS
This well maintained 3 bed 1 1/2 bath ranch style home in Richmond is move in ready. 1 level living with a cozy family room with hardwood flooring, great natural lighting and a wood burning fireplace. This home has been freshly painted throughout, New HVAC, New kitchen counter tops and New stove top. Outside is complete with off street parking and a spacious back yard.
Key facts
- Natural light
- Huge backyard
- Barn-style door
Tags
Property features AI
Exterior
- Parking: Driveway parking; No garage; Unpaved parking
- Utilities: Public water; Public sewer; Electric power
- Home design: Single-story home; Brick construction; Shingle roof; Mixed year built
- Construction: Brick exterior; Shingle roof; Crawl space foundation
- Exterior features: Front porch; Porch; Deck; Fenced backyard; Unpaved driveway
Interior
- Kitchen: Eat-in kitchen
- Bedrooms: Total of 6 rooms (includes bedrooms and living spaces)
- Flooring: Partially carpeted; Wood floors
- Bathrooms: One full bathroom with tub; One half bathroom
- Heating & cooling: Electric heating; Central air conditioning
- Interior features: Dining area; Eat-in kitchen; Primary bedroom with private bath; Masonry fireplace
- Laundry & utility: Washer hookup; Dryer hookup; Electric water heater
Neighborhood map
What this means for you Summary
Snapshot
- This is a 3-bed/1.5-bath single-family listed at $240k.
Deal economics
- At list price, monthly cash flow is $18 ($217/yr) — positive.
- The deal already cash-flows at list — no discount required.
- To meet the 1% rule (rent ≥ 1% of price), the offer needs to be $199k (17.3% below list).
- Recommended offer: $199k (17.3% below list) — sets the bar for 1% rule.
- Cap rate 6.4% vs local median 3.3% in Richmond — top-decile yield for the area; either an underpriced asset or a hidden risk that comps aren't pricing in. Stress-test before assuming the spread holds.
Location & tenants
- Location reads 84/100 on livability (#33 in VA, #793 nationally) — a professional / high-income tenant draw. Strengths: amenities A+, commute A+, health & safety A+; Watch: crime D-.
- Richmond City Public School District (urban): math 32% / reading 47% proficiency, ranked #123 of 131 in VA (top 94%) — families likely to look elsewhere, expect single-tenant / working-renter base with shorter leases; 74% free/reduced lunch — lower-income household profile, screen leases tightly.
- Market conditions: Rents flat; 167 active listings in the ZIP; 21 comparable units currently listed for rent nearby; rentals leasing fast (median 5d on market — plan ~1-2 weeks tenant-placement turnaround); 2,540 units permitted in Richmond city in 2024 (2,077 in 5+ unit buildings).
- This rent runs 38% of the median local income ($63k/yr) — at the standard rent-burdened threshold; future hikes will face affordability resistance.
Forward outlook
- Local home prices are declining (-3.0%/yr); year-one equity from $2k of loan paydown is wiped out by about $7k of value loss. Plan a longer hold.
- Richmond County population projected at +40% by 2050 — long-run rental-demand tailwind backs the buy-and-hold thesis.
Negotiation context
- Only 2 days on market — expect competitive offers; lowballing is unlikely to land.
- 4 sale attempts since 21y ago with the ask held roughly flat each time — persistent listings suggest the price (not the market) is what's stuck; bring a comps-based counter.
- Current owner paid $173k; 39% above their basis — modest negotiation headroom, anchor on the comps not their cost.
Risks & watch-outs
- Watch-outs: built in 1959 — expect roof / HVAC / electrical / plumbing capex.
- Climate carrying-cost: major wind risk, 27% chance of damaging wind over 30y; extreme-heat days projected 7→16/yr by 2055 (HVAC capex compounding) — expect insurance premiums to compound above CPI over the hold.
Questions for the listing agent
- Built in 1959 — when were the roof, HVAC, electrical panel, plumbing, and water heater last replaced?
- Is there a deadline driving the sale (1031 exchange, divorce, estate, relocation)? That informs how much negotiation room exists.
- Schools are A-rated — typically a magnet for longer-tenancy family renters. What's the average tenant stay here, and is there a school-zone premium baked into asking?
- Crime grade is D in this area — have there been break-ins, vandalism, or insurance claims at this property in the last 3 years? What carrier currently insures it and at what premium?
- The area grade is low — what's the realistic commute time and amenity access for the typical tenant pool here? Any planned neighborhood developments (good or bad) we should know about?
- What's the average days-on-market for RENTAL listings here right now (not sales)? A rising rental-DOM trend means longer vacancies and softer asking-rent achievability than the comps imply.
- What's the recent tenant-quality profile in this submarket — average credit score on applications, eviction rate, late-payment / NSF rate, and stable-employment percentage? A property-management company in the area should have these aggregated.
- How much new for-sale + rental construction is in the pipeline within 1–3 miles? Heavy new supply typically softens prices + rents 12–24 months out; constrained supply supports both.
Investment metrics
- 1% rule
- 0.83% ✗
- Cap rate
- 6.38%
- Cash-on-cash
- 0.32%
- DSCR
- 1.01
- GRM
- 10.1
CMA / ARV
- ARV (on-the-fly)
- $325,268
- Comps found
- 12
Show comp detail 12 sales within ~0.75 mi
| Address | Dist | Beds/Ba | Sqft | Sold | Price | $/sf | Match |
|---|---|---|---|---|---|---|---|
| 6207 Winter Rd | 0.10mi | 3/2.0 | 1,476 (+6%) | 1mo | $350,000 | $237 | 83 |
| 6300 Worthington Rd | 0.23mi | 3/1.5 | 1,320 (-5%) | 6mo | $310,000 | $235 | 76 |
| 932 Whitehead Rd | 0.27mi | 3/1.5 | 1,320 (-5%) | 3mo | $285,000 | $216 | 76 |
| 5847 Warwick Rd | 0.27mi | 3/2.0 | 1,397 (+0%) | 15mo | $326,000 | $233 | 73 |
| 625 Tilton Ct | 0.25mi | 3/1.5 | 1,526 (+9%) | 8mo | $260,000 | $170 | 66 |
| 925 Derrymore Rd | 0.26mi | 3/1.5 | 1,526 (+9%) | 14mo | $300,000 | $197 | 61 |
| 6436 Clisby Rd | 0.54mi | 3/1.5 | 1,320 (-5%) | 6mo | $245,000 | $186 | 60 |
| 6109 Worthington Rd | 0.37mi | 2/1.0 (-1) | 1,307 (-6%) | 6mo | $310,000 | $237 | 60 |
| 6507 Clisby Rd | 0.59mi | 3/1.5 | 1,320 (-5%) | 13mo | $225,000 | $170 | 53 |
| 1113 Worthington Ct | 0.54mi | 3/2.0 | 1,561 (+12%) | 6mo | $315,000 | $202 | 48 |
| 6525 Erhart Rd | 0.55mi | 3/1.5 | 1,220 (-13%) | 10mo | $305,000 | $250 | 46 |
| 1049 Kingsway Rd | 0.60mi | 3/1.0 | 1,249 (-10%) | 15mo | $300,000 | $240 | 40 |
Match score weights: distance 35% · size 25% · config 20% · recency 20%. Top-matched comps best support the ARV.
Projected returns pro-forma
-3.0% appreciation · 0.63% rent growth · sell at horizon
- IRR
- -18.3%
- Equity multiple
- 0.37×
- Total profit
- $-42,399
- Equity at exit
- $35,785
- IRR
- -15.8%
- Equity multiple
- 0.20×
- Total profit
- $-53,684
- Equity at exit
- $20,751
Cash invested: $67,200 (down + closing). Projections, not guarantees.
Landlord ↔ Tenant lean methodology
- Overall (STATE)
- 55 Moderately Landlord-Leaning
- State Virginia
- 55 Moderately Landlord-Leaning · D+2
- County
- — inherits STATE
- City
- — inherits STATE
ZIP-level market 23225
- Rents YoY
- 0.6%
- Active inventory
- 167
- Price-to-rent
- 10.1×
Monthly cashflow live
- Estimated rent
- $1,986 high interval (Pro) →
- Mortgage (P&I)
- −$1,259
- Tax from tax record
- −$192 /mo · $2,304/yr
- Insurance
- −$100
- HOA
- −$0
- Vacancy / Maint / Mgmt
- −$417
- Net cashflow
- $18
Break-even live
Sensitivity live
| Price | -10% $154 | -5% $86 | +0% $18 | +5% $-50 | +10% $-118 |
|---|---|---|---|---|---|
| Rent | -10% $-139 | -5% $-60 | +0% $18 | +5% $97 | +10% $175 |
| Rate | -1.0pp $139 | -0.5pp $79 | base $18 | +0.5pp $-44 | +1.0pp $-107 |
UW: 25.0% down · 7.5% · 30yr · 1.5% tax · 5.0% vac · 8.0% maint · 8.0% mgmt
Financing live
Cash to close
- Down payment
- $60,000
- Closing costs
- $7,200
- Reserves months
- —
- Total cash needed
- —
Loan-product check · same deal, 3 products live
Conventional
25% down · 7.5% · 30yr
- Down + closing
- —
- Monthly P&I
- —
- Monthly cashflow
- —
- DSCR
- —
- Eligible?
- —
Personal DTI + credit; lowest rate.
DSCR
20% down · 8.5% · 30yr
- Down + closing
- —
- Monthly P&I
- —
- Monthly cashflow
- —
- DSCR
- —
- Eligible?
- —
No personal income docs; deal must DSCR.
Hard money
10% down · 12.0% · 12mo
- Down + closing
- —
- Monthly P&I
- —
- Monthly cashflow
- —
- DSCR
- —
- Eligible?
- —
Short-term bridge; refi at stabilization.
Rent comps 21 comps
| Address | Beds | Baths | Sqft | Rent | $/sqft | DOM | Units | Dist |
|---|---|---|---|---|---|---|---|---|
| 1018 Barlen Dr Richmond, VA | 3.0 | 1.0 | 935 | $1,700 | $1.82 | 44d | 1 | 0.53mi |
| 6925 Starview Ct Richmond, VA | 1.0–2.0 | 1.5 | 953 | $1,642 | $1.72 | 2d | 4 | 0.78mi |
| 6540 Greenbank Rd Richmond, VA | 1.0–3.0 | 1.0–1.5 | 887 | $1,790 | $2.02 | 2d | 59 | 0.84mi |
| 311 Karl Linn Dr North Chesterfield, VA | 1.0–3.0 | 1.0–3.0 | 1271 | $3,416 | $2.69 | 2d | 21 | 0.86mi |
| 6839 Carnation St Richmond, VA | 1.0–3.0 | 1.0–2.0 | 938 | $1,915 | $2.04 | 2d | 21 | 0.90mi |
| 1244 Canterbury Ridge Rd Unit 1 Richmond, VA | 3.0 | 2.5 | 1250 | $2,000 | $1.60 | 5d | 1 | 0.90mi |
| 161 Hioaks Rd Richmond, VA | 1.0–3.0 | 1.0–2.0 | 983 | $1,601 | $1.63 | 5d | 7 | 0.95mi |
| 435 German School Rd Richmond, VA | 1.0–3.0 | 1.0–2.0 | 956 | $1,744 | $1.82 | 2d | 18 | 1.00mi |
| 1501 Ivymount Rd Richmond, VA | 3.0 | 1.5 | 1084 | $1,750 | $1.61 | 44d | 1 | 1.00mi |
| 101 Springline Dr North Chesterfield, VA | 1.0–3.0 | 1.0–2.0 | 981 | $2,825 | $2.88 | 2d | 49 | 1.10mi |
| 901 Saint John's Wood Dr Richmond, VA | 1.0–3.0 | 1.0–2.0 | 1023 | $1,855 | $1.81 | 2d | 196 | 1.20mi |
| 5601 Larrymore Rd Richmond, VA | 4.0 | 2.0 | 1581 | $1,960 | $1.24 | 44d | 1 | 1.22mi |
| 2336 Sara Ln Richmond, VA | 3.0 | 1.0 | 1120 | $1,695 | $1.51 | 44d | 1 | 1.28mi |
| 6901 Marlowe Rd Richmond, VA | 1.0–2.0 | 1.0–2.0 | 722 | $1,953 | $2.70 | 44d | 24 | 1.33mi |
| 6901 Marlowe Rd Richmond, VA | 1.0–2.0 | 1.0–2.0 | 722 | $1,910 | $2.64 | 2d | 51 | 1.33mi |
| 725 Boulder Springs Dr North Chesterfield, VA | 1.0–3.0 | 1.0–2.0 | 1155 | $2,050 | $1.77 | 2d | 26 | 1.34mi |
| 723 Faye St Richmond, VA | 2.0 | 1.0 | 1100 | $1,850 | $1.68 | 44d | 1 | 1.38mi |
| 811 Irby Dr Richmond, VA | 3.0 | 1.5 | 1202 | $1,895 | $1.58 | 16d | 1 | 1.38mi |
| 1840 Powell Rd Richmond, VA | 2.0 | 1.0 | 1228 | $1,695 | $1.38 | 16d | 1 | 1.38mi |
| 211 Lingstorm Ln Richmond, VA | 1.0–3.0 | 1.0–2.0 | 818 | $1,960 | $2.40 | 2d | 123 | 1.41mi |
| 1188 Grand Brook Dr Unit 1188 Richmond, VA | 3.0 | 2.5 | 1414 | $2,600 | $1.84 | 15d | 1 | 1.48mi |
Listing history 2 events
-
2026-06-13remarks 699-char remark
-
2026-06-13$239,999 Pending 2 DOM
ⓘ Source: listings_history table (triggers on properties + properties_extension) + one-shot
backfill from property_details.listing_events for pre-trigger history.
Tax reassessment forecast VA · Resets to sale price
- Current annual tax
- $2,304 · $192/mo
- Projected year-2 tax
- $2,304 · $192/mo
- Expected delta
- $0/yr ($0/mo · 0.0%)
ⓘ Screening estimate from a state-policy table — verify with the county assessor before closing.
Climate risk First Street
- Flood 1/10 Low FEMA zone X (unshaded) · 0% chance over 30 yrs
- Wildfire 1/10 Low
- Heat 7/10 Severe 7 d/yr ≥105°F today · 16 d/yr by 30 yrs out
- Wind 6/10 Major 27% chance of damaging wind over 30 yrs
- Air quality 2/10 Low 1 unhealthy d/yr today · 1 by 30 yrs out
Nearby sold comps map
Loading sold comps map…
Walkable amenities ~0.75 mi
Loading nearby amenities…
Taxation est. · year 1
- Rental income
- $23,828
- − Mortgage interest
- −$13,444
- − Property taxes
- −$2,304
- − Insurance
- −$1,200
- − Repairs & maintenance
- −$1,906
- − Management
- −$1,906
- − Depreciation
- −$6,982
- Taxable loss
- −$3,914
- Est. tax savings @ 24.0%
- +$939
- After-tax cash flow
- $1,157/yr
For passive investors: Depreciation is non-cash, so a rental often shows a tax loss while cash-flowing — sheltering income. Rental losses are passive: they offset passive income freely, and up to $25,000/yr can offset ordinary (W-2) income if you actively participate and your MAGI is under $100k (phasing out to $0 by $150k); unused losses carry forward. On sale, claimed depreciation is recaptured at up to 25%, and gains may owe capital-gains tax (a 1031 exchange can defer both). Figures are a year-1 estimate at your 24.0% rate — not tax advice; consult a CPA.
Schools (NCES district)
- District
- Richmond City Public School District
- NCES district ID
- 5103240
- Math proficiency
- 32% ▼ -24.00%
- Reading proficiency
- 47% ▼ -9.00%
- Median HH income
- $40,276
- Composite
- 33.09/100
- National rank
- #5564
- State rank
- #123 of 131 in VA
Livability — Richmond
- Score
- 84/100
- State rank
- #33
- US rank
- #793
Category grades
Schools grade is shown separately in the Schools card above.
Census & demographics
- Census place
- Richmond, VA
- County
- Richmond City · 178,280 people
- City population
- 287,109
- Metro
- Richmond, VA
- Population (ZIP)
- 42,771
- Household income
- $62,949
- Rent vs Own
- Severe rent burden
- 2516.0
Population outlook (Richmond County) Hauer SSP2
- Today (2025)
- 262,263 people
- By 2030
- 284,503 · +8.5%
- By 2040
- 327,353 · +24.8%
- By 2050
- 367,946 · +40.3%
- By 2075
- 449,560 · +71.4%
- By 2100
- 500,301 · +90.8%
Race, ethnicity, and origin ACS 2023
- Neighborhood character
- Diverse neighborhood (Simpson 0.66)
- Race & ethnicity
- Black 42% White 38% Hispanic / Latino 14% Two or more races 7% Asian 1%
- Hispanic origin (detail)
- Mexican 2% Puerto Rican 1% Dominican 1%
- Common ancestry
- Slovak 2% Lithuanian 2% Serbian 1%
- Foreign-born
- 9% · Canada
- Languages at home
- 86% English-only · Spanish 11% Other Indo-European 1% Other Asian/Pacific 1%
Political lean MEDSL · Richmond
- 2024 margin
- Solid D (+66.3) · D 82.0% · R 15.8% · Other 2.2%
- 2008→2024 swing
- +7.2pp toward D · 2008: 59.1pp · 2024: 66.3pp
- All cycles
- 2024: D+66.3 2020: D+68.0 2016: D+63.8 2012: D+55.7 2008: D+59.1
Not yet ingested
- Civics
- —
Market trends
- HPI YoY
- ▼ -392.89%
- Current HPI
- 339.408
- Rent YoY
- ▲ 0.63%
- Metro
- Richmond, VA
- State GDP YoY
- ▲ 2.40%
- F500 in state
- 50
Industry mix (Fortune 500 HQ in VA)
| Industry | F500 HQs | Revenue |
|---|---|---|
| Aerospace / Defense | 4 | $236B |
|
||
| Technology / Defense | 3 | $32B |
|
||
| Financial Services | 2 | $176B |
|
||
| Utilities | 2 | $27B |
|
||
| Insurance | 2 | $25B |
|
||
| Technology | 2 | $15B |
|
||
Price history
+1419.0% since first listed12 events — show timeline
- 2026-06-13 Pending — CVRMLS
- 2026-06-12 Listed $239,999 CVRMLS
- 2019-07-02 Sold (Public Records) $173,000 Public Records
- 2019-06-28 Sold (MLS) $173,000 CVRMLS
- 2019-05-14 Pending — CVRMLS
- 2019-05-10 Listed $172,000 CVRMLS
- 2005-10-17 Sold (Public Records) $120,000 Public Records
- 2005-10-14 Sold (MLS) $120,000 CVRMLS
- 2005-10-14 Sold (MLS) $120,000 CVRMLS
- 2005-08-27 Listed $130,000 CVRMLS
- 2005-08-27 Listed $130,000 CVRMLS
- 1962-10-17 Sold (Public Records) $15,800 Public Records
Property tax history
+4.8%/yrLatest (2022): $2,304 · +50.0% YoY. Source: county tax records.
Cash-flow waterfall
monthlySold comps — $/sqft
last 12 mo · ≤1 miLoading sold comps…