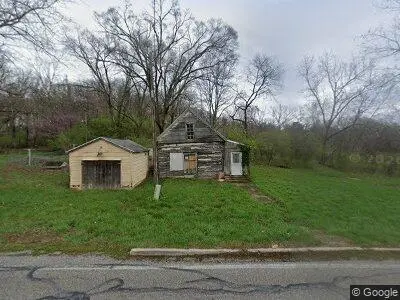
6434 Prophets Rock Rd · Battle Ground, IN
Flood risk 4/10 · Minor
- FEMA flood zone
- X (unshaded)
- Chance of flooding over 30 yrs
- 0.22%
- Est. flood insurance / yr
- $507 – $1,088
Fire risk 1/10 · Minimal
- Est. fire insurance / yr
- $717 – $1,331
Heat risk 3/10 · Minor
- Hot days now (above 102°F)
- 7 days/yr
- Hot days in 30 yrs
- 17 days/yr
Wind risk 2/10 · Minimal
- Chance of severe wind over 30 yrs
- —
Air-quality risk 3/10 · Minor
- Unhealthy air days now
- 1 days/yr
- Unhealthy air days in 30 yrs
- 3 days/yr
Risk factors via First Street. Map © Google.
Why this score? — see what drove the B grade
The composite is a weighted blend of 9 inputs, each scored 0–100. Each bar is that input's sub-score; the figure is the points it added to the 100-point composite (weight × sub-score).
- Cash flow +30.0/30.0
- 1% rule +10.0/10.0
- DSCR +10.0/10.0
- ARV discount +7.5/15.0
- Schools +4.0/10.0
- Livability +3.8/5.0
- Rent growth +3.3/5.0
- Condition / age +2.5/5.0
- Appreciation +0.0/10.0
$80,000
🖨 Deal sheet (PDF) 📄 Offer letter ✓ Due diligence
Listing remarks
Historic home long cabin foresell buy owner on land contract for land value, five year land contract or cash sale. no realtors, this is for sale by owner. The property has Burnett& apos; s tree running through it. Which is part of the property.
Key facts
- Built 1968
- Listed 14 days
Neighborhood map
What this means for you Summary
Snapshot
- This is a 3-bed/1.0-bath single-family listed at $80k.
Deal economics
- At list price, monthly cash flow is $830 ($10k/yr) — positive.
- The deal already cash-flows at list — no discount required.
- Meets the 1% rule at list price ($2k rent vs $80k).
- Recommended offer: $79k (1.5% below list) — sets the bar for market timing.
Location & tenants
- Location reads 75/100 on livability (#66 in IN, #4,321 nationally) — a middle-class / working-renter tenant base. Strengths: crime A+, employment A+, cost of living A+; Watch: amenities F, commute F, health & safety F.
- Tippecanoe School Corporation (rural): math 44% / reading 49% proficiency, ranked #80 of 301 in IN (top 27%) — families likely to look elsewhere, expect single-tenant / working-renter base with shorter leases.
- Market conditions: Rents rising (+3.2%/yr); 333 active listings in the ZIP; 1,341 units permitted in Tippecanoe County in 2024 (869 in 5+ unit buildings).
- This rent runs 39% of the median local income ($53k/yr) — at the standard rent-burdened threshold; future hikes will face affordability resistance.
Forward outlook
- Local home prices are declining (-3.0%/yr); year-one equity from $553 of loan paydown is wiped out by about $2k of value loss. Plan a longer hold.
- Tippecanoe County population projected at +41% by 2050 — long-run rental-demand tailwind backs the buy-and-hold thesis.
- At projected returns (-3.0% appreciation + 3.2% rent growth), your $22k cash investment doubles in ~3 years — after that, you're playing with house money.
Negotiation context
- It's been on market 15 days — a 2% lower offer ($79k) is reasonable based on typical stale-listing flexibility.
Questions for the listing agent
- Built in 1968 — when were the roof, HVAC, electrical panel, plumbing, and water heater last replaced?
- Is there a deadline driving the sale (1031 exchange, divorce, estate, relocation)? That informs how much negotiation room exists.
- Schools are B-rated — typically a magnet for longer-tenancy family renters. What's the average tenant stay here, and is there a school-zone premium baked into asking?
- What's the average days-on-market for RENTAL listings here right now (not sales)? A rising rental-DOM trend means longer vacancies and softer asking-rent achievability than the comps imply.
- What's the recent tenant-quality profile in this submarket — average credit score on applications, eviction rate, late-payment / NSF rate, and stable-employment percentage? A property-management company in the area should have these aggregated.
- How much new for-sale + rental construction is in the pipeline within 1–3 miles? Heavy new supply typically softens prices + rents 12–24 months out; constrained supply supports both.
Investment metrics
- 1% rule
- 2.15% ✓
- Cap rate
- 18.74%
- Cash-on-cash
- 44.45%
- DSCR
- 2.98
- GRM
- 3.9
CMA / ARV
- ARV (on-the-fly)
- $235,536
- Comps found
- 9
Show comp detail 9 sales within ~0.75 mi
| Address | Dist | Beds/Ba | Sqft | Sold | Price | $/sf | Match |
|---|---|---|---|---|---|---|---|
| 504 Jewett St | 0.08mi | 3/2.0 | 1,500 (+7%) | 14mo | $15,000 | $10 | 70 |
| 6109 Battleview Dr | 0.66mi | 3/1.5 | 1,400 (-0%) | 2mo | $230,000 | $164 | 66 |
| 6429 Prophets Rock Rd | 0.03mi | 3/1.0 | 1,612 (+15%) | 15mo | $214,000 | $133 | 61 |
| 2501 Musket Way | 0.58mi | 4/2.0 (+1) | 1,371 (-2%) | 1mo | $300,000 | $219 | 59 |
| 6260 Musket Way | 0.68mi | 4/2.0 (+1) | 1,485 (+6%) | 0mo | $342,500 | $231 | 49 |
| 6268 Musket Way | 0.69mi | 3/2.0 | 1,365 (-3%) | 13mo | $299,900 | $220 | 49 |
| 3045 State Road 225 E | 0.64mi | 2/1.0 (-1) | 1,348 (-4%) | 12mo | $540,000 | $401 | 49 |
| 201 High School Ave | 0.74mi | 3/1.0 | 1,296 (-8%) | 15mo | $218,000 | $168 | 40 |
| 6731 Harrison Rd | 0.71mi | 3/2.0 | 1,496 (+7%) | 15mo | $244,900 | $164 | 39 |
Match score weights: distance 35% · size 25% · config 20% · recency 20%. Top-matched comps best support the ARV.
Projected returns pro-forma
-3.0% appreciation · 3.2% rent growth · sell at horizon
- IRR
- 41.7%
- Equity multiple
- 2.80×
- Total profit
- $40,246
- Equity at exit
- $11,928
- IRR
- 48.0%
- Equity multiple
- 5.67×
- Total profit
- $104,580
- Equity at exit
- $6,917
Cash invested: $22,400 (down + closing). Projections, not guarantees.
Landlord ↔ Tenant lean methodology
- Overall (STATE)
- 90 Strongly Landlord-Friendly
- State Indiana
- 90 Strongly Landlord-Friendly · R+11
- County
- — inherits STATE
- City
- — inherits STATE
ZIP-level market 47906
- Rents YoY
- 3.2%
- Active inventory
- 333
- Price-to-rent
- 3.9×
Monthly cashflow live
- Estimated rent
- $1,723 medium interval (Pro) →
- Mortgage (P&I)
- −$420
- Tax from tax record
- −$78 /mo · $941/yr
- Insurance
- −$33
- HOA
- −$0
- Vacancy / Maint / Mgmt
- −$362
- Net cashflow
- $830
Break-even live
Sensitivity live
| Price | -10% $875 | -5% $852 | +0% $830 | +5% $807 | +10% $784 |
|---|---|---|---|---|---|
| Rent | -10% $694 | -5% $762 | +0% $830 | +5% $898 | +10% $966 |
| Rate | -1.0pp $870 | -0.5pp $850 | base $830 | +0.5pp $809 | +1.0pp $788 |
UW: 25.0% down · 7.5% · 30yr · 1.5% tax · 5.0% vac · 8.0% maint · 8.0% mgmt
Financing live
Cash to close
- Down payment
- $20,000
- Closing costs
- $2,400
- Reserves months
- —
- Total cash needed
- —
Loan-product check · same deal, 3 products live
Conventional
25% down · 7.5% · 30yr
- Down + closing
- —
- Monthly P&I
- —
- Monthly cashflow
- —
- DSCR
- —
- Eligible?
- —
Personal DTI + credit; lowest rate.
DSCR
20% down · 8.5% · 30yr
- Down + closing
- —
- Monthly P&I
- —
- Monthly cashflow
- —
- DSCR
- —
- Eligible?
- —
No personal income docs; deal must DSCR.
Hard money
10% down · 12.0% · 12mo
- Down + closing
- —
- Monthly P&I
- —
- Monthly cashflow
- —
- DSCR
- —
- Eligible?
- —
Short-term bridge; refi at stabilization.
Listing history 13 events
-
2026-06-19days on market $80,000 Active 15 DOM
-
2026-06-18days on market $80,000 Active 14 DOM
-
2026-06-17days on market $80,000 Active 13 DOM
-
2026-06-16days on market $80,000 Active 12 DOM
-
2026-06-15days on market $80,000 Active 11 DOM
-
2026-06-14days on market $80,000 Active 9 DOM
-
2026-06-13days on market $80,000 Active 8 DOM
-
2026-06-10days on market $80,000 Active 6 DOM
-
2026-06-09days on market $80,000 Active 5 DOM
-
2026-06-08days on market $80,000 Active 4 DOM
-
2026-06-07days on market $80,000 Active 3 DOM
-
2026-06-05remarks 244-char remark
-
2026-06-05$80,000 Active 1 DOM
ⓘ Source: listings_history table (triggers on properties + properties_extension) + one-shot
backfill from property_details.listing_events for pre-trigger history.
Tax reassessment forecast IN · Partial reset (capped growth)
- Current annual tax
- $941 · $78/mo
- Projected year-2 tax
- $941 · $78/mo
- Expected delta
- $0/yr ($0/mo · -0.0%)
ⓘ Screening estimate from a state-policy table — verify with the county assessor before closing.
Climate risk First Street
- Flood 4/10 Moderate FEMA zone X (unshaded) · 22% chance over 30 yrs
- Wildfire 1/10 Low
- Heat 3/10 Moderate 7 d/yr ≥102°F today · 17 d/yr by 30 yrs out
- Wind 2/10 Low
- Air quality 3/10 Moderate 1 unhealthy d/yr today · 3 by 30 yrs out
Nearby sold comps map
Loading sold comps map…
Walkable amenities ~0.75 mi
Loading nearby amenities…
Taxation est. · year 1
- Rental income
- $20,674
- − Mortgage interest
- −$4,481
- − Property taxes
- −$941
- − Insurance
- −$400
- − Repairs & maintenance
- −$1,654
- − Management
- −$1,654
- − Depreciation
- −$2,327
- Taxable income
- $9,217
- Est. tax owed @ 24.0%
- −$2,212
- After-tax cash flow
- $7,745/yr
For passive investors: Depreciation is non-cash, so a rental often shows a tax loss while cash-flowing — sheltering income. Rental losses are passive: they offset passive income freely, and up to $25,000/yr can offset ordinary (W-2) income if you actively participate and your MAGI is under $100k (phasing out to $0 by $150k); unused losses carry forward. On sale, claimed depreciation is recaptured at up to 25%, and gains may owe capital-gains tax (a 1031 exchange can defer both). Figures are a year-1 estimate at your 24.0% rate — not tax advice; consult a CPA.
Schools (NCES district)
- District
- Tippecanoe School Corporation
- NCES district ID
- 1811340
- Math proficiency
- 44% ▼ -6.00%
- Reading proficiency
- 49% ▼ -5.00%
- Median HH income
- $55,087
- Composite
- 40.36/100
- National rank
- #3741
- State rank
- #80 of 301 in IN
Livability — Battle Ground
- Score
- 75/100
- State rank
- #66
- US rank
- #4321
Category grades
Schools grade is shown separately in the Schools card above.
Census & demographics
- County
- Tippecanoe County · 181,820 people
- Metro
- Lafayette-West Lafayette, IN
- Population (ZIP)
- 75,198
- Household income
- $53,103
- Rent vs Own
- Severe rent burden
- 5978.0
Population outlook (Tippecanoe County) Hauer SSP2
- Today (2025)
- 215,327 people
- By 2030
- 232,284 · +7.9%
- By 2040
- 266,517 · +23.8%
- By 2050
- 302,826 · +40.6%
- By 2075
- 394,445 · +83.2%
- By 2100
- 463,500 · +115.3%
Race, ethnicity, and origin ACS 2023
- Neighborhood character
- Predominantly White (69%)
- Race & ethnicity
- White 69% Asian 16% Hispanic / Latino 7% Two or more races 5% Black 5%
- Hispanic origin (detail)
- Mexican 4%
- Common ancestry
- Romanian 4% Slovak 3% Italian 2%
- Foreign-born
- 18% · China, Canada, South Korea
- Languages at home
- 79% English-only · Chinese 5% Spanish 4% Other Indo-European 4%
Political lean MEDSL · Tippecanoe
- 2024 margin
- Toss-up / Even · D 49.0% · R 49.1% · Other 1.9%
- 2008→2024 swing
- -11.8pp toward R · 2008: 11.6pp · 2024: -0.1pp
- All cycles
- 2024: R+0.1 2020: D+0.6 2016: R+5.7 2012: R+3.6 2008: D+11.6
Not yet ingested
- Civics
- —
Market trends
- HPI YoY
- ▼ -134.80%
- Current HPI
- 210.545
- Rent YoY
- ▲ 3.20%
- Metro
- Lafayette-West Lafayette, IN
- State GDP YoY
- ▲ 2.90%
- F500 in state
- 18
Industry mix (Fortune 500 HQ in IN)
| Industry | F500 HQs | Revenue |
|---|---|---|
| Industrial Machinery | 2 | $37B |
|
||
| Healthcare | 1 | $177B |
|
||
| Pharmaceuticals | 1 | $45B |
|
||
| Metals / Steel | 1 | $18B |
|
||
| Agriculture | 1 | $17B |
|
||
| Packaging | 1 | $12B |
|
||
Price history
1 event — show timeline
- 2026-06-05 Listed $80,000 FSBO.com
Property tax history
-1.5%/yrLatest (2024): $941 · -0.2% YoY. Source: county tax records.
Cash-flow waterfall
monthlySold comps — $/sqft
last 12 mo · ≤1 miLoading sold comps…