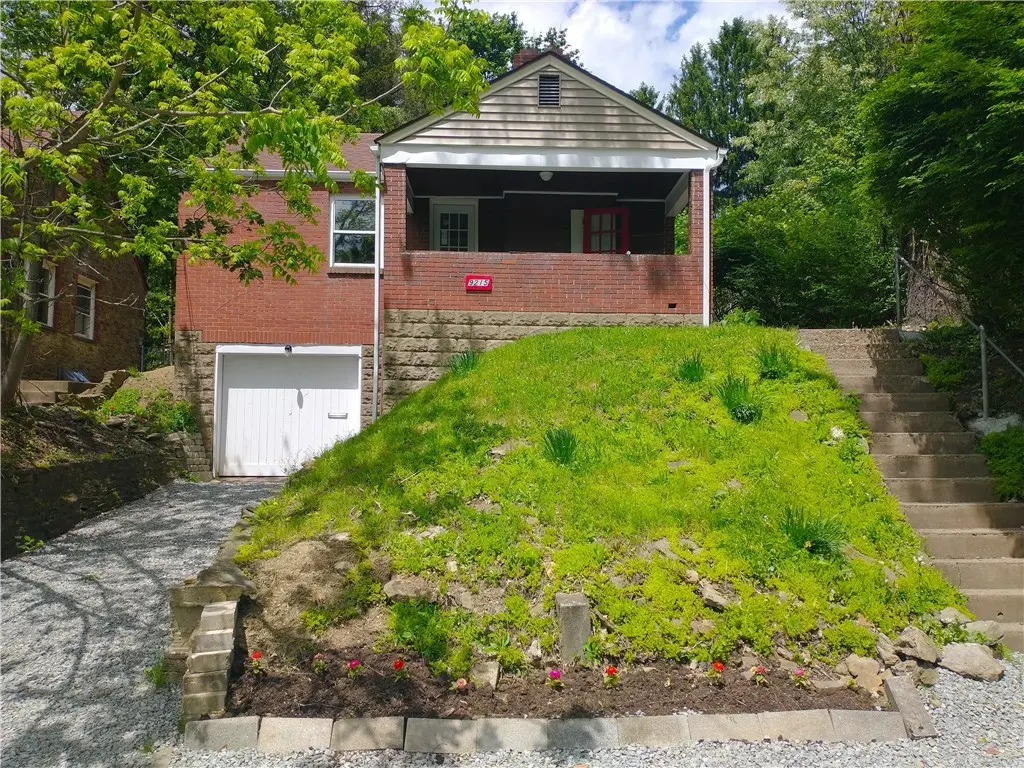
9215 Vantine St · Penn Hills, PA
Flood risk 1/10 · Minimal
- FEMA flood zone
- X (unshaded)
- Chance of flooding over 30 yrs
- 0.0%
- Est. flood insurance / yr
- $473 – $860
Fire risk 1/10 · Minimal
- Est. fire insurance / yr
- $511 – $949
Heat risk 3/10 · Minor
- Hot days now (above 96°F)
- 6 days/yr
- Hot days in 30 yrs
- 14 days/yr
Wind risk 2/10 · Minimal
- Chance of severe wind over 30 yrs
- —
Air-quality risk 4/10 · Minor
- Unhealthy air days now
- 5 days/yr
- Unhealthy air days in 30 yrs
- 7 days/yr
Risk factors via First Street. Map © Google.
Why this score? — see what drove the C grade
The composite is a weighted blend of 9 inputs, each scored 0–100. Each bar is that input's sub-score; the figure is the points it added to the 100-point composite (weight × sub-score).
- Cash flow +21.1/30.0
- ARV discount +12.8/15.0
- DSCR +6.7/10.0
- 1% rule +6.0/10.0
- Rent growth +4.4/5.0
- Livability +2.5/5.0
- Condition / age +2.5/5.0
- Schools +1.6/10.0
- Appreciation +0.0/10.0
$140,000
🖨 Deal sheet 📄 Offer letter ✓ Due diligence
Listing remarks MLS
Well maintained three bedroom home located in Penn Hills. Walk into hard wood flooring living room as you enter through a spacious, covered, front porch. Huge kitchen with additional eat-in space or storage space. Spacious master bedroom. Full bathroom on main level. Newer roof and furnace, updated electrical panel. Completely flat backyard with a patio space. One car integral garage with a driveway and additional parking pad that can park an additional three cars. Walking distance to bus stop and amenities.
Key facts
- Fresh paint
- Remodeled kitchen
- Refreshed bathroom
Tags
Property features AI
Exterior
- Parking: Built-in parking; Attached garage
- Utilities: Public water; Public sewer
- Home design: Single-story; Resale property
- Construction: Brick construction; Asphalt roof
- Exterior features: Public transportation access
Interior
- Kitchen: Stove; Refrigerator
- Bedrooms: Bedroom 2; Bedroom 3
- Flooring: Vinyl; Carpet
- Bathrooms: 1 full bathroom
- Heating & cooling: Forced air heating; Gas heating
- Interior features: Walk-up basement; Fireplace (1)
- Laundry & utility: Washer; Dryer
Neighborhood map
What this means for you Summary
Snapshot
- This is a 3-bed/1.0-bath single-family listed at $140k.
Deal economics
- At list price, monthly cash flow is $201 ($2k/yr) — positive.
- The deal already cash-flows at list — no discount required.
- Meets the 1% rule at list price ($2k rent vs $140k).
- Recommended offer: $136k (3.0% below list) — sets the bar for market timing.
Location & tenants
- Location reads: area grade C — affects rentability + tenant quality, not the cash-flow math above.
- Penn Hills SD (suburban): math 13% / reading 24% proficiency, ranked #496 of 539 in PA (top 92%) — low school quality limits family demand, transient renter base, plan for 1-2y turnover.
- Market conditions: Rents rising fast (+7.6%/yr); 129 active listings in the ZIP; 29 comparable units currently listed for rent nearby; rentals at typical pace (median 15d on market — plan ~3-4 weeks tenant-placement turnaround); 2,996 units permitted in Allegheny County in 2024 (1,588 in 5+ unit buildings).
Forward outlook
- Local home prices are declining (-3.0%/yr); year-one equity from $968 of loan paydown is wiped out by about $4k of value loss. Plan a longer hold.
- At projected returns (-3.0% appreciation + 7.6% rent growth), your $39k cash investment doubles in ~9 years — after that, you're playing with house money.
Negotiation context
- It's been on market 35 days — a 3% lower offer ($136k) is reasonable based on typical stale-listing flexibility.
- 4 sale attempts since 17y ago with the ask held roughly flat each time — persistent listings suggest the price (not the market) is what's stuck; bring a comps-based counter.
- Current owner paid $4k; list at $140k implies a 3633% gain — meaningful room to come down on a strong offer.
Risks & watch-outs
- Watch-outs: built in 1936 — expect roof / HVAC / electrical / plumbing capex.
Questions for the listing agent
- It's been on market 35 days. Have you received any prior offers? Is the seller open to a 3% concession, seller financing, or rate buy-down credit?
- Built in 1936 — when were the roof, HVAC, electrical panel, plumbing, and water heater last replaced?
- Is there a deadline driving the sale (1031 exchange, divorce, estate, relocation)? That informs how much negotiation room exists.
- What's the average days-on-market for RENTAL listings here right now (not sales)? A rising rental-DOM trend means longer vacancies and softer asking-rent achievability than the comps imply.
- What's the recent tenant-quality profile in this submarket — average credit score on applications, eviction rate, late-payment / NSF rate, and stable-employment percentage? A property-management company in the area should have these aggregated.
- How much new for-sale + rental construction is in the pipeline within 1–3 miles? Heavy new supply typically softens prices + rents 12–24 months out; constrained supply supports both.
Investment metrics
- 1% rule
- 1.10% ✓
- Cap rate
- 8.02%
- Cash-on-cash
- 6.16%
- DSCR
- 1.27
- GRM
- 7.6
CMA / ARV
- ARV (median comp)
- $158,624
- List price
- $140,000
- Delta
- -11.74%
- Verdict
- UNDERPRICED
- Comps
- 20 within 1.0 mi
Show comp detail 12 sales within ~0.75 mi
| Address | Dist | Beds/Ba | Sqft | Sold | Price | $/sf | Match |
|---|---|---|---|---|---|---|---|
| 108 Lavern St | 0.05mi | 3/1.5 | 1,176 (-10%) | 4mo | $175,000 | $149 | 75 |
| 2036 Sampson St | 0.25mi | 3/2.0 | 1,218 (-7%) | 1mo | $162,000 | $133 | 72 |
| 711 Gaywood Dr | 0.45mi | 3/1.5 | 1,264 (-4%) | 2mo | $242,000 | $191 | 69 |
| 139 Howard St | 0.17mi | 3/1.0 | 1,160 (-12%) | 5mo | $105,000 | $91 | 68 |
| 9611 Emerson St | 0.15mi | 3/1.0 | 1,120 (-15%) | 1mo | $75,000 | $67 | 68 |
| 162 Conestoga Rd | 0.26mi | 3/2.0 | 1,435 (+9%) | 4mo | $185,500 | $129 | 65 |
| 3012 Crab Hollow Rd | 0.44mi | 3/2.0 | 1,372 (+4%) | 4mo | $131,000 | $95 | 65 |
| 202 Duffield Ave | 0.59mi | 2/1.5 (-1) | 1,350 (+3%) | 2mo | $145,000 | $107 | 59 |
| 812 Parkway Ave | 0.72mi | 2/1.5 (-1) | 1,269 (-3%) | 2mo | $180,000 | $142 | 52 |
| 310 Mccutcheon Ln | 0.52mi | 3/2.0 | 1,163 (-12%) | 5mo | $70,000 | $60 | 48 |
| 35 Verona Rd | 0.39mi | 2/1.0 (-1) | 1,122 (-15%) | 5mo | $24,900 | $22 | 48 |
| 2339 Collins Rd | 0.70mi | 3/2.0 | 1,468 (+12%) | 3mo | $257,000 | $175 | 42 |
Match score weights: distance 35% · size 25% · config 20% · recency 20%. Top-matched comps best support the ARV.
Projected returns pro-forma
-3.0% appreciation · 7.63% rent growth · sell at horizon
- IRR
- -1.5%
- Equity multiple
- 0.94×
- Total profit
- $-2,303
- Equity at exit
- $20,874
- IRR
- 12.8%
- Equity multiple
- 2.24×
- Total profit
- $48,661
- Equity at exit
- $12,105
Cash invested: $39,200 (down + closing). Projections, not guarantees.
Landlord ↔ Tenant lean methodology
- Overall (STATE)
- 62 Landlord-Friendly
- State Pennsylvania
- 62 Landlord-Friendly · EVEN
- County
- — inherits STATE
- City
- — inherits STATE
ZIP-level market 15235
- Home prices YoY
- -34.1%
- Rents YoY
- 7.6%
- Active inventory
- 129
- Price-to-rent
- 7.6×
Monthly cashflow live
- Estimated rent
- $1,542 high interval (Pro) →
- Mortgage (P&I)
- −$734
- Tax from tax record
- −$224 /mo · $2,694/yr
- Insurance
- −$58
- HOA
- −$0
- Vacancy / Maint / Mgmt
- −$324
- Net cashflow
- $201
Break-even live
UW: 25.0% down · 7.5% · 30yr · 1.5% tax · 5.0% vac · 8.0% maint · 8.0% mgmt
Financing live
Cash to close
- Down payment
- $35,000
- Closing costs
- $4,200
- Reserves months
- —
- Total cash needed
- —
Loan-product check · same deal, 3 products live
Conventional
25% down · 7.5% · 30yr
- Down + closing
- —
- Monthly P&I
- —
- Monthly cashflow
- —
- DSCR
- —
- Eligible?
- —
Personal DTI + credit; lowest rate.
DSCR
20% down · 8.5% · 30yr
- Down + closing
- —
- Monthly P&I
- —
- Monthly cashflow
- —
- DSCR
- —
- Eligible?
- —
No personal income docs; deal must DSCR.
Hard money
10% down · 12.0% · 12mo
- Down + closing
- —
- Monthly P&I
- —
- Monthly cashflow
- —
- DSCR
- —
- Eligible?
- —
Short-term bridge; refi at stabilization.
Rent comps 29 comps
| Address | Beds | Baths | Sqft | Rent | $/sqft | DOM | Units | Dist |
|---|---|---|---|---|---|---|---|---|
| 185 Howard St Pittsburgh, PA | 2.0 | 1.0 | 1000 | $1,250 | $1.25 | 44d | 1 | 0.19mi |
| 3005 Laketon Rd Pittsburgh, PA | 3.0 | 1.0 | 1100 | $1,295 | $1.18 | 14d | 1 | 0.45mi |
| 648 Southern Ave Penn Hills, PA | 3.0 | 1.0 | 1100 | $1,600 | $1.45 | 7d | 1 | 0.51mi |
| 8918 Frankstown Rd Pittsburgh, PA | 3.0 | 1.0 | 1400 | $1,907 | $1.36 | 14d | 1 | 0.52mi |
| 610 Churchill Ave Pittsburgh, PA | 3.0 | 1.0 | 1100 | $1,395 | $1.27 | 2d | 1 | 0.54mi |
| 10135 Pearl Rd Pittsburgh, PA | 3.0 | 2.0 | 1163 | $1,450 | $1.25 | 24d | 1 | 0.61mi |
| 103 Grove Rd Verona, PA | 3.0 | 1.5 | 1460 | $1,450 | $0.99 | 12d | 1 | 0.62mi |
| 216 Grove Rd Verona, PA | 3.0 | 1.0 | 1165 | $1,550 | $1.33 | 44d | 1 | 0.69mi |
| 8606 Westwood Rd Pittsburgh, PA | 4.0 | 1.0 | 1596 | $1,425 | $0.89 | 44d | 1 | 0.78mi |
| 2031 Chalfant St Pittsburgh, PA | 3.0 | 1.5 | 1150 | $1,950 | $1.70 | 44d | 1 | 0.78mi |
| 8612 Oakcrest Rd Pittsburgh, PA | 2.0 | 1.0 | 1218 | $1,450 | $1.19 | 24d | 1 | 0.82mi |
| 62 Melvin Ct Penn Hills Township, PA | 1.0–2.0 | 1.0 | 825 | $1,549 | $1.88 | 7d | 2 | 0.88mi |
| 457 Elias Dr #445 Pittsburgh, PA | 2.0 | 1.0 | 888 | $1,200 | $1.35 | 17d | 1 | 0.95mi |
| 314 Penn Vista Dr Pittsburgh, PA | 2.0 | 1.0 | 1150 | $1,250 | $1.09 | 44d | 1 | 0.96mi |
| 1962 McNary Blvd Pittsburgh, PA | 3.0 | 1.0 | 1517 | $1,545 | $1.02 | 7d | 1 | 0.97mi |
| 251 Selvin Dr Verona, PA | 3.0 | 1.0 | 1320 | $1,295 | $0.98 | 3d | 1 | 1.04mi |
| 641 Penny Dr Pittsburgh, PA | 3.0 | 1.5 | 1199 | $1,525 | $1.27 | 14d | 1 | 1.06mi |
| 131 Jacob Dr Pittsburgh, PA | 3.0 | 1.0 | 1144 | $2,300 | $2.01 | 2d | 1 | 1.08mi |
| 273 Bramble St Verona, PA | 3.0 | 1.5 | 1076 | $1,720 | $1.60 | 4d | 1 | 1.10mi |
| 1713-1715 Clark St Unit 79-1804C Pittsburgh, PA | 2.0 | 1.0 | 972 | $1,200 | $1.23 | 4d | 1 | 1.13mi |
| 124 Dauntless Dr Pittsburgh, PA | 3.0 | 1.0 | 1100 | $1,395 | $1.27 | 24d | 1 | 1.13mi |
| 8075 Chaske St Verona, PA | 3.0 | 1.5 | 1092 | $1,425 | $1.30 | 7d | 1 | 1.17mi |
| 7534 Penn Bridge Ct Pittsburgh, PA | 2.0 | 2.0 | 1259 | $1,750 | $1.39 | 44d | 1 | 1.23mi |
| 1250 Blackadore Ave Pittsburgh, PA | 3.0 | 1.0 | 1440 | $1,750 | $1.22 | 24d | 1 | 1.28mi |
| 1515 Penn Ave Wilkinsburg, PA | 2.0 | 2.0 | 1012 | $1,100 | $1.09 | 44d | 1 | 1.37mi |
| 7215 Beacon Hill Dr Pittsburgh, PA | 2.0 | 2.0 | 1259 | $1,795 | $1.43 | 4d | 1 | 1.38mi |
| 11843 Joan Dr Pittsburgh, PA | 3.0 | 1.0 | 1144 | $1,500 | $1.31 | 4d | 1 | 1.45mi |
| 209 Briarwood Dr Pittsburgh, PA | 3.0 | 2.0 | 1080 | $1,500 | $1.39 | 24d | 1 | 1.46mi |
| 1526 Edwards St Verona, PA | 3.0 | 1.0 | 1296 | $1,730 | $1.33 | 44d | 1 | 1.46mi |
Listing history 23 events
-
2026-06-18days on market $140,000 Active 35 DOM
-
2026-06-17days on market $140,000 Active 34 DOM
-
2026-06-16days on market $140,000 Active 33 DOM
-
2026-06-15days on market $140,000 Active 32 DOM
-
2026-06-13days on market $140,000 Active 30 DOM
-
2026-06-13days on market $140,000 Active 29 DOM
-
2026-06-09days on market $140,000 Active 26 DOM
-
2026-06-08days on market $140,000 Active 25 DOM
-
2026-06-07days on market $140,000 Active 24 DOM
-
2026-06-05days on market $140,000 Active 21 DOM
-
2026-06-03days on market $140,000 Active 20 DOM
-
2026-06-02days on market $140,000 Active 19 DOM
-
2026-06-01days on market $140,000 Active 18 DOM
-
2026-06-01status $140,000 Active 17 DOM
-
2026-05-31days on market $140,000 Contingent 17 DOM
-
2026-05-14$140,000 Active 899-char remark
-
2026-04-08historical Expired 513-char remark
Show marketing remark (513 chars)
Well maintained three bedroom home located in Penn Hills. Walk into hard wood flooring living room as you enter through a spacious, covered, front porch. Huge kitchen with additional eat-in space or storage space. Spacious master bedroom. Full bathroom on main level. Newer roof and furnace, updated electrical panel. Completely flat backyard with a patio space. One car integral garage with a driveway and additional parking pad that can park an additional three cars. Walking distance to bus stop and amenities.
-
2025-10-30$120,000 Active 513-char remark
Show marketing remark (513 chars)
Well maintained three bedroom home located in Penn Hills. Walk into hard wood flooring living room as you enter through a spacious, covered, front porch. Huge kitchen with additional eat-in space or storage space. Spacious master bedroom. Full bathroom on main level. Newer roof and furnace, updated electrical panel. Completely flat backyard with a patio space. One car integral garage with a driveway and additional parking pad that can park an additional three cars. Walking distance to bus stop and amenities.
-
2009-04-27price $14,900
Show marketing remark (176 chars)
Sold as is. Buyer resp for all permits, tests & insps. LA to hold hand money. Taxes & lot size est. www. DarliWalker.com for offer instructions. REFER TO ADDENDUM T
-
2009-04-27soldstatus $3,750
Show marketing remark (176 chars)
Sold as is. Buyer resp for all permits, tests & insps. LA to hold hand money. Taxes & lot size est. www. DarliWalker.com for offer instructions. REFER TO ADDENDUM T
-
2009-03-18$3,750
Show marketing remark (176 chars)
Sold as is. Buyer resp for all permits, tests & insps. LA to hold hand money. Taxes & lot size est. www. DarliWalker.com for offer instructions. REFER TO ADDENDUM T
-
2008-10-30soldstatus $7,961
-
1991-11-20soldstatus $16,500
ⓘ Source: listings_history table (triggers on properties + properties_extension) + one-shot
backfill from property_details.listing_events for pre-trigger history.
Tax reassessment forecast PA · Partial reset (capped growth)
- Current annual tax
- $2,694 · $224/mo
- Projected year-2 tax
- $2,694 · $224/mo
- Expected delta
- $0/yr ($0/mo · 0.0%)
ⓘ Screening estimate from a state-policy table — verify with the county assessor before closing.
Climate risk First Street
- Flood 1/10 Low FEMA zone X (unshaded) · 0% chance over 30 yrs
- Wildfire 1/10 Low
- Heat 3/10 Moderate 6 d/yr ≥96°F today · 14 d/yr by 30 yrs out
- Wind 2/10 Low
- Air quality 4/10 Moderate 5 unhealthy d/yr today · 7 by 30 yrs out
Nearby sold comps map
Loading sold comps map…
Walkable amenities ~0.75 mi
Loading nearby amenities…
Taxation est. · year 1
- Rental income
- $18,503
- − Mortgage interest
- −$7,842
- − Property taxes
- −$2,694
- − Insurance
- −$700
- − Repairs & maintenance
- −$1,480
- − Management
- −$1,480
- − Depreciation
- −$4,073
- Taxable income
- $234
- Est. tax owed @ 24.0%
- −$56
- After-tax cash flow
- $2,357/yr
For passive investors: Depreciation is non-cash, so a rental often shows a tax loss while cash-flowing — sheltering income. Rental losses are passive: they offset passive income freely, and up to $25,000/yr can offset ordinary (W-2) income if you actively participate and your MAGI is under $100k (phasing out to $0 by $150k); unused losses carry forward. On sale, claimed depreciation is recaptured at up to 25%, and gains may owe capital-gains tax (a 1031 exchange can defer both). Figures are a year-1 estimate at your 24.0% rate — not tax advice; consult a CPA.
Schools (NCES district)
- District
- Penn Hills SD
- NCES district ID
- 4218590
- Math proficiency
- 13% ▼ -6.00%
- Reading proficiency
- 24% ▼ -14.00%
- Median HH income
- $47,794
- Composite
- 16.42/100
- National rank
- #9192
- State rank
- #496 of 539 in PA
Livability — Penn Hills
No livability data for this city. (Only ~50 U.S. cities are tracked.)
Census & demographics
- County
- Allegheny County · 1,022,028 people
- Metro
- Pittsburgh, PA
- Population (ZIP)
- 33,951
- Household income
- $67,240
- Rent vs Own
- Severe rent burden
- 955.0
Population outlook (Allegheny County) Hauer SSP2
- Today (2025)
- 1,250,282 people
- By 2030
- 1,256,482 · +0.5%
- By 2040
- 1,256,318 · +0.5%
- By 2050
- 1,244,169 · -0.5%
- By 2075
- 1,197,693 · -4.2%
- By 2100
- 1,093,187 · -12.6%
Race, ethnicity, and origin ACS 2023
- Neighborhood character
- Diverse neighborhood (Simpson 0.58)
- Race & ethnicity
- White 51% Black 40% Two or more races 7% Hispanic / Latino 2%
- Common ancestry
- Romanian 5% Serbian 2% Slovak 1%
- Foreign-born
- 4% · Canada
- Languages at home
- 97% English-only · Other Indo-European 1% Spanish 1%
Political lean MEDSL · Allegheny
- 2024 margin
- Strong D (+20.3) · D 59.7% · R 39.4%
- 2008→2024 swing
- +4.8pp toward D · 2008: 15.5pp · 2024: 20.3pp
- All cycles
- 2024: D+20.3 2020: D+20.4 2016: D+16.4 2012: D+14.4 2008: D+15.5
Not yet ingested
- Civics
- —
Market trends
- HPI YoY
- ▼ -121.68%
- Current HPI
- 235.4861
- Rent YoY
- ▲ 7.63%
- Metro
- Pittsburgh, PA
- State GDP YoY
- ▲ 1.68%
- F500 in state
- 34
Industry mix (Fortune 500 HQ in PA)
| Industry | F500 HQs | Revenue |
|---|---|---|
| Healthcare | 2 | $309B |
|
||
| Insurance | 2 | $27B |
|
||
| Telecommunications / Media | 1 | $124B |
|
||
| Industrial Distribution | 1 | $22B |
|
||
| Financial Services | 1 | $20B |
|
||
| Chemicals / Materials | 1 | $18B |
|
||
Price history
+748.5% since first listed10 events — show timeline
- 2026-05-31 Relisted — West Penn MLS
- 2026-05-22 Contingent — West Penn MLS
- 2026-05-14 Listed $140,000 West Penn MLS
- 2026-04-08 Delisted — West Penn MLS
- 2025-10-30 Listed $120,000 West Penn MLS
- 2009-04-27 Sold (MLS) $3,750 West Penn MLS
- 2009-04-27 Price Changed $14,900 West Penn MLS
- 2009-03-18 Listed $3,750 West Penn MLS
- 2008-10-30 Sold (Public Records) $7,961 Public Records
- 1991-11-20 Sold (Public Records) $16,500 Public Records
Property tax history
+2.5%/yrLatest (2026): $2,694 · +0.0% YoY. Source: county tax records.
Cash-flow waterfall
monthlySold comps — $/sqft
last 12 mo · ≤1 miLoading sold comps…