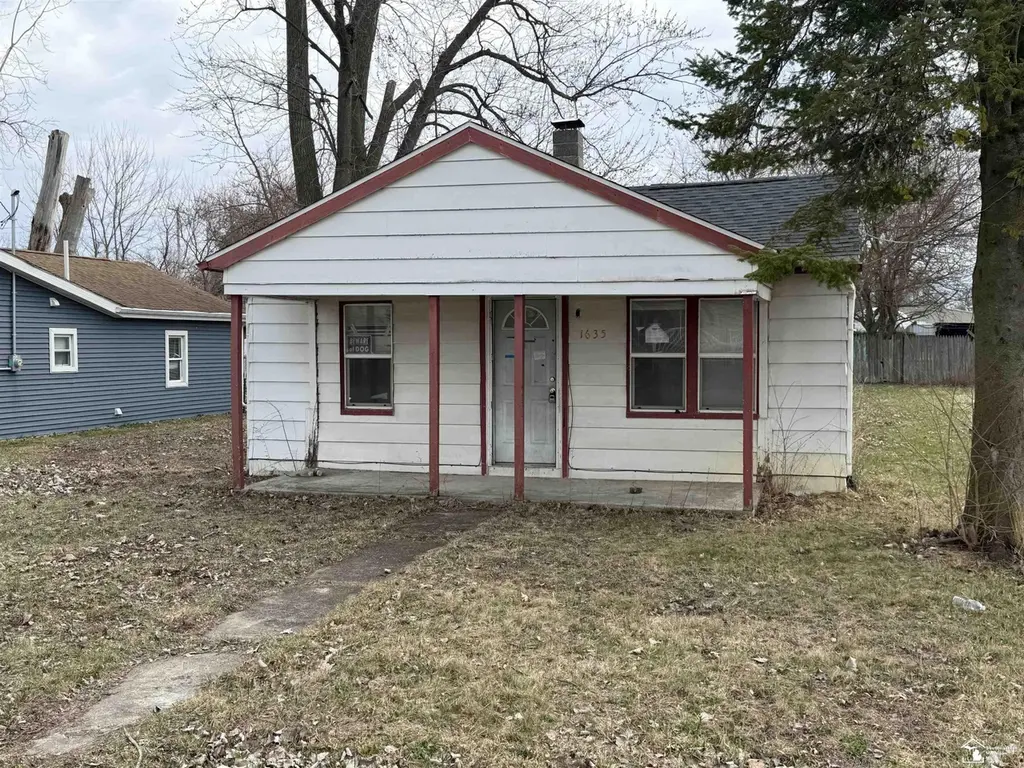
1635 Naomi Ave · Adrian, MI
Flood risk 1/10 · Minimal
- FEMA flood zone
- X (unshaded)
- Chance of flooding over 30 yrs
- 0.0%
- Est. flood insurance / yr
- $507 – $1,088
Fire risk 3/10 · Minor
- Est. fire insurance / yr
- $784 – $1,456
Heat risk 3/10 · Minor
- Hot days now (above 99°F)
- 7 days/yr
- Hot days in 30 yrs
- 15 days/yr
Wind risk 2/10 · Minimal
- Chance of severe wind over 30 yrs
- —
Air-quality risk 2/10 · Minimal
- Unhealthy air days now
- 1 days/yr
- Unhealthy air days in 30 yrs
- 1 days/yr
Risk factors via First Street. Map © Google.
Why this score? — see what drove the D grade
The composite is a weighted blend of 9 inputs, each scored 0–100. Each bar is that input's sub-score; the figure is the points it added to the 100-point composite (weight × sub-score).
- Cash flow +15.0/30.0
- ARV discount +7.5/15.0
- 1% rule +5.0/10.0
- DSCR +5.0/10.0
- Schools +3.5/10.0
- Livability +3.5/5.0
- Rent growth +2.5/5.0
- Condition / age +2.5/5.0
- Appreciation +0.0/10.0
$15,000
🖨 Deal sheet 📄 Offer letter ✓ Due diligence
Listing remarks MLS
This 3 bedroom, 1 bath home presents a strong value add opportunity for investors or buyers looking to build equity through renovation. While the home is in need of significant updates, it offers over 1,000 square feet, a large lot, and a welcoming front porch. The current seller has already completed a major improvement with a new roof installed in February 2023. With the right vision, this property has excellent potential as a profitable flip, rental, or long term hold. Cash offers only. No entry will be permitted without a signed Property Entry Hold Harmless and Liability Waiver Agreement (attached in MLS). Multiple offer situation - Highest and Best CASH offers deadline is Monday, April 6th 2026 at 11:00 AM One time showing investor open house Friday, April 3, 2026 11:00 am to 11:30am. Must sign Hold Harmless and Liability Waiver Agreement before entry.
Key facts
- Large lot
- New roof
- 5,663 sq ft lot
Tags
Neighborhood map
What this means for you Summary
Snapshot
- This is a 3-bed/1.0-bath single-family listed at $15k.
Deal economics
- At list price, monthly cash flow is $1k ($12k/yr) — positive.
- The deal already cash-flows at list — no discount required.
- Meets the 1% rule at list price ($2k rent vs $15k).
- Recommended offer: $15k (1.5% below list) — sets the bar for market timing.
- Cap rate 89.5% vs local median 5.7% in Adrian — top-decile yield for the area; either an underpriced asset or a hidden risk that comps aren't pricing in. Stress-test before assuming the spread holds.
Location & tenants
- Location reads 69/100 on livability (#342 in MI) — a middle-class / working-renter tenant base. Strengths: cost of living A+, housing A+, health & safety A+; Watch: amenities D, crime F, commute F.
- Madison School District (Lenawee) (town): math 34% / reading 51% proficiency, ranked #195 of 540 in MI (top 36%) — families likely to look elsewhere, expect single-tenant / working-renter base with shorter leases.
- Market conditions: 214 active listings in the ZIP; 1 comparable units currently listed for rent nearby; 137 units permitted in Lenawee County in 2024 (0 in 5+ unit buildings).
Forward outlook
- Local home prices are declining (-3.0%/yr); year-one equity from $104 of loan paydown is wiped out by about $450 of value loss. Plan a longer hold.
- Lenawee County population projected at -18% by 2050 — secular population decline; favor cash flow + early exit over multi-decade hold.
- At projected returns (-3.0% appreciation + 3.0% rent growth), your $4k cash investment doubles in ~1 year — after that, you're playing with house money.
Negotiation context
- It's been on market 17 days — a 2% lower offer ($15k) is reasonable based on typical stale-listing flexibility.
- 7 sale attempts since 11y ago with the ask held roughly flat each time — persistent listings suggest the price (not the market) is what's stuck; bring a comps-based counter.
- Current owner paid $6k; list at $15k implies a 161% gain — meaningful room to come down on a strong offer.
Risks & watch-outs
- Watch-outs: property tax is 4.8% of price; built in 1940 — expect roof / HVAC / electrical / plumbing capex.
Questions for the listing agent
- Built in 1940 — when were the roof, HVAC, electrical panel, plumbing, and water heater last replaced?
- Property tax is high relative to price — has the assessment been appealed recently, and will the sale trigger a re-assessment?
- Is there a deadline driving the sale (1031 exchange, divorce, estate, relocation)? That informs how much negotiation room exists.
- Crime grade is F in this area — have there been break-ins, vandalism, or insurance claims at this property in the last 3 years? What carrier currently insures it and at what premium?
- The area grade is low — what's the realistic commute time and amenity access for the typical tenant pool here? Any planned neighborhood developments (good or bad) we should know about?
- What's the average days-on-market for RENTAL listings here right now (not sales)? A rising rental-DOM trend means longer vacancies and softer asking-rent achievability than the comps imply.
- What's the recent tenant-quality profile in this submarket — average credit score on applications, eviction rate, late-payment / NSF rate, and stable-employment percentage? A property-management company in the area should have these aggregated.
- How much new for-sale + rental construction is in the pipeline within 1–3 miles? Heavy new supply typically softens prices + rents 12–24 months out; constrained supply supports both.
Investment metrics
- 1% rule
- 10.00% ✓
- Cap rate
- 89.47%
- Cash-on-cash
- 297.07%
- DSCR
- 14.22
- GRM
- 0.8
CMA / ARV
- ARV (on-the-fly)
- $111,888
- Comps found
- 12
Show comp detail 12 sales within ~0.75 mi
| Address | Dist | Beds/Ba | Sqft | Sold | Price | $/sf | Match |
|---|---|---|---|---|---|---|---|
| 1580 Naomi Ave | 0.04mi | 2/1.0 (-1) | 1,056 (+5%) | 11mo | $22,000 | $21 | 76 |
| 831 E Maumee St | 0.65mi | 3/1.0 | 1,008 (0%) | 1mo | $143,900 | $143 | 69 |
| 1046 Railroad St | 0.39mi | 2/1.0 (-1) | 1,008 (0%) | 14mo | $60,000 | $60 | 65 |
| 1025 Frank St | 0.49mi | 2/1.0 (-1) | 1,002 (-1%) | 14mo | $111,300 | $111 | 60 |
| 316 S Dean St | 0.38mi | 3/1.0 | 1,145 (+14%) | 11mo | $98,900 | $86 | 51 |
| 428 Elm Street St | 0.74mi | 3/1.0 | 1,040 (+3%) | 11mo | $140,000 | $135 | 51 |
| 2751 Cloverdale Ave | 0.42mi | 2/1.0 (-1) | 916 (-9%) | 14mo | $142,400 | $155 | 49 |
| 209 Sarah St | 0.47mi | 2/1.0 (-1) | 916 (-9%) | 11mo | $116,000 | $127 | 48 |
| 2739 Drexel Blvd | 0.36mi | 4/1.0 (+1) | 1,122 (+11%) | 15mo | $32,500 | $29 | 47 |
| 547 Tabor St | 0.73mi | 2/1.0 (-1) | 974 (-3%) | 11mo | $55,000 | $56 | 46 |
| 810 E Beecher St | 0.68mi | 3/2.0 | 1,124 (+12%) | 0mo | $155,000 | $138 | 45 |
| 210 Elm St | 0.74mi | 2/1.0 (-1) | 950 (-6%) | 12mo | $33,000 | $35 | 41 |
Match score weights: distance 35% · size 25% · config 20% · recency 20%. Top-matched comps best support the ARV.
Projected returns pro-forma
-3.0% appreciation · 3.0% rent growth · sell at horizon
- IRR
- —
- Equity multiple
- 16.20×
- Total profit
- $63,839
- Equity at exit
- $2,237
- IRR
- —
- Equity multiple
- 34.58×
- Total profit
- $141,056
- Equity at exit
- $1,297
Cash invested: $4,200 (down + closing). Projections, not guarantees.
Landlord ↔ Tenant lean methodology
- Overall (STATE)
- 62 Landlord-Friendly
- State Michigan
- 62 Landlord-Friendly · EVEN
- County
- — inherits STATE
- City
- — inherits STATE
ZIP-level market 49221
- Active inventory
- 214
- Price-to-rent
- 0.8×
Monthly cashflow live
- Estimated rent
- $1,500 medium interval (Pro) →
- Mortgage (P&I)
- −$79
- Tax from tax record
- −$60 /mo · $724/yr
- Insurance
- −$6
- HOA
- −$0
- Vacancy / Maint / Mgmt
- −$315
- Net cashflow
- $1,040
Break-even live
UW: 25.0% down · 7.5% · 30yr · 1.5% tax · 5.0% vac · 8.0% maint · 8.0% mgmt
Financing live
Cash to close
- Down payment
- $3,750
- Closing costs
- $450
- Reserves months
- —
- Total cash needed
- —
Loan-product check · same deal, 3 products live
Conventional
25% down · 7.5% · 30yr
- Down + closing
- —
- Monthly P&I
- —
- Monthly cashflow
- —
- DSCR
- —
- Eligible?
- —
Personal DTI + credit; lowest rate.
DSCR
20% down · 8.5% · 30yr
- Down + closing
- —
- Monthly P&I
- —
- Monthly cashflow
- —
- DSCR
- —
- Eligible?
- —
No personal income docs; deal must DSCR.
Hard money
10% down · 12.0% · 12mo
- Down + closing
- —
- Monthly P&I
- —
- Monthly cashflow
- —
- DSCR
- —
- Eligible?
- —
Short-term bridge; refi at stabilization.
Rent comps 1 comps
| Address | Beds | Baths | Sqft | Rent | $/sqft | DOM | Units | Dist |
|---|---|---|---|---|---|---|---|---|
| 413 E Maple Ave Unit 1 Adrian, MI | 2.0 | 1.0 | 826 | $1,500 | $1.82 | 23d | 1 | 0.98mi |
Listing history 15 events
-
2026-04-06status Pending
Show marketing remark (870 chars)
This 3 bedroom, 1 bath home presents a strong value add opportunity for investors or buyers looking to build equity through renovation. While the home is in need of significant updates, it offers over 1,000 square feet, a large lot, and a welcoming front porch. The current seller has already completed a major improvement with a new roof installed in February 2023. With the right vision, this property has excellent potential as a profitable flip, rental, or long term hold. Cash offers only. No entry will be permitted without a signed Property Entry Hold Harmless and Liability Waiver Agreement (attached in MLS). Multiple offer situation - Highest and Best CASH offers deadline is Monday, April 6th 2026 at 11:00 AM One time showing investor open house Friday, April 3, 2026 11:00 am to 11:30am. Must sign Hold Harmless and Liability Waiver Agreement before entry.
-
2026-04-06status Pending 870-char remark
Show marketing remark (870 chars)
This 3 bedroom, 1 bath home presents a strong value add opportunity for investors or buyers looking to build equity through renovation. While the home is in need of significant updates, it offers over 1,000 square feet, a large lot, and a welcoming front porch. The current seller has already completed a major improvement with a new roof installed in February 2023. With the right vision, this property has excellent potential as a profitable flip, rental, or long term hold. Cash offers only. No entry will be permitted without a signed Property Entry Hold Harmless and Liability Waiver Agreement (attached in MLS). Multiple offer situation - Highest and Best CASH offers deadline is Monday, April 6th 2026 at 11:00 AM One time showing investor open house Friday, April 3, 2026 11:00 am to 11:30am. Must sign Hold Harmless and Liability Waiver Agreement before entry.
-
2026-03-20$15,000 Active
Show marketing remark (870 chars)
This 3 bedroom, 1 bath home presents a strong value add opportunity for investors or buyers looking to build equity through renovation. While the home is in need of significant updates, it offers over 1,000 square feet, a large lot, and a welcoming front porch. The current seller has already completed a major improvement with a new roof installed in February 2023. With the right vision, this property has excellent potential as a profitable flip, rental, or long term hold. Cash offers only. No entry will be permitted without a signed Property Entry Hold Harmless and Liability Waiver Agreement (attached in MLS). Multiple offer situation - Highest and Best CASH offers deadline is Monday, April 6th 2026 at 11:00 AM One time showing investor open house Friday, April 3, 2026 11:00 am to 11:30am. Must sign Hold Harmless and Liability Waiver Agreement before entry.
-
2026-03-20$15,000 Active 870-char remark
Show marketing remark (870 chars)
This 3 bedroom, 1 bath home presents a strong value add opportunity for investors or buyers looking to build equity through renovation. While the home is in need of significant updates, it offers over 1,000 square feet, a large lot, and a welcoming front porch. The current seller has already completed a major improvement with a new roof installed in February 2023. With the right vision, this property has excellent potential as a profitable flip, rental, or long term hold. Cash offers only. No entry will be permitted without a signed Property Entry Hold Harmless and Liability Waiver Agreement (attached in MLS). Multiple offer situation - Highest and Best CASH offers deadline is Monday, April 6th 2026 at 11:00 AM One time showing investor open house Friday, April 3, 2026 11:00 am to 11:30am. Must sign Hold Harmless and Liability Waiver Agreement before entry.
-
2018-01-25historical
-
2018-01-25historical
-
2018-01-03price $12,900
-
2017-12-04$12,900
-
2017-12-04$14,900 Active
-
2017-10-05historical
-
2017-10-05historical
-
2017-09-19$24,900 Active
-
2017-09-19$24,900
-
2015-08-14soldstatus $5,755
-
2015-04-02$13,900
ⓘ Source: listings_history table (triggers on properties + properties_extension) + one-shot
backfill from property_details.listing_events for pre-trigger history.
Tax reassessment forecast MI · Partial reset (capped growth)
- Current annual tax
- $724 · $60/mo
- Projected year-2 tax
- $724 · $60/mo
- Expected delta
- $0/yr ($0/mo · 0.0%)
ⓘ Screening estimate from a state-policy table — verify with the county assessor before closing.
Climate risk First Street
- Flood 1/10 Low FEMA zone X (unshaded) · 0% chance over 30 yrs
- Wildfire 3/10 Moderate
- Heat 3/10 Moderate 7 d/yr ≥99°F today · 15 d/yr by 30 yrs out
- Wind 2/10 Low
- Air quality 2/10 Low 1 unhealthy d/yr today · 1 by 30 yrs out
Nearby sold comps map
Loading sold comps map…
Walkable amenities ~0.75 mi
Loading nearby amenities…
Taxation est. · year 1
- Rental income
- $18,000
- − Mortgage interest
- −$840
- − Property taxes
- −$724
- − Insurance
- −$75
- − Repairs & maintenance
- −$1,440
- − Management
- −$1,440
- − Depreciation
- −$436
- Taxable income
- $13,044
- Est. tax owed @ 24.0%
- −$3,131
- After-tax cash flow
- $9,346/yr
For passive investors: Depreciation is non-cash, so a rental often shows a tax loss while cash-flowing — sheltering income. Rental losses are passive: they offset passive income freely, and up to $25,000/yr can offset ordinary (W-2) income if you actively participate and your MAGI is under $100k (phasing out to $0 by $150k); unused losses carry forward. On sale, claimed depreciation is recaptured at up to 25%, and gains may owe capital-gains tax (a 1031 exchange can defer both). Figures are a year-1 estimate at your 24.0% rate — not tax advice; consult a CPA.
Schools (NCES district)
- District
- Madison School District (Lenawee)
- NCES district ID
- 2622320
- Math proficiency
- 34% ▼ -10.00%
- Reading proficiency
- 51% ▼ -5.00%
- Median HH income
- $37,961
- Composite
- 35.35/100
- National rank
- #4959
- State rank
- #195 of 540 in MI
Livability — Adrian
- Score
- 69/100
- State rank
- #342
- US rank
- #8722
Category grades
Schools grade is shown separately in the Schools card above.
Census & demographics
- City population
- 41,041
- Population (ZIP)
- 41,041
Population outlook (Lenawee County) Hauer SSP2
- Today (2025)
- 95,497 people
- By 2030
- 92,722 · -2.9%
- By 2040
- 85,641 · -10.3%
- By 2050
- 77,971 · -18.4%
- By 2075
- 60,043 · -37.1%
- By 2100
- 41,468 · -56.6%
Race, ethnicity, and origin ACS 2023
- Neighborhood character
- Predominantly White (77%)
- Race & ethnicity
- White 77% Hispanic / Latino 14% Two or more races 8% Black 4%
- Hispanic origin (detail)
- Mexican 12%
- Common ancestry
- Romanian 3% Lithuanian 3% Italian 2%
- Foreign-born
- 3% · Canada
- Languages at home
- 93% English-only · Spanish 6% Arabic 1%
Political lean MEDSL · Lenawee
- 2024 margin
- Strong R (+23.0) · D 37.8% · R 60.8% · Other 1.4%
- 2008→2024 swing
- -28.1pp toward R · 2008: 5.1pp · 2024: -23.0pp
- All cycles
- 2024: R+23.0 2020: R+19.9 2016: R+21.1 2012: R+1.3 2008: D+5.1
Not yet ingested
- Civics
- —
Market trends
- HPI YoY
- ▼ -143.64%
- Current HPI
- 237.3796
- Rent YoY
- —
- Metro
- —
- State GDP YoY
- ▲ 1.37%
- F500 in state
- 28
Industry mix (Fortune 500 HQ in MI)
| Industry | F500 HQs | Revenue |
|---|---|---|
| Automotive Parts | 3 | $48B |
|
||
| Automotive | 2 | $372B |
|
||
| Chemicals | 1 | $45B |
|
||
| Automotive Retail | 1 | $29B |
|
||
| Healthcare / Medical Devices | 1 | $23B |
|
||
| Automotive Technology | 1 | $20B |
|
||
Price history
+7.9% since first listed15 events — show timeline
- 2026-04-06 Pending — REALCOMP
- 2026-04-06 Pending — MiRealSource-MiMLS
- 2026-03-20 Listed $15,000 MiRealSource-MiMLS
- 2026-03-20 Listed $15,000 REALCOMP
- 2018-01-25 Listing Removed — MiRealSource-MiMLS
- 2018-01-25 Listing Removed — REALCOMP
- 2018-01-03 Price Changed $12,900 MiRealSource-MiMLS
- 2017-12-04 Listed $14,900 MiRealSource-MiMLS
- 2017-12-04 Listed $12,900 REALCOMP
- 2017-10-05 Listing Removed — MiRealSource-MiMLS
- 2017-10-05 Listing Removed — REALCOMP
- 2017-09-19 Listed $24,900 MiRealSource-MiMLS
- 2017-09-19 Listed $24,900 REALCOMP
- 2015-08-14 Sold (MLS) $5,755 REALCOMP
- 2015-04-02 Listed $13,900 REALCOMP
Property tax history
+3.8%/yrLatest (2025): $724 · -43.2% YoY. Source: county tax records.
Cash-flow waterfall
monthlySold comps — $/sqft
last 12 mo · ≤1 miLoading sold comps…