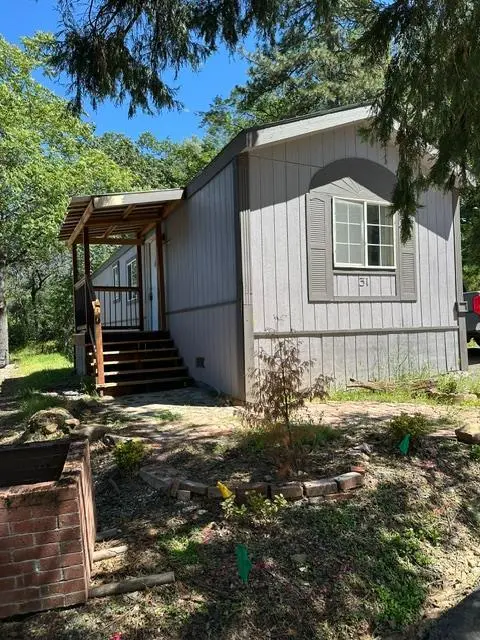
3020 New Town Rd #31 · Placerville, CA
Flood risk 1/10 · Minimal
- FEMA flood zone
- X (unshaded)
- Chance of flooding over 30 yrs
- 0.0%
- Est. flood insurance / yr
- $507 – $1,088
Fire risk 8/10 · Major
- Est. fire insurance / yr
- $659 – $1,223
Heat risk 5/10 · Moderate
- Hot days now (above 99°F)
- 7 days/yr
- Hot days in 30 yrs
- 16 days/yr
Wind risk 1/10 · Minimal
- Chance of severe wind over 30 yrs
- —
Air-quality risk 10/10 · Severe
- Unhealthy air days now
- 27 days/yr
- Unhealthy air days in 30 yrs
- 32 days/yr
Risk factors via First Street. Map © Google.
Why this score? — see what drove the B+ grade
The composite is a weighted blend of 9 inputs, each scored 0–100. Each bar is that input's sub-score; the figure is the points it added to the 100-point composite (weight × sub-score).
- Cash flow +30.0/30.0
- ARV discount +15.0/15.0
- 1% rule +10.0/10.0
- DSCR +10.0/10.0
- Rent growth +5.0/5.0
- Schools +3.3/10.0
- Livability +3.1/5.0
- Condition / age +2.5/5.0
- Appreciation +0.0/10.0
$75,000
🖨 Deal sheet (PDF) 📄 Offer letter ✓ Due diligence
Listing remarks
Discover the allure of effortless living at 3020 New Town Rd. #31, Placerville, CA. This inviting mobile home is ready for you to move in and begin your next chapter, offering a unique blend of comfort and convenience in a desirable location. Step outside to a welcoming covered deck, an ideal extension of your living space. This thoughtful addition provides a pleasant spot for morning coffee, evening relaxation, or simply enjoying the fresh air in comfort and style. This is more than just a residence; it's an opportunity to embrace a vibrant lifestyle. Contact us today to schedule your private viewing and experience the charm of this exceptional property.
Key facts
- 6.57 acre lot
- Built 1995
- Listed 23 days
Property features AI
Finance
- Other: Located in Placerville, CA (3020 New Town Rd #31); Senior community: no
- HOA & community: No association; Land lease: yes — $995 (land lease amount)
Exterior
- Parking: Guest parking available; No garage
- Utilities: Propane; 220 volt outlet in kitchen; Public sewer; Water district
- Home design: Manufactured in park; Floating home; Single-story (manufactured unit); Facing direction: not specified; Year built: 1995; Original condition
- Construction: Shingle roof; Wood skirting; 1995 manufacturer: Fleetwood HM Inc.
- Exterior features: Patio awning; Porch; Shape: regular (see remarks)
Interior
- Kitchen: Gas cook top; Laminate counters
- Bedrooms: 2 bedrooms
- Flooring: Laminate flooring
- Bathrooms: 2 full bathrooms; Tub with shower over
- Heating & cooling: Central heating; Ceiling fans
- Interior features: Porch; Window screens; Patio awning; Original condition
- Laundry & utility: Interior laundry area; Gas hookup for washer/dryer; Gas water heater
Neighborhood map
What this means for you Summary
Snapshot
- This is a 2-bed/2.0-bath manufactured listed at $75k.
Deal economics
- At list price, monthly cash flow is $932 ($11k/yr) — positive.
- The deal already cash-flows at list — no discount required.
- Meets the 1% rule at list price ($2k rent vs $75k).
- Recommended offer: $74k (1.5% below list) — sets the bar for market timing.
- Cap rate 21.2% vs local median 2.8% in Placerville — top-decile yield for the area; either an underpriced asset or a hidden risk that comps aren't pricing in. Stress-test before assuming the spread holds.
Location & tenants
- Location reads 61/100 on livability (#553 in CA) — a middle-class / working-renter tenant base. Strengths: housing B+; Watch: amenities D, crime F, commute F.
- Placerville Union Elementary (town): math 29% / reading 46% proficiency, ranked #248 of 517 in CA (top 48%) — families likely to look elsewhere, expect single-tenant / working-renter base with shorter leases.
- Zoned schools: Edwin Markham Middle (math 23% / reading 47%, grade F, #181 of 498 statewide, top 36%, 391 students, 64% FRL); El Dorado High (math 30% / reading 60%, grade D-, #425 of 1,170 statewide, top 37%, 1,224 students, 30% FRL) — zoned schools at 47% FRL track the district average.
- Market conditions: Rents rising fast (+12.5%/yr); 352 active listings in the ZIP; 2 comparable units currently listed for rent nearby; solid renter incomes; 437 units permitted in El Dorado County in 2024 (0 in 5+ unit buildings).
Forward outlook
- Local home prices are declining (-3.0%/yr); year-one equity from $519 of loan paydown is wiped out by about $2k of value loss. Plan a longer hold.
- El Dorado County population projected to shrink 3% by 2050 — rents likely to lag national; underwrite the cash flow, not the appreciation.
- At projected returns (-3.0% appreciation + 8.0% rent growth), your $21k cash investment doubles in ~3 years — after that, you're playing with house money.
Negotiation context
- It's been on market 23 days — a 2% lower offer ($74k) is reasonable based on typical stale-listing flexibility.
Risks & watch-outs
- Climate carrying-cost: severe wildfire risk; extreme-heat days projected 7→16/yr by 2055 (HVAC capex compounding) — expect insurance premiums to compound above CPI over the hold.
Questions for the listing agent
- Is there a deadline driving the sale (1031 exchange, divorce, estate, relocation)? That informs how much negotiation room exists.
- Schools are D-rated, which usually means shorter tenancies and higher turnover. Who's the typical renter profile here, and what's been the actual vacancy rate?
- Crime grade is F in this area — have there been break-ins, vandalism, or insurance claims at this property in the last 3 years? What carrier currently insures it and at what premium?
- What's the average days-on-market for RENTAL listings here right now (not sales)? A rising rental-DOM trend means longer vacancies and softer asking-rent achievability than the comps imply.
- What's the recent tenant-quality profile in this submarket — average credit score on applications, eviction rate, late-payment / NSF rate, and stable-employment percentage? A property-management company in the area should have these aggregated.
- How much new for-sale + rental construction is in the pipeline within 1–3 miles? Heavy new supply typically softens prices + rents 12–24 months out; constrained supply supports both.
Investment metrics
- 1% rule
- 2.33% ✓
- Cap rate
- 21.20%
- Cash-on-cash
- 53.26%
- DSCR
- 3.37
- GRM
- 3.6
CMA / ARV
- ARV (on-the-fly)
- $116,760
- Comps found
- 3
Show comp detail 3 sales within ~0.75 mi
| Address | Dist | Beds/Ba | Sqft | Sold | Price | $/sf | Match |
|---|---|---|---|---|---|---|---|
| 2900 Parkway Dr #12 | 0.14mi | 2/1.0 | 800 (-5%) | 2mo | $85,000 | $106 | 80 |
| 3020 S Newtown Rd #33 | 0.02mi | 3/2.0 (+1) | 960 (+14%) | 16mo | $140,000 | $146 | 57 |
| 3020 Newtown Rd #30 | 0.10mi | 3/2.0 (+1) | 960 (+14%) | 24mo | $133,000 | $139 | 46 |
Match score weights: distance 35% · size 25% · config 20% · recency 20%. Top-matched comps best support the ARV.
Projected returns pro-forma
-3.0% appreciation · 8.0% rent growth · sell at horizon
- IRR
- 56.6%
- Equity multiple
- 3.69×
- Total profit
- $56,408
- Equity at exit
- $11,183
- IRR
- 63.3%
- Equity multiple
- 8.97×
- Total profit
- $167,451
- Equity at exit
- $6,485
Cash invested: $21,000 (down + closing). Projections, not guarantees.
Landlord ↔ Tenant lean methodology
- Overall (STATE)
- 18 Strongly Tenant-Friendly
- State California
- 18 Strongly Tenant-Friendly · D+13
- County
- — inherits STATE
- City
- — inherits STATE
ZIP-level market 95667
- Rents YoY
- 12.5%
- Active inventory
- 352
- Price-to-rent
- 3.6×
Monthly cashflow live
- Estimated rent
- $1,745 medium interval (Pro) →
- Mortgage (P&I)
- −$393
- Tax from tax record
- −$22 /mo · $263/yr
- Insurance
- −$31
- HOA
- −$0
- Vacancy / Maint / Mgmt
- −$366
- Net cashflow
- $932
Break-even live
Sensitivity live
| Price | -10% $974 | -5% $953 | +0% $932 | +5% $911 | +10% $890 |
|---|---|---|---|---|---|
| Rent | -10% $794 | -5% $863 | +0% $932 | +5% $1,001 | +10% $1,070 |
| Rate | -1.0pp $970 | -0.5pp $951 | base $932 | +0.5pp $913 | +1.0pp $893 |
UW: 25.0% down · 7.5% · 30yr · 1.5% tax · 5.0% vac · 8.0% maint · 8.0% mgmt
Financing live
Cash to close
- Down payment
- $18,750
- Closing costs
- $2,250
- Reserves months
- —
- Total cash needed
- —
Loan-product check · same deal, 3 products live
Conventional
25% down · 7.5% · 30yr
- Down + closing
- —
- Monthly P&I
- —
- Monthly cashflow
- —
- DSCR
- —
- Eligible?
- —
Personal DTI + credit; lowest rate.
DSCR
20% down · 8.5% · 30yr
- Down + closing
- —
- Monthly P&I
- —
- Monthly cashflow
- —
- DSCR
- —
- Eligible?
- —
No personal income docs; deal must DSCR.
Hard money
10% down · 12.0% · 12mo
- Down + closing
- —
- Monthly P&I
- —
- Monthly cashflow
- —
- DSCR
- —
- Eligible?
- —
Short-term bridge; refi at stabilization.
Rent comps 2 comps
| Address | Beds | Baths | Sqft | Rent | $/sqft | DOM | Units | Dist |
|---|---|---|---|---|---|---|---|---|
| 2915 Jacquier Rd Placerville, CA | 3.0 | 1.0 | 864 | $1,600 | $1.85 | 21d | 1 | 0.66mi |
| 3000 Sippy Ln Unit A Placerville, CA | 2.0 | 2.0 | 1000 | $1,800 | $1.80 | 0d | 1 | 1.05mi |
Listing history 14 events
-
2026-06-21days on market $75,000 Active 23 DOM
-
2026-06-18days on market $75,000 Active 20 DOM
-
2026-06-17days on market $75,000 Active 19 DOM
-
2026-06-16days on market $75,000 Active 18 DOM
-
2026-06-15days on market $75,000 Active 17 DOM
-
2026-06-13days on market $75,000 Active 15 DOM
-
2026-06-09days on market $75,000 Active 11 DOM
-
2026-06-08days on market $75,000 Active 10 DOM
-
2026-06-07days on market $75,000 Active 9 DOM
-
2026-06-05days on market $75,000 Active 6 DOM
-
2026-06-03days on market $75,000 Active 5 DOM
-
2026-06-02days on market $75,000 Active 4 DOM
-
2026-06-01days on market $75,000 Active 3 DOM
-
2026-05-31days on market $75,000 Active 2 DOM
ⓘ Source: listings_history table (triggers on properties + properties_extension) + one-shot
backfill from property_details.listing_events for pre-trigger history.
Tax reassessment forecast CA · Resets to sale price
- Current annual tax
- $263 · $22/mo
- Projected year-2 tax
- $570 · $48/mo
- Expected delta
- +$307/yr (+$26/mo · 116.4%)
ⓘ Screening estimate from a state-policy table — verify with the county assessor before closing.
Climate risk First Street
- Flood 1/10 Low FEMA zone X (unshaded) · 0% chance over 30 yrs
- Wildfire 8/10 Severe
- Heat 5/10 Major 7 d/yr ≥99°F today · 16 d/yr by 30 yrs out
- Wind 1/10 Low
- Air quality 10/10 Extreme 27 unhealthy d/yr today · 32 by 30 yrs out
Nearby sold comps map
Loading sold comps map…
Walkable amenities ~0.75 mi
Loading nearby amenities…
Taxation est. · year 1
- Rental income
- $20,939
- − Mortgage interest
- −$4,201
- − Property taxes
- −$263
- − Insurance
- −$375
- − Repairs & maintenance
- −$1,675
- − Management
- −$1,675
- − Depreciation
- −$2,182
- Taxable income
- $10,567
- Est. tax owed @ 24.0%
- −$2,536
- After-tax cash flow
- $8,648/yr
For passive investors: Depreciation is non-cash, so a rental often shows a tax loss while cash-flowing — sheltering income. Rental losses are passive: they offset passive income freely, and up to $25,000/yr can offset ordinary (W-2) income if you actively participate and your MAGI is under $100k (phasing out to $0 by $150k); unused losses carry forward. On sale, claimed depreciation is recaptured at up to 25%, and gains may owe capital-gains tax (a 1031 exchange can defer both). Figures are a year-1 estimate at your 24.0% rate — not tax advice; consult a CPA.
Schools (NCES district)
- District
- Placerville Union Elementary
- NCES district ID
- 0630780
- Math proficiency
- 29% ▼ -16.00%
- Reading proficiency
- 46% ▼ -11.00%
- Median HH income
- $54,662
- Composite
- 32.8/100
- National rank
- #5626
- State rank
- #248 of 517 in CA
Livability — Placerville
- Score
- 61/100
- State rank
- #553
- US rank
- #18366
Category grades
Schools grade is shown separately in the Schools card above.
Census & demographics
- County
- El Dorado County · 144,198 people
- City population
- 36,830
- Metro
- Sacramento-Roseville-Folsom, CA
- Population (ZIP)
- 36,830
- Household income
- $89,938
- Rent vs Own
- Severe rent burden
- 1147.0
Population outlook (El Dorado County) Hauer SSP2
- Today (2025)
- 191,666 people
- By 2030
- 193,662 · +1.0%
- By 2040
- 192,583 · +0.5%
- By 2050
- 185,904 · -3.0%
- By 2075
- 169,543 · -11.5%
- By 2100
- 139,623 · -27.2%
Race, ethnicity, and origin ACS 2023
- Neighborhood character
- Predominantly White (78%)
- Race & ethnicity
- White 78% Hispanic / Latino 14% Two or more races 8% Native American 1%
- Hispanic origin (detail)
- Mexican 11%
- Common ancestry
- Italian 4% Slovak 4% Lithuanian 3%
- Foreign-born
- 6% · Canada, China
- Languages at home
- 92% English-only · Spanish 6%
Political lean MEDSL · El Dorado
- 2024 margin
- R (+12.0) · D 42.6% · R 54.6% · Other 2.8%
- 2008→2024 swing
- -1.5pp toward R · 2008: -10.5pp · 2024: -12.0pp
- All cycles
- 2024: R+12.0 2020: R+8.8 2016: R+13.9 2012: R+18.2 2008: R+10.5
Not yet ingested
- Civics
- —
Market trends
- HPI YoY
- ▼ -480.50%
- Current HPI
- 262.6014
- Rent YoY
- ▲ 12.48%
- Metro
- Sacramento-Roseville-Folsom, CA
- State GDP YoY
- ▲ 3.21%
- F500 in state
- 116
Industry mix (Fortune 500 HQ in CA)
| Industry | F500 HQs | Revenue |
|---|---|---|
| Technology | 27 | $1,492B |
|
||
| Financial Services | 3 | $174B |
|
||
| Retail | 3 | $44B |
|
||
| Insurance | 3 | $26B |
|
||
| Media / Entertainment | 2 | $115B |
|
||
| Pharmaceuticals / Biotech | 2 | $62B |
|
||
Property tax history
-0.1%/yrLatest (2023): $263 · -0.5% YoY. Source: county tax records.
Cash-flow waterfall
monthlySold comps — $/sqft
last 12 mo · ≤1 miLoading sold comps…