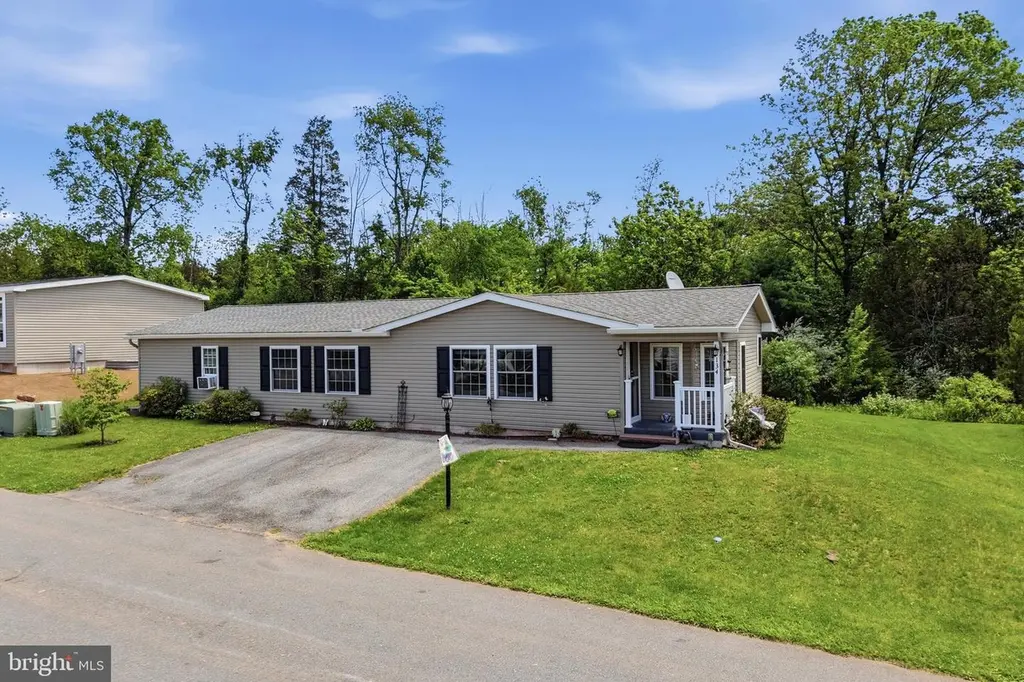
134 Heister Rd · Lorane, PA
Flood risk 1/10 · Minimal
- FEMA flood zone
- X (unshaded)
- Chance of flooding over 30 yrs
- 0.0%
- Est. flood insurance / yr
- $507 – $1,088
Fire risk 3/10 · Minor
- Est. fire insurance / yr
- $511 – $949
Heat risk 5/10 · Moderate
- Hot days now (above 100°F)
- 7 days/yr
- Hot days in 30 yrs
- 15 days/yr
Wind risk 4/10 · Minor
- Chance of severe wind over 30 yrs
- 18.0%
Air-quality risk 2/10 · Minimal
- Unhealthy air days now
- 1 days/yr
- Unhealthy air days in 30 yrs
- 3 days/yr
Risk factors via First Street. Map © Google.
Why this score? — see what drove the B- grade
The composite is a weighted blend of 9 inputs, each scored 0–100. Each bar is that input's sub-score; the figure is the points it added to the 100-point composite (weight × sub-score).
- Cash flow +30.0/30.0
- 1% rule +10.0/10.0
- DSCR +10.0/10.0
- Schools +4.5/10.0
- Livability +3.8/5.0
- ARV discount +3.0/15.0
- Rent growth +2.5/5.0
- Condition / age +2.5/5.0
- Appreciation +0.0/10.0
$145,000
🖨 Deal sheet (PDF) 📄 Offer letter ✓ Due diligence
Listing remarks MLS
Completely renovated from top to bottom! New roof siding and windows, new kitchen cabinets, flooring, granite counter tops, new paint, new bathrooms, new carpeting, new HVAC system. This home is move in condition and ready for immediate occupancy. DO NOT WAIT to see this one!
Key facts
- 4,356 sq ft lot
- 2 parking spots
- Built 1990
Property features AI
Finance
- Financial info: Annual ground rent noted
- HOA & community: Ground rent exists (land lease of $740 monthly; approximately 100 years remaining); Located in Heister Creek park
Exterior
- Parking: Paved driveway; Driveway parking for 2 vehicles; Total of 2 garage and parking spaces
- Utilities: Public water; Public sewer; Electric heating, cooling, and hot water
- Home design: Manufactured double wide (Schult model); Entry-level bedrooms; Estimated year built (effective remodel 2020)
- Construction: Vinyl siding; No basement; Shed structure
- Exterior features: Deck(s); Porch(es); Fully fenced yard; Backs to trees; Shed
Interior
- Kitchen: Built-in microwave; Built-in range; Dishwasher
- Bedrooms: Three bedrooms on the main level
- Flooring: Wood floors; Carpet
- Bathrooms: Two full bathrooms on the main level
- Heating & cooling: Forced air heating (electric); Central air conditioning (electric); Electric hot water
- Interior features: Tub with shower; Breakfast area; Combination dining and living area; Dining area; Family room off the kitchen; Kitchen eat-in; Walk-in closet(s); Wood floors; Carpet
- Laundry & utility: Main floor laundry
Neighborhood map
What this means for you Summary
Snapshot
- This is a 3-bed/2.0-bath single-family listed at $145k.
Deal economics
- At list price, monthly cash flow is $785 ($9k/yr) — positive.
- The deal already cash-flows at list — no discount required.
- Meets the 1% rule at list price ($2k rent vs $145k).
- Cap rate 12.8% vs local median 4.0% in Lorane — top-decile yield for the area; either an underpriced asset or a hidden risk that comps aren't pricing in. Stress-test before assuming the spread holds.
Location & tenants
- Location reads 75/100 on livability (#428 in PA, #3,912 nationally) — a middle-class / working-renter tenant base. Strengths: crime A+, housing A+, health & safety A+; Watch: amenities F, commute F.
- Exeter Township SD (suburban): math 41% / reading 60% proficiency, ranked #141 of 539 in PA (top 26%) — acceptable for families but not a draw, mixed tenant base, ~2y average lease.
- Zoned schools: Owatin Creek El Sch (math 42% / reading 57%, grade D, #654 of 1,518 statewide, top 47%, 551 students, 24% FRL) — zoned schools at 24% FRL track the district average.
- Market conditions: 85 active listings in the ZIP; 2 comparable units currently listed for rent nearby; 258 units permitted in Berks County in 2024 (27 in 5+ unit buildings).
Forward outlook
- Local home prices are declining (-3.0%/yr); year-one equity from $1k of loan paydown is wiped out by about $4k of value loss. Plan a longer hold.
- Berks County population projected at +3% by 2050 — modest demand growth; plan on rents tracking national, not racing it.
- At projected returns (-3.0% appreciation + 3.0% rent growth), your $41k cash investment doubles in ~6 years — after that, you're playing with house money.
Negotiation context
- Only 5 days on market — expect competitive offers; lowballing is unlikely to land.
- 6 sale attempts since 24y ago with the ask held roughly flat each time — persistent listings suggest the price (not the market) is what's stuck; bring a comps-based counter.
- Current owner paid $95k; list at $145k implies a 53% gain — meaningful room to come down on a strong offer.
Risks & watch-outs
- Climate carrying-cost: extreme-heat days projected 7→15/yr by 2055 (HVAC capex compounding) — expect insurance premiums to compound above CPI over the hold.
Questions for the listing agent
- Is there a deadline driving the sale (1031 exchange, divorce, estate, relocation)? That informs how much negotiation room exists.
- Schools are F-rated, which usually means shorter tenancies and higher turnover. Who's the typical renter profile here, and what's been the actual vacancy rate?
- What's the average days-on-market for RENTAL listings here right now (not sales)? A rising rental-DOM trend means longer vacancies and softer asking-rent achievability than the comps imply.
- What's the recent tenant-quality profile in this submarket — average credit score on applications, eviction rate, late-payment / NSF rate, and stable-employment percentage? A property-management company in the area should have these aggregated.
- How much new for-sale + rental construction is in the pipeline within 1–3 miles? Heavy new supply typically softens prices + rents 12–24 months out; constrained supply supports both.
Investment metrics
- 1% rule
- 1.57% ✓
- Cap rate
- 12.79%
- Cash-on-cash
- 23.19%
- DSCR
- 2.03
- GRM
- 5.3
CMA / ARV
- ARV (on-the-fly)
- $131,688
- Comps found
- 12
Show comp detail 12 sales within ~0.75 mi
| Address | Dist | Beds/Ba | Sqft | Sold | Price | $/sf | Match |
|---|---|---|---|---|---|---|---|
| 140 Heister Rd | 0.04mi | 3/2.0 | 1,344 (-5%) | 2mo | $100,000 | $74 | 88 |
| 114 Heister Rd | 0.07mi | 2/2.0 (-1) | 1,456 (+3%) | 2mo | $75,000 | $52 | 85 |
| 309 Hill Ln | 0.07mi | 3/2.0 | 1,344 (-5%) | 16mo | $120,000 | $89 | 76 |
| 52 Keystone Rd | 0.43mi | 3/2.0 | 1,456 (+3%) | 8mo | $130,000 | $89 | 69 |
| 122 Ritz Ave | 0.39mi | 3/2.0 | 1,456 (+3%) | 10mo | $127,500 | $88 | 69 |
| 510 Caravelle Ln | 0.45mi | 3/2.0 | 1,456 (+3%) | 10mo | $136,000 | $93 | 66 |
| 124 Fairmount Ave | 0.30mi | 3/1.5 | 1,580 (+12%) | 3mo | $321,000 | $203 | 62 |
| 419 Allenbrook Ln | 0.48mi | 3/2.0 | 1,344 (-5%) | 12mo | $125,500 | $93 | 59 |
| 100 Lincoln Dr | 0.37mi | 3/2.0 | 1,232 (-13%) | 8mo | $314,900 | $256 | 55 |
| 148 Fairmount Ave | 0.29mi | 3/1.0 | 1,568 (+11%) | 15mo | $325,000 | $207 | 52 |
| 36 Keystone Rd | 0.38mi | 3/2.0 | 1,232 (-13%) | 11mo | $129,900 | $105 | 51 |
| 1377 Claire Dr | 0.70mi | 3/1.0 | 1,276 (-10%) | 11mo | $274,000 | $215 | 38 |
Match score weights: distance 35% · size 25% · config 20% · recency 20%. Top-matched comps best support the ARV.
Projected returns pro-forma
-3.0% appreciation · 3.0% rent growth · sell at horizon
- IRR
- 16.2%
- Equity multiple
- 1.65×
- Total profit
- $26,527
- Equity at exit
- $21,620
- IRR
- 24.8%
- Equity multiple
- 3.16×
- Total profit
- $87,636
- Equity at exit
- $12,537
Cash invested: $40,600 (down + closing). Projections, not guarantees.
Landlord ↔ Tenant lean methodology
- Overall (STATE)
- 62 Landlord-Friendly
- State Pennsylvania
- 62 Landlord-Friendly · EVEN
- County
- — inherits STATE
- City
- — inherits STATE
ZIP-level market 19508
- Home prices YoY
- -25.6%
- Active inventory
- 85
- Price-to-rent
- 5.3×
Monthly cashflow live
- Estimated rent
- $2,283 medium interval (Pro) →
- Mortgage (P&I)
- −$760
- Tax from tax record
- −$198 /mo · $2,374/yr
- Insurance
- −$60
- HOA
- −$0
- Vacancy / Maint / Mgmt
- −$479
- Net cashflow
- $785
Break-even live
Sensitivity live
| Price | -10% $867 | -5% $826 | +0% $785 | +5% $744 | +10% $703 |
|---|---|---|---|---|---|
| Rent | -10% $604 | -5% $695 | +0% $785 | +5% $875 | +10% $965 |
| Rate | -1.0pp $858 | -0.5pp $822 | base $785 | +0.5pp $747 | +1.0pp $709 |
UW: 25.0% down · 7.5% · 30yr · 1.5% tax · 5.0% vac · 8.0% maint · 8.0% mgmt
Financing live
Cash to close
- Down payment
- $36,250
- Closing costs
- $4,350
- Reserves months
- —
- Total cash needed
- —
Loan-product check · same deal, 3 products live
Conventional
25% down · 7.5% · 30yr
- Down + closing
- —
- Monthly P&I
- —
- Monthly cashflow
- —
- DSCR
- —
- Eligible?
- —
Personal DTI + credit; lowest rate.
DSCR
20% down · 8.5% · 30yr
- Down + closing
- —
- Monthly P&I
- —
- Monthly cashflow
- —
- DSCR
- —
- Eligible?
- —
No personal income docs; deal must DSCR.
Hard money
10% down · 12.0% · 12mo
- Down + closing
- —
- Monthly P&I
- —
- Monthly cashflow
- —
- DSCR
- —
- Eligible?
- —
Short-term bridge; refi at stabilization.
Rent comps 2 comps
| Address | Beds | Baths | Sqft | Rent | $/sqft | DOM | Units | Dist |
|---|---|---|---|---|---|---|---|---|
| 97 Wessex Ct Unit 97 Reading, PA | 3.0 | 3.0 | 1473 | $2,200 | $1.49 | 45d | 1 | 0.96mi |
| 1251 Buddies Pl Birdsboro, PA | 3.0 | 2.0 | 1040 | $2,400 | $2.31 | 14d | 1 | 1.04mi |
Listing history 6 events
-
2026-06-13status $145,000 Pending 5 DOM
-
2026-06-10days on market $145,000 Active 5 DOM
-
2026-06-09days on market $145,000 Active 4 DOM
-
2026-06-08days on market $145,000 Active 3 DOM
-
2026-06-07remarks 699-char remark
-
2026-06-07$145,000 Active 2 DOM
ⓘ Source: listings_history table (triggers on properties + properties_extension) + one-shot
backfill from property_details.listing_events for pre-trigger history.
Tax reassessment forecast PA · Partial reset (capped growth)
- Current annual tax
- $2,374 · $198/mo
- Projected year-2 tax
- $2,374 · $198/mo
- Expected delta
- $0/yr ($0/mo · 0.0%)
ⓘ Screening estimate from a state-policy table — verify with the county assessor before closing.
Climate risk First Street
- Flood 1/10 Low FEMA zone X (unshaded) · 0% chance over 30 yrs
- Wildfire 3/10 Moderate
- Heat 5/10 Major 7 d/yr ≥100°F today · 15 d/yr by 30 yrs out
- Wind 4/10 Moderate 18% chance of damaging wind over 30 yrs
- Air quality 2/10 Low 1 unhealthy d/yr today · 3 by 30 yrs out
Nearby sold comps map
Loading sold comps map…
Walkable amenities ~0.75 mi
Loading nearby amenities…
Taxation est. · year 1
- Rental income
- $27,393
- − Mortgage interest
- −$8,122
- − Property taxes
- −$2,374
- − Insurance
- −$725
- − Repairs & maintenance
- −$2,191
- − Management
- −$2,191
- − Depreciation
- −$4,218
- Taxable income
- $7,570
- Est. tax owed @ 24.0%
- −$1,817
- After-tax cash flow
- $7,600/yr
For passive investors: Depreciation is non-cash, so a rental often shows a tax loss while cash-flowing — sheltering income. Rental losses are passive: they offset passive income freely, and up to $25,000/yr can offset ordinary (W-2) income if you actively participate and your MAGI is under $100k (phasing out to $0 by $150k); unused losses carry forward. On sale, claimed depreciation is recaptured at up to 25%, and gains may owe capital-gains tax (a 1031 exchange can defer both). Figures are a year-1 estimate at your 24.0% rate — not tax advice; consult a CPA.
Schools (NCES district)
- District
- Exeter Township SD
- NCES district ID
- 4209480
- Math proficiency
- 41% ▼ -8.00%
- Reading proficiency
- 60% ▼ -11.00%
- Median HH income
- $71,744
- Composite
- 45.21/100
- National rank
- #2669
- State rank
- #141 of 539 in PA
Livability — Lorane
- Score
- 75/100
- State rank
- #428
- US rank
- #3912
Category grades
Schools grade is shown separately in the Schools card above.
Census & demographics
- Population (ZIP)
- 15,066
Population outlook (Berks County) Hauer SSP2
- Today (2025)
- 425,767 people
- By 2030
- 428,814 · +0.7%
- By 2040
- 433,463 · +1.8%
- By 2050
- 439,426 · +3.2%
- By 2075
- 478,647 · +12.4%
- By 2100
- 518,507 · +21.8%
Race, ethnicity, and origin ACS 2023
- Neighborhood character
- Predominantly White (90%)
- Race & ethnicity
- White 90% Two or more races 6% Hispanic / Latino 3% Black 1%
- Common ancestry
- Romanian 6% Iranian 3% Lithuanian 2%
- Foreign-born
- 1% · Canada
- Languages at home
- 98% English-only · Spanish 1% Other Indo-European 1%
Political lean MEDSL · Berks
- 2024 margin
- R (+12.2) · D 43.4% · R 55.6%
- 2008→2024 swing
- -21.4pp toward R · 2008: 9.2pp · 2024: -12.2pp
- All cycles
- 2024: R+12.2 2020: R+8.2 2016: R+10.2 2012: R+0.6 2008: D+9.2
Not yet ingested
- Civics
- —
Market trends
- HPI YoY
- ▼ -94.00%
- Current HPI
- 273.8199
- Rent YoY
- —
- Metro
- —
- State GDP YoY
- ▲ 1.68%
- F500 in state
- 34
Industry mix (Fortune 500 HQ in PA)
| Industry | F500 HQs | Revenue |
|---|---|---|
| Healthcare | 2 | $309B |
|
||
| Insurance | 2 | $27B |
|
||
| Telecommunications / Media | 1 | $124B |
|
||
| Industrial Distribution | 1 | $22B |
|
||
| Financial Services | 1 | $20B |
|
||
| Chemicals / Materials | 1 | $18B |
|
||
Price history
+83.8% since first listed14 events — show timeline
- 2026-06-06 Listed $145,000 BRIGHT MLS
- 2026-06-04 Coming Soon $145,000 BRIGHT MLS
- 2020-07-28 Sold (MLS) $95,000 BRIGHT MLS
- 2020-06-25 Contingent — BRIGHT MLS
- 2020-06-18 Listed $97,900 BRIGHT MLS
- 2010-10-20 Sold (MLS) $51,900 TREND
- 2010-10-20 Sold (MLS) $51,900 BRIGHT MLS
- 2010-09-21 Listing Removed — BRIGHT MLS
- 2010-07-01 Listed $59,900 TREND
- 2010-07-01 Listed $59,900 BRIGHT MLS
- 2003-12-04 Listing Removed — BRIGHT MLS
- 2003-06-16 Listed $74,000 BRIGHT MLS
- 2003-01-14 Listing Removed — BRIGHT MLS
- 2002-10-14 Listed $78,900 BRIGHT MLS
Property tax history
+1.5%/yrLatest (2026): $2,374 · +0.5% YoY. Source: county tax records.
Cash-flow waterfall
monthlySold comps — $/sqft
last 12 mo · ≤1 miLoading sold comps…