2902 Brookwood Ave · Gulfport, MS
Flood risk 6/10 · Moderate
- FEMA flood zone
- X (shaded)
- Chance of flooding over 30 yrs
- 0.73%
- Est. flood insurance / yr
- $507 – $1,088
Fire risk 2/10 · Minimal
- Est. fire insurance / yr
- $1,241 – $2,305
Heat risk 10/10 · Severe
- Hot days now (above 106°F)
- 7 days/yr
- Hot days in 30 yrs
- 21 days/yr
Wind risk 9/10 · Severe
- Chance of severe wind over 30 yrs
- 99.0%
Air-quality risk 1/10 · Minimal
- Unhealthy air days now
- 0 days/yr
- Unhealthy air days in 30 yrs
- 0 days/yr
Risk factors via First Street. Map © Google.
Why this score? — see what drove the B+ grade
The composite is a weighted blend of 9 inputs, each scored 0–100. Each bar is that input's sub-score; the figure is the points it added to the 100-point composite (weight × sub-score).
- Cash flow +30.0/30.0
- ARV discount +15.0/15.0
- 1% rule +10.0/10.0
- DSCR +10.0/10.0
- Rent growth +5.0/5.0
- Livability +3.7/5.0
- Schools +3.4/10.0
- Condition / age +2.5/5.0
- Appreciation +0.0/10.0
$75,000
🖨 Deal sheet 📄 Offer letter ✓ Due diligence
Listing remarks
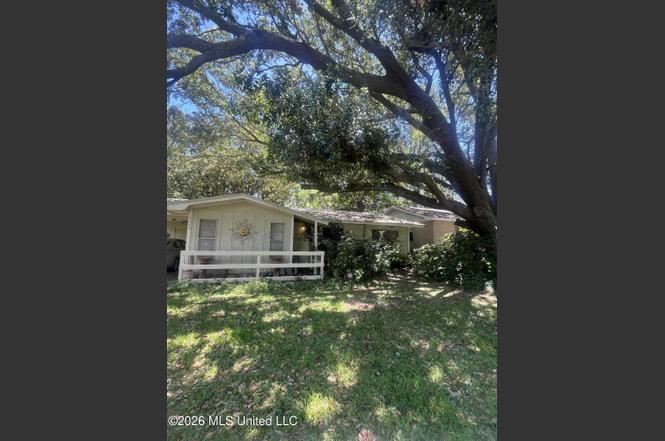
Opportunity awaits with this 3-bedroom, 1-bath home located in an established neighborhood in the heart of Gulfport! Being sold as-is, this property offers solid bones and endless potential for the right buyer. With a little TLC, creativity, and elbow grease, this home can be transformed into a true gem. Conveniently located near the Naval Construction Battalion Center, Memorial Hospital, Gulfport's white sandy beaches, Island View Casino, the Mississippi Aquarium, TrainTastic, local restaurants, Gulfport Harbor, and Ship Island Excursions, you'll enjoy easy access to some of the area's most popular attractions and amenities. Whether you're an investor, first-time buyer looking for a projec
Key facts
- Near traintastic
- 6,969 sq ft lot
- 3 parking spots
Tags
Property features AI
Finance
- HOA & community: Community amenities include fishing, fitness center, hiking/walking trails, marina, nearby entertainment, restaurants, sports fields, and tennis courts
Exterior
- Parking: Attached covered carport (1 car); Driveway parking; Concrete surfaces; Total parking for 3 vehicles
- Utilities: Public water; Public sewer; Electricity connected; Cable available; Phone available; Sewer connected; Water connected
- Home design: Single family residence (house); One level
- Construction: HardiPlank-type siding; Metal roof; Slab foundation; Built in public records (year built source: Public Records)
- Exterior features: Enclosed, screened rear porch; Private yard; Back yard fencing; Near beach; City lot
Interior
- Kitchen: Free-standing gas oven; Free-standing refrigerator
- Flooring: Carpet; Linoleum
- Bathrooms: 1 full bathroom
- Heating & cooling: Heat pump with propane; Electric cooling; Ceiling fan(s)
- Interior features: Ceiling fan(s); Eat-in kitchen; Laminate counters; Pantry; Dead bolt lock(s)
Neighborhood map
What this means for you Summary
Snapshot
- This is a 3-bed/1.0-bath single-family listed at $75k.
Deal economics
- At list price, monthly cash flow is $488 ($6k/yr) — positive.
- The deal already cash-flows at list — no discount required.
- Meets the 1% rule at list price ($1k rent vs $75k).
- Cap rate 14.1% vs local median 4.9% in Gulfport — top-decile yield for the area; either an underpriced asset or a hidden risk that comps aren't pricing in. Stress-test before assuming the spread holds.
Location & tenants
- Location reads 73/100 on livability (#15 in MS) — a middle-class / working-renter tenant base. Strengths: cost of living A+, housing A+, health & safety A+; Watch: schools D, amenities F, commute F.
- Gulfport School District (urban): math 41% / reading 42% proficiency, ranked #37 of 130 in MS (top 28%) — families likely to look elsewhere, expect single-tenant / working-renter base with shorter leases; 67% free/reduced lunch — lower-income household profile, screen leases tightly.
- Market conditions: Rents rising fast (+10.5%/yr); 252 active listings in the ZIP; 21 comparable units currently listed for rent nearby; rentals lingering (median 44d on market — plan ~5-8 weeks vacancy on turnover, expect pricing pressure); 62% of comp listings sitting > 30 days — soft ceiling on asking rent; lower-income renter base — watch delinquency; 2,194 units permitted in Harrison County in 2024 (0 in 5+ unit buildings).
- This rent runs 42% of the median local income ($35k/yr) — at the standard rent-burdened threshold; future hikes will face affordability resistance.
Forward outlook
- Local home prices are declining (-3.0%/yr); year-one equity from $519 of loan paydown is wiped out by about $2k of value loss. Plan a longer hold.
- Harrison County population projected at +27% by 2050 — long-run rental-demand tailwind backs the buy-and-hold thesis.
- At projected returns (-3.0% appreciation + 8.0% rent growth), your $21k cash investment doubles in ~4 years — after that, you're playing with house money.
Negotiation context
- Only 7 days on market — expect competitive offers; lowballing is unlikely to land.
Risks & watch-outs
- Climate carrying-cost: major flood risk; severe wind risk, 99% chance of damaging wind over 30y; extreme-heat days projected 7→21/yr by 2055 (HVAC capex compounding) — expect insurance premiums to compound above CPI over the hold.
Questions for the listing agent
- Built in 1965 — when were the roof, HVAC, electrical panel, plumbing, and water heater last replaced?
- Is there a deadline driving the sale (1031 exchange, divorce, estate, relocation)? That informs how much negotiation room exists.
- Schools are D-rated, which usually means shorter tenancies and higher turnover. Who's the typical renter profile here, and what's been the actual vacancy rate?
- What's the average days-on-market for RENTAL listings here right now (not sales)? A rising rental-DOM trend means longer vacancies and softer asking-rent achievability than the comps imply.
- What's the recent tenant-quality profile in this submarket — average credit score on applications, eviction rate, late-payment / NSF rate, and stable-employment percentage? A property-management company in the area should have these aggregated.
- How much new for-sale + rental construction is in the pipeline within 1–3 miles? Heavy new supply typically softens prices + rents 12–24 months out; constrained supply supports both.
Investment metrics
- 1% rule
- 1.62% ✓
- Cap rate
- 14.10%
- Cash-on-cash
- 27.87%
- DSCR
- 2.24
- GRM
- 5.1
CMA / ARV
- ARV (on-the-fly)
- $104,544
- Comps found
- 12
Show comp detail 12 sales within ~0.75 mi
| Address | Dist | Beds/Ba | Sqft | Sold | Price | $/sf | Match |
|---|---|---|---|---|---|---|---|
| 1305 29th St | 0.04mi | 3/1.0 | 1,118 (+6%) | 6mo | $136,000 | $122 | 83 |
| 2905 Audubon Dr | 0.05mi | 3/1.0 | 949 (-10%) | 1mo | $84,000 | $89 | 80 |
| 2705 Kelly Ave | 0.29mi | 3/2.0 | 1,000 (-5%) | 3mo | $125,000 | $125 | 72 |
| 1021 27th St | 0.41mi | 2/1.0 (-1) | 1,000 (-5%) | 4mo | $142,500 | $143 | 63 |
| 1503 25th St | 0.44mi | 3/1.0 | 1,150 (+9%) | 3mo | $85,000 | $74 | 62 |
| 1233 25th St | 0.39mi | 3/1.5 | 1,144 (+8%) | 7mo | $98,000 | $86 | 60 |
| 2409 Joan Ave | 0.40mi | 3/1.5 | 1,132 (+7%) | 10mo | $49,500 | $44 | 59 |
| 2509 6th Ave | 0.60mi | 3/1.5 | 1,100 (+4%) | 8mo | $145,500 | $132 | 56 |
| 807 27th St | 0.68mi | 2/1.0 (-1) | 1,028 (-3%) | 4mo | $102,000 | $99 | 56 |
| 2515 East Ave | 0.51mi | 2/1.0 (-1) | 972 (-8%) | 7mo | $98,500 | $101 | 52 |
| 2524 18th Ave | 0.50mi | 2/1.0 (-1) | 936 (-11%) | 10mo | $89,999 | $96 | 44 |
| 718 Tennessee St | 0.74mi | 2/1.0 (-1) | 945 (-10%) | 10mo | $39,000 | $41 | 34 |
Match score weights: distance 35% · size 25% · config 20% · recency 20%. Top-matched comps best support the ARV.
Projected returns pro-forma
-3.0% appreciation · 8.0% rent growth · sell at horizon
- IRR
- 27.3%
- Equity multiple
- 2.21×
- Total profit
- $25,315
- Equity at exit
- $11,183
- IRR
- 37.6%
- Equity multiple
- 5.34×
- Total profit
- $91,207
- Equity at exit
- $6,485
Cash invested: $21,000 (down + closing). Projections, not guarantees.
Landlord ↔ Tenant lean methodology
- Overall (STATE)
- 90 Strongly Landlord-Friendly
- State Mississippi
- 90 Strongly Landlord-Friendly · R+11
- County
- — inherits STATE
- City
- — inherits STATE
ZIP-level market 39501
- Home prices YoY
- -34.5%
- Rents YoY
- 10.5%
- Active inventory
- 252
- Price-to-rent
- 5.1×
Monthly cashflow live
- Estimated rent
- $1,214 high interval (Pro) →
- Mortgage (P&I)
- −$393
- Tax from tax record
- −$47 /mo · $566/yr
- Insurance
- −$31
- HOA
- −$0
- Vacancy / Maint / Mgmt
- −$255
- Net cashflow
- $488
Break-even live
UW: 25.0% down · 7.5% · 30yr · 1.5% tax · 5.0% vac · 8.0% maint · 8.0% mgmt
Financing live
Cash to close
- Down payment
- $18,750
- Closing costs
- $2,250
- Reserves months
- —
- Total cash needed
- —
Loan-product check · same deal, 3 products live
Conventional
25% down · 7.5% · 30yr
- Down + closing
- —
- Monthly P&I
- —
- Monthly cashflow
- —
- DSCR
- —
- Eligible?
- —
Personal DTI + credit; lowest rate.
DSCR
20% down · 8.5% · 30yr
- Down + closing
- —
- Monthly P&I
- —
- Monthly cashflow
- —
- DSCR
- —
- Eligible?
- —
No personal income docs; deal must DSCR.
Hard money
10% down · 12.0% · 12mo
- Down + closing
- —
- Monthly P&I
- —
- Monthly cashflow
- —
- DSCR
- —
- Eligible?
- —
Short-term bridge; refi at stabilization.
Rent comps 21 comps
| Address | Beds | Baths | Sqft | Rent | $/sqft | DOM | Units | Dist |
|---|---|---|---|---|---|---|---|---|
| 1224 29th St Gulfport, MS | 2.0 | 2.0 | 1050 | $1,155 | $1.10 | 13d | 1 | 0.16mi |
| 1400 28th St Gulfport, MS | 2.0–3.0 | 2.0 | 1101 | $1,085 | $0.99 | 13d | 1 | 0.19mi |
| 3333 12th Ave Gulfport, MS | 2.0 | 2.0 | 1000 | $899 | $0.90 | 43d | 1 | 0.33mi |
| 3333 12th Ave Unit 6 Gulfport, MS | 2.0 | 2.5 | 1000 | $899 | $0.90 | 43d | 1 | 0.33mi |
| 2414 15th Ave Gulfport, MS | 2.0 | 1.0 | 818 | $1,000 | $1.22 | 43d | 1 | 0.49mi |
| 2823 6th Ave Unit A Gulfport, MS | 3.0 | 2.0 | 1100 | $1,100 | $1.00 | 21d | 1 | 0.51mi |
| 2706 6th Ave Gulfport, MS | 3.0 | 2.0 | 1217 | $1,300 | $1.07 | 21d | 1 | 0.53mi |
| 2227 17th Ave Gulfport, MS | 2.0 | 1.0 | 1000 | $850 | $0.85 | 43d | 1 | 0.69mi |
| 2207 16th Ave Gulfport, MS | 2.0 | 1.0 | 1325 | $1,425 | $1.08 | 13d | 1 | 0.70mi |
| 2311 5th Ave Gulfport, MS | 3.0 | 1.5 | 1100 | $1,300 | $1.18 | 43d | 1 | 0.72mi |
| 2313 5th Ave Gulfport, MS | 2.0 | 1.0 | 750 | $1,000 | $1.33 | 43d | 1 | 0.72mi |
| 2110 30th St Gulfport, MS | 2.0 | 2.0 | 950 | $950 | $1.00 | 21d | 1 | 0.73mi |
| 941 22nd St Gulfport, MS | 3.0 | 2.0 | 1450 | $1,600 | $1.10 | 13d | 1 | 0.74mi |
| 2233 5th Ave Gulfport, MS | 3.0 | 1.0 | 1215 | $1,300 | $1.07 | 43d | 1 | 0.75mi |
| 832 24th St Gulfport, MS | 2.0 | 1.0 | 800 | $950 | $1.19 | 43d | 1 | 0.75mi |
| 1605 20th St Gulfport, MS | 3.0 | 3.0 | 1350 | $1,095 | $0.81 | 43d | 1 | 0.80mi |
| 2317 30th St Gulfport, MS | 2.0 | 1.0 | 1164 | $2,150 | $1.85 | 21d | 1 | 0.91mi |
| 1511 2nd St Gulfport, MS | 3.0 | 1.5 | 1030 | $2,000 | $1.94 | 43d | 1 | 0.99mi |
| 1822 15th St Gulfport, MS | 2.0 | 2.0 | 1100 | $1,900 | $1.73 | 43d | 1 | 1.25mi |
| 3209 F Ave Gulfport, MS | 2.0 | 1.0 | 1000 | $850 | $0.85 | 43d | 1 | 1.27mi |
| 124 30th 1/2 St Gulfport, MS | 2.0 | 1.5 | 1007 | $1,100 | $1.09 | 43d | 1 | 1.31mi |
Listing history 7 events
-
2026-06-18days on market $75,000 Active 7 DOM
-
2026-06-17days on market $75,000 Active 6 DOM
-
2026-06-16days on market $75,000 Active 5 DOM
-
2026-06-15days on market $75,000 Active 4 DOM
-
2026-06-14days on market $75,000 Active 2 DOM
-
2026-06-13remarks 699-char remark
-
2026-06-13$75,000 Active 1 DOM
ⓘ Source: listings_history table (triggers on properties + properties_extension) + one-shot
backfill from property_details.listing_events for pre-trigger history.
Tax reassessment forecast MS · Resets to sale price
- Current annual tax
- $566 · $47/mo
- Projected year-2 tax
- $593 · $49/mo
- Expected delta
- +$27/yr (+$2/mo · 4.8%)
ⓘ Screening estimate from a state-policy table — verify with the county assessor before closing.
Climate risk First Street
- Flood 6/10 Major FEMA zone X (shaded) · 73% chance over 30 yrs
- Wildfire 2/10 Low
- Heat 10/10 Extreme 7 d/yr ≥106°F today · 21 d/yr by 30 yrs out
- Wind 9/10 Extreme 99% chance of damaging wind over 30 yrs
- Air quality 1/10 Low 0 unhealthy d/yr today · 0 by 30 yrs out
Nearby sold comps map
Loading sold comps map…
Walkable amenities ~0.75 mi
Loading nearby amenities…
Taxation est. · year 1
- Rental income
- $14,573
- − Mortgage interest
- −$4,201
- − Property taxes
- −$566
- − Insurance
- −$375
- − Repairs & maintenance
- −$1,166
- − Management
- −$1,166
- − Depreciation
- −$2,182
- Taxable income
- $4,917
- Est. tax owed @ 24.0%
- −$1,180
- After-tax cash flow
- $4,672/yr
For passive investors: Depreciation is non-cash, so a rental often shows a tax loss while cash-flowing — sheltering income. Rental losses are passive: they offset passive income freely, and up to $25,000/yr can offset ordinary (W-2) income if you actively participate and your MAGI is under $100k (phasing out to $0 by $150k); unused losses carry forward. On sale, claimed depreciation is recaptured at up to 25%, and gains may owe capital-gains tax (a 1031 exchange can defer both). Figures are a year-1 estimate at your 24.0% rate — not tax advice; consult a CPA.
Schools (NCES district)
- District
- Gulfport School District
- NCES district ID
- 2801710
- Math proficiency
- 41% ▼ -15.00%
- Reading proficiency
- 42% ▼ -6.00%
- Median HH income
- $35,712
- Composite
- 34.38/100
- National rank
- #5213
- State rank
- #37 of 130 in MS
Livability — Gulfport
- Score
- 73/100
- State rank
- #15
- US rank
- #5010
Category grades
Schools grade is shown separately in the Schools card above.
Census & demographics
- Census place
- Gulfport, MS
- County
- Harrison County · 178,171 people
- City population
- 96,188
- Metro
- Gulfport-Biloxi, MS
- Population (ZIP)
- 22,565
- Household income
- $34,758
- Rent vs Own
- Severe rent burden
- 1516.0
Population outlook (Harrison County) Hauer SSP2
- Today (2025)
- 228,444 people
- By 2030
- 241,942 · +5.9%
- By 2040
- 267,531 · +17.1%
- By 2050
- 291,062 · +27.4%
- By 2075
- 346,711 · +51.8%
- By 2100
- 378,165 · +65.5%
Race, ethnicity, and origin ACS 2023
- Neighborhood character
- Diverse neighborhood (Simpson 0.56)
- Race & ethnicity
- Black 59% White 29% Two or more races 7% Hispanic / Latino 5%
- Hispanic origin (detail)
- Mexican 2%
- Common ancestry
- Lithuanian 2% Serbian 1% Slovak 1%
- Foreign-born
- 2% · Canada
- Languages at home
- 95% English-only · Spanish 4%
Political lean MEDSL · Harrison
- 2024 margin
- Strong R (+28.9) · D 35.0% · R 63.9% · Other 1.1%
- 2008→2024 swing
- -2.9pp toward R · 2008: -26.0pp · 2024: -28.9pp
- All cycles
- 2024: R+28.9 2020: R+25.2 2016: R+30.7 2012: R+26.6 2008: R+26.0
Not yet ingested
- Civics
- —
Market trends
- HPI YoY
- ▼ -110.16%
- Current HPI
- 208.998
- Rent YoY
- ▲ 10.49%
- Metro
- Gulfport-Biloxi, MS
- State GDP YoY
- —
- F500 in state
- 0
Price history
1 event — show timeline
- 2026-06-11 Listed $75,000 MLSU
Property tax history
-35.0%/yrLatest (2024): $566 · -35.0% YoY. Source: county tax records.
Cash-flow waterfall
monthlySold comps — $/sqft
last 12 mo · ≤1 miLoading sold comps…