 Duplex
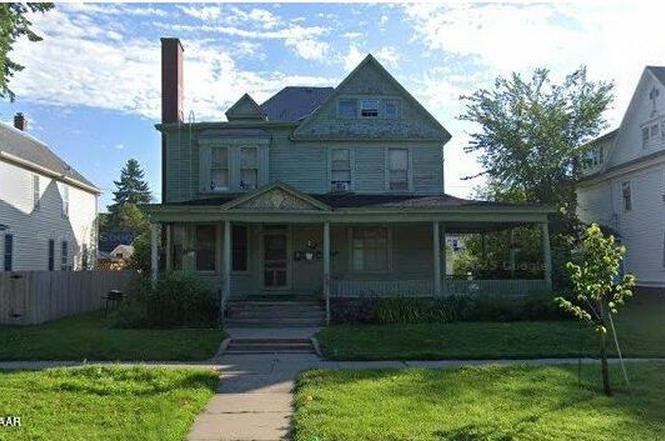
515 S 5th St · Grand Forks, ND
Flood risk No data
- FEMA flood zone
- —
- Chance of flooding over 30 yrs
- —
- Est. flood insurance / yr
- —
Fire risk No data
- Est. fire insurance / yr
- —
Heat risk 2/10 · Minimal
- Hot days now (above threshold)
- 7 days/yr
- Hot days in 30 yrs
- 12 days/yr
Wind risk No data
- Chance of severe wind over 30 yrs
- —
Air-quality risk 4/10 · Minor
- Unhealthy air days now
- 4 days/yr
- Unhealthy air days in 30 yrs
- 4 days/yr
Risk factors via First Street. Map © Google.
Why this score? — see what drove the B+ grade
The composite is a weighted blend of 9 inputs, each scored 0–100. Each bar is that input's sub-score; the figure is the points it added to the 100-point composite (weight × sub-score).
- Cash flow +30.0/30.0
- ARV discount +15.0/15.0
- DSCR +10.0/10.0
- 1% rule +9.6/10.0
- Rent growth +4.8/5.0
- Livability +3.9/5.0
- Schools +3.6/10.0
- Condition / age +2.5/5.0
- Appreciation +0.0/10.0
$242,000
🖨 Deal sheet (PDF) 📄 Offer letter ✓ Due diligence
Multi-family units
County records classify this as Multi-Family (5+ Unit). Listing-text estimate: 2 units. estimate disagrees with records
5+ unit building — per-unit beds/baths from public records are typically unavailable; the breakdown below (if shown) is an estimate from the listing text.
Key facts
- 0.24 acre lot
- Built 1898
- Listed 8 days
Property features AI
Finance
- Financial info: Annual tax amount reported
Exterior
- Parking: Off-street parking available
- Home design: House (multi-family); Total finished area above grade about 2,234
- Construction: Structure type: House
- Exterior features: Off-street parking; Approximately 10,500 sq ft lot (0.24 acre); Zoned R-3 for medium-density multi-family
Interior
- Interior features: Multi-family residential layout
Neighborhood map
What this means for you Summary
Snapshot
- This is a 2 × 3-bed/?-bath units multifamily listed at $242k.
Deal economics
- At list price, monthly cash flow is $1k ($13k/yr) — positive. Per door: $533/mo.
- The deal already cash-flows at list — no discount required.
- Meets the 1% rule at list price ($4k rent vs $242k).
- Cap rate 11.6% vs local median 2.2% in Grand Forks — top-decile yield for the area; either an underpriced asset or a hidden risk that comps aren't pricing in. Stress-test before assuming the spread holds.
Location & tenants
- Location reads 78/100 on livability (#8 in ND, #2,645 nationally) — a middle-class / working-renter tenant base. Strengths: cost of living A+, housing A+, health & safety A+; Watch: employment C-, crime D+.
- Grand Forks 1 (urban): math 37% / reading 49% proficiency, ranked #27 of 53 in ND (top 51%) — families likely to look elsewhere, expect single-tenant / working-renter base with shorter leases.
- Market conditions: Rents rising fast (+9.3%/yr); 284 active listings in the ZIP; 133 units permitted in Grand Forks County in 2024 (0 in 5+ unit buildings).
- At $3,535/mo this rent would consume 62% of the median local household income ($68k/yr) (locally 2110% of renters already pay >50% of income on rent) — very limited rent-growth headroom before tenants either downsize or default.
Forward outlook
- Local home prices are declining (-3.0%/yr); year-one equity from $2k of loan paydown is wiped out by about $7k of value loss. Plan a longer hold.
- Grand Forks County population projected at +43% by 2050 — long-run rental-demand tailwind backs the buy-and-hold thesis.
- At projected returns (-3.0% appreciation + 8.0% rent growth), your $68k cash investment doubles in ~6 years — after that, you're playing with house money.
Negotiation context
- Only 9 days on market — expect competitive offers; lowballing is unlikely to land.
Risks & watch-outs
- Watch-outs: built in 1898 — expect roof / HVAC / electrical / plumbing capex.
Questions for the listing agent
- Can we see the unit-by-unit rent roll, current vacancy, and any below-market leases? What's the average tenancy length?
- What capital expenditures (roof, boiler, parking lot, exteriors) have been made in the last 5 years, and what's planned in the next 2?
- Built in 1898 — when were the roof, HVAC, electrical panel, plumbing, and water heater last replaced?
- Is there a deadline driving the sale (1031 exchange, divorce, estate, relocation)? That informs how much negotiation room exists.
- Schools are B-rated — typically a magnet for longer-tenancy family renters. What's the average tenant stay here, and is there a school-zone premium baked into asking?
- Crime grade is D in this area — have there been break-ins, vandalism, or insurance claims at this property in the last 3 years? What carrier currently insures it and at what premium?
- What's the average days-on-market for RENTAL listings here right now (not sales)? A rising rental-DOM trend means longer vacancies and softer asking-rent achievability than the comps imply.
- What's the recent tenant-quality profile in this submarket — average credit score on applications, eviction rate, late-payment / NSF rate, and stable-employment percentage? A property-management company in the area should have these aggregated.
- How much new apartment / multifamily construction is in the pipeline within 1–3 miles? Heavy new supply (>2% of stock underway) typically softens rents 12–24 months out; light construction supports rent growth.
Investment metrics
- 1% rule
- 1.46% ✓
- Cap rate
- 11.58%
- Cash-on-cash
- 18.88%
- DSCR
- 1.84
- GRM
- 5.7
CMA / ARV
- ARV (on-the-fly)
- $341,460
- Comps found
- 1
Show comp detail 1 sale within ~0.75 mi
| Address | Dist | Beds/Ba | Sqft | Sold | Price | $/sf | Match |
|---|---|---|---|---|---|---|---|
| 608 Belmont Rd | 0.32mi | 5/6.0 (-1) | 3,314 (-13%) | 21mo | $299,900 | $90 | 38 |
Match score weights: distance 35% · size 25% · config 20% · recency 20%. Top-matched comps best support the ARV.
Projected returns pro-forma
-3.0% appreciation · 8.0% rent growth · sell at horizon
- IRR
- 16.4%
- Equity multiple
- 1.70×
- Total profit
- $47,470
- Equity at exit
- $36,083
- IRR
- 28.4%
- Equity multiple
- 4.16×
- Total profit
- $214,169
- Equity at exit
- $20,924
Cash invested: $67,760 (down + closing). Projections, not guarantees.
Landlord ↔ Tenant lean methodology
- Overall (STATE)
- 82 Strongly Landlord-Friendly
- State North Dakota
- 82 Strongly Landlord-Friendly · R+20
- County
- — inherits STATE
- City
- — inherits STATE
ZIP-level market 58201
- Rents YoY
- 9.3%
- Active inventory
- 284
- Price-to-rent
- 11.4×
Monthly cashflow live
- Estimated rent
- $3,535 medium interval (Pro) →
- Mortgage (P&I)
- −$1,269
- Tax from tax record
- −$356 /mo · $4,277/yr
- Insurance
- −$101
- HOA
- −$0
- Vacancy / Maint / Mgmt
- −$742
- Net cashflow
- $1,066
Break-even live
Sensitivity live
| Price | -10% $1,203 | -5% $1,135 | +0% $1,066 | +5% $998 | +10% $929 |
|---|---|---|---|---|---|
| Rent | -10% $787 | -5% $927 | +0% $1,066 | +5% $1,206 | +10% $1,346 |
| Rate | -1.0pp $1,188 | -0.5pp $1,128 | base $1,066 | +0.5pp $1,004 | +1.0pp $940 |
2-unit breakdown (identical units grouped — click to expand)
| Units | Beds | Baths | Est. rent |
|---|---|---|---|
| 2× units | 3 | — | $3,536 |
| #1 | 3 | — | $1,768 |
| #2 | 3 | — | $1,768 |
| Total (2 units) | $3,535 | ||
UW: 25.0% down · 7.5% · 30yr · 1.5% tax · 5.0% vac · 8.0% maint · 8.0% mgmt
Financing live
Cash to close
- Down payment
- $60,500
- Closing costs
- $7,260
- Reserves months
- —
- Total cash needed
- —
Loan-product check · same deal, 3 products live
Conventional
25% down · 7.5% · 30yr
- Down + closing
- —
- Monthly P&I
- —
- Monthly cashflow
- —
- DSCR
- —
- Eligible?
- —
Personal DTI + credit; lowest rate.
DSCR
20% down · 8.5% · 30yr
- Down + closing
- —
- Monthly P&I
- —
- Monthly cashflow
- —
- DSCR
- —
- Eligible?
- —
No personal income docs; deal must DSCR.
Hard money
10% down · 12.0% · 12mo
- Down + closing
- —
- Monthly P&I
- —
- Monthly cashflow
- —
- DSCR
- —
- Eligible?
- —
Short-term bridge; refi at stabilization.
Listing history 7 events
-
2026-06-19days on market $242,000 Active 9 DOM
-
2026-06-18days on market $242,000 Active 8 DOM
-
2026-06-17days on market $242,000 Active 7 DOM
-
2026-06-16days on market $242,000 Active 6 DOM
-
2026-06-15days on market $242,000 Active 5 DOM
-
2026-06-14days on market $242,000 Active 3 DOM
-
2026-06-13$242,000 Active 2 DOM
ⓘ Source: listings_history table (triggers on properties + properties_extension) + one-shot
backfill from property_details.listing_events for pre-trigger history.
Tax reassessment forecast ND · Resets to sale price
- Current annual tax
- $4,277 · $356/mo
- Projected year-2 tax
- $4,277 · $356/mo
- Expected delta
- $0/yr ($0/mo · 0.0%)
ⓘ Screening estimate from a state-policy table — verify with the county assessor before closing.
Climate risk First Street
- Heat 2/10 Low
- Air quality 4/10 Moderate 4 unhealthy d/yr today · 4 by 30 yrs out
Nearby sold comps map
Loading sold comps map…
Walkable amenities ~0.75 mi
Loading nearby amenities…
Taxation est. · year 1
- Rental income
- $42,420
- − Mortgage interest
- −$13,556
- − Property taxes
- −$4,277
- − Insurance
- −$1,210
- − Repairs & maintenance
- −$3,394
- − Management
- −$3,394
- − Depreciation
- −$7,040
- Taxable income
- $9,550
- Est. tax owed @ 24.0%
- −$2,292
- After-tax cash flow
- $10,504/yr
For passive investors: Depreciation is non-cash, so a rental often shows a tax loss while cash-flowing — sheltering income. Rental losses are passive: they offset passive income freely, and up to $25,000/yr can offset ordinary (W-2) income if you actively participate and your MAGI is under $100k (phasing out to $0 by $150k); unused losses carry forward. On sale, claimed depreciation is recaptured at up to 25%, and gains may owe capital-gains tax (a 1031 exchange can defer both). Figures are a year-1 estimate at your 24.0% rate — not tax advice; consult a CPA.
Schools (NCES district)
- District
- Grand Forks 1
- NCES district ID
- 3808130
- Math proficiency
- 37% ▼ -8.00%
- Reading proficiency
- 49% ▲ 1.00%
- Median HH income
- $44,234
- Composite
- 36.39/100
- National rank
- #4681
- State rank
- #27 of 53 in ND
Livability — Grand Forks
- Score
- 78/100
- State rank
- #8
- US rank
- #2645
Category grades
Schools grade is shown separately in the Schools card above.
Census & demographics
- Census place
- Grand Forks, ND
- County
- Grand Forks County · 58,851 people
- City population
- 58,851
- Metro
- Grand Forks, ND-MN
- Population (ZIP)
- 42,373
- Household income
- $68,143
- Rent vs Own
- Severe rent burden
- 2110.0
Population outlook (Grand Forks County) Hauer SSP2
- Today (2025)
- 80,606 people
- By 2030
- 86,489 · +7.3%
- By 2040
- 99,506 · +23.4%
- By 2050
- 115,269 · +43.0%
- By 2075
- 171,303 · +112.5%
- By 2100
- 238,330 · +195.7%
Race, ethnicity, and origin ACS 2023
- Neighborhood character
- Predominantly White (82%)
- Race & ethnicity
- White 82% Two or more races 7% Hispanic / Latino 5% Black 4% Asian 2% Native American 2%
- Common ancestry
- Portuguese 26% Romanian 4% Lithuanian 3%
- Foreign-born
- 5% · Canada, South Korea, China
- Languages at home
- 93% English-only · Spanish 1% Other Indo-European 1% Russian/Polish/Slavic 1%
Political lean MEDSL · Grand Forks
- 2024 margin
- R (+18.2) · D 40.1% · R 58.3% · Other 1.6%
- 2008→2024 swing
- -23.3pp toward R · 2008: 5.1pp · 2024: -18.2pp
- All cycles
- 2024: R+18.2 2020: R+13.3 2016: R+18.5 2012: R+3.5 2008: D+5.1
Not yet ingested
- Civics
- —
Market trends
- HPI YoY
- ▼ -197.56%
- Current HPI
- 183.128
- Rent YoY
- ▲ 9.31%
- Metro
- Grand Forks, ND-MN
- State GDP YoY
- ▲ 2.09%
- F500 in state
- 2
Industry mix (Fortune 500 HQ in ND)
| Industry | F500 HQs | Revenue |
|---|---|---|
| Utilities / Construction | 1 | $6B |
|
||
Price history
1 event — show timeline
- 2026-06-10 Listed $242,000 GFAAR
Property tax history
+7.5%/yrLatest (2025): $4,277 · +14.4% YoY. Source: county tax records.
Cash-flow waterfall
monthlySold comps — $/sqft
last 12 mo · ≤1 miLoading sold comps…