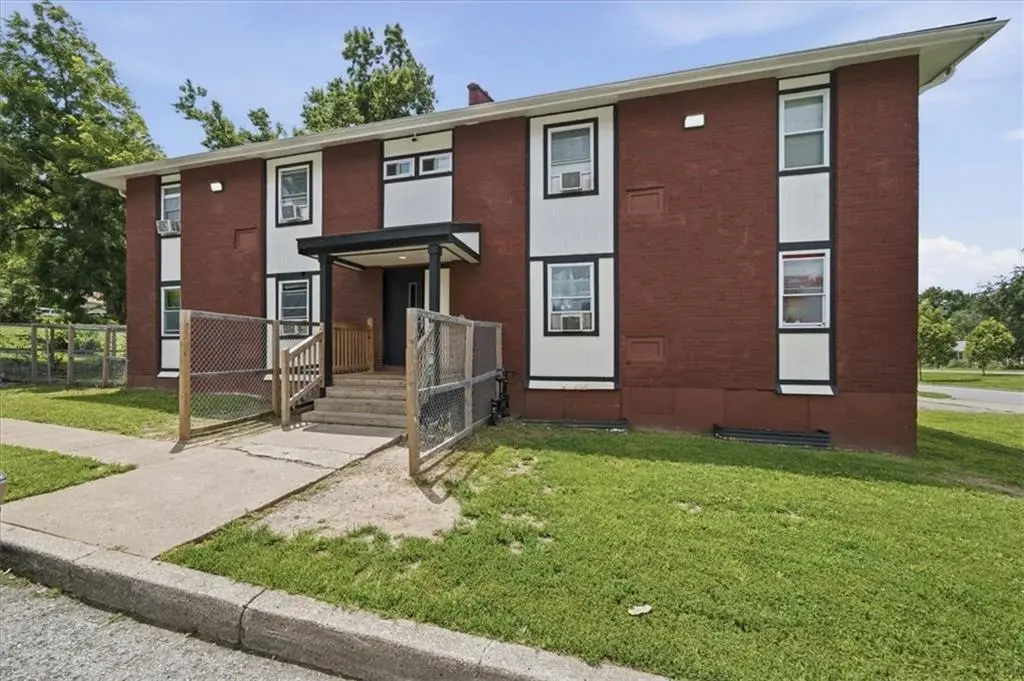
 8-Plex
5401 E 27th Ter · Kansas City, MO
Flood risk 8/10 · Major
- FEMA flood zone
- X (unshaded)
- Chance of flooding over 30 yrs
- 0.99%
- Est. flood insurance / yr
- $507 – $1,088
Fire risk 1/10 · Minimal
- Est. fire insurance / yr
- $1,054 – $1,958
Heat risk 4/10 · Minor
- Hot days now (above 106°F)
- 7 days/yr
- Hot days in 30 yrs
- 17 days/yr
Wind risk 2/10 · Minimal
- Chance of severe wind over 30 yrs
- —
Air-quality risk 3/10 · Minor
- Unhealthy air days now
- 2 days/yr
- Unhealthy air days in 30 yrs
- 3 days/yr
Risk factors via First Street. Map © Google.
Why this score? — see what drove the B- grade
The composite is a weighted blend of 9 inputs, each scored 0–100. Each bar is that input's sub-score; the figure is the points it added to the 100-point composite (weight × sub-score).
- Cash flow +25.2/30.0
- Appreciation +10.0/10.0
- DSCR +8.3/10.0
- ARV discount +7.5/15.0
- 1% rule +5.2/10.0
- Livability +3.9/5.0
- Rent growth +3.7/5.0
- Condition / age +2.5/5.0
- Schools +1.5/10.0
$825,000
🖨 Deal sheet (PDF) 📄 Offer letter ✓ Due diligence
Multi-family units
County records classify this as Multi-Family (5+ Unit). Listing-text estimate: 8 units. confirmed
5+ unit building — per-unit beds/baths from public records are typically unavailable; the breakdown below (if shown) is an estimate from the listing text.
Listing remarks
Exceptional investment opportunity! This recently renovated all-brick 8-unit apartment building offers strong cash flow potential and long-term durability. The property consists of eight 1-bedroom, 1-bathroom units, each approximately 650 square feet, with updated interiors and well-maintained common areas. The building is currently operating as Section 8 housing, providing stable rental income and consistent tenant demand. In addition to the existing units, the basement includes two additional units that have already been framed and are ready for completion, creating a value-add opportunity for increased rental income. Solid brick construction, recent renovations, and expansion potential m
Key facts
- 8,712 sq ft lot
- Built 1960
- Listed 8 days
Property features AI
Finance
- Financial info: Gross income reported at $106,000; Operating expenses include electricity, maintenance, insurance, real estate tax, refuse collection, and water/sewer
- HOA & community: No association fees
Exterior
- Parking: Off-street paved parking
- Utilities: Public water; Public sewer; Individual heat and air
- Home design: Residential income property (apartment); Two-story building; Zoned R-1.5
- Construction: Brick/mortar construction; Composition roof
- Exterior features: Public water; Public sewer; Not in a flood plain; Lot approximately 8,712 square feet
Interior
- Kitchen: Range/oven in units; Refrigerator in units
- Bedrooms: Eight 1-bedroom units; One efficiency unit
- Bathrooms: Each unit has 1 bathroom
- Heating & cooling: Baseboard heating; Window air conditioning units
- Interior features: Applies to all units; Has basement
- Laundry & utility: Central laundry; Individual heating and air utilities
Neighborhood map
What this means for you Summary
Snapshot
- This is a 8 × 1-bed/1.0-bath units multifamily listed at $825k.
Deal economics
- At list price, monthly cash flow is $2k ($21k/yr) — positive. Per door: $222/mo.
- The deal already cash-flows at list — no discount required.
- Meets the 1% rule at list price ($8k rent vs $825k).
- Cap rate 9.0% vs local median 3.9% in Kansas City — top-decile yield for the area; either an underpriced asset or a hidden risk that comps aren't pricing in. Stress-test before assuming the spread holds.
Location & tenants
- Location reads 78/100 on livability (#28 in MO, #2,671 nationally) — a middle-class / working-renter tenant base. Strengths: amenities A+, commute A+, cost of living A+; Watch: crime F.
- Kansas City 33 (urban): math 12% / reading 24% proficiency, ranked #308 of 324 in MO (top 95%) — low school quality limits family demand, transient renter base, plan for 1-2y turnover; 75% free/reduced lunch — lower-income household profile, screen leases tightly.
- Zoned schools: Rogers Elementary (math 8% / reading 16%, grade F, #1,016 of 1,115 statewide, top 92%, 543 students, 99% FRL); Northeast Middle School (math 4% / reading 9%, grade F, #384 of 391 statewide, top 98%, 555 students, 100% FRL); East High School (math 0% / reading 13%, grade F, #516 of 521 statewide, top 99%, 1,112 students, 100% FRL) — zoned schools average 100% FRL vs 75% district-wide (25 pts higher); higher-poverty schools than district average — tighter screening recommended.
- Market conditions: Rents rising fast (+4.7%/yr); 87 active listings in the ZIP; lower-income renter base — watch delinquency; 4,002 units permitted in Jackson County in 2024 (2,271 in 5+ unit buildings).
- At $8,432/mo this rent would consume 280% of the median local household income ($36k/yr) (locally 946% of renters already pay >50% of income on rent) — very limited rent-growth headroom before tenants either downsize or default.
Forward outlook
- In year one you build about $88k of equity ($6k loan paydown + $82k appreciation (10.0% local appreciation)).
- Jackson County population projected at +4% by 2050 — modest demand growth; plan on rents tracking national, not racing it.
- At projected returns (10.0% appreciation + 4.7% rent growth), your $231k cash investment doubles in ~2 years — after that, you're playing with house money.
- By year 2, paydown + projected appreciation supports a ~$142k cash-out refi (75% LTV) — recoverable capital for the next deal without selling this one.
Negotiation context
- Only 8 days on market — expect competitive offers; lowballing is unlikely to land.
- 7 sale attempts since 9y ago with the ask held roughly flat each time — persistent listings suggest the price (not the market) is what's stuck; bring a comps-based counter.
Risks & watch-outs
- Watch-outs: flood insurance adds $66/mo.
- Climate carrying-cost: severe flood risk — expect insurance premiums to compound above CPI over the hold.
Questions for the listing agent
- Can we see the unit-by-unit rent roll, current vacancy, and any below-market leases? What's the average tenancy length?
- What capital expenditures (roof, boiler, parking lot, exteriors) have been made in the last 5 years, and what's planned in the next 2?
- Built in 1960 — when were the roof, HVAC, electrical panel, plumbing, and water heater last replaced?
- What's the actual annual flood-insurance premium (NFIP or private), and is the property in a SFHA with mandatory coverage?
- Is there a deadline driving the sale (1031 exchange, divorce, estate, relocation)? That informs how much negotiation room exists.
- Crime grade is F in this area — have there been break-ins, vandalism, or insurance claims at this property in the last 3 years? What carrier currently insures it and at what premium?
- What's the average days-on-market for RENTAL listings here right now (not sales)? A rising rental-DOM trend means longer vacancies and softer asking-rent achievability than the comps imply.
- What's the recent tenant-quality profile in this submarket — average credit score on applications, eviction rate, late-payment / NSF rate, and stable-employment percentage? A property-management company in the area should have these aggregated.
- How much new apartment / multifamily construction is in the pipeline within 1–3 miles? Heavy new supply (>2% of stock underway) typically softens rents 12–24 months out; light construction supports rent growth.
Investment metrics
- 1% rule
- 1.02% ✓
- Cap rate
- 8.97%
- Cash-on-cash
- 9.56%
- DSCR
- 1.43
- GRM
- 8.2
CMA / ARV
No comps found within radius.
Projected returns pro-forma
10.0% appreciation · 4.65% rent growth · sell at horizon
- IRR
- 31.6%
- Equity multiple
- 3.49×
- Total profit
- $576,135
- Equity at exit
- $743,225
- IRR
- 27.8%
- Equity multiple
- 8.09×
- Total profit
- $1,637,925
- Equity at exit
- $1,602,794
Cash invested: $231,000 (down + closing). Projections, not guarantees.
Landlord ↔ Tenant lean methodology
- Overall (STATE)
- 81 Strongly Landlord-Friendly
- State Missouri
- 81 Strongly Landlord-Friendly · R+10
- County
- — inherits STATE
- City
- — inherits STATE
ZIP-level market 64128
- Home prices YoY
- 21.6%
- Rents YoY
- 4.7%
- Active inventory
- 87
- Price-to-rent
- 65.2×
Monthly cashflow live
- Estimated rent
- $8,432 medium interval (Pro) →
- Mortgage (P&I)
- −$4,326
- Tax from tax record
- −$151 /mo · $1,813/yr
- Insurance
- −$344
- Flood insurance flood zone
- −$66 /mo · $798/yr
- HOA
- −$0
- Vacancy / Maint / Mgmt
- −$1,771
- Net cashflow
- $1,774
Break-even live
Sensitivity live
| Price | -10% $2,241 | -5% $2,007 | +0% $1,774 | +5% $1,540 | +10% $323 |
|---|---|---|---|---|---|
| Rent | -10% $1,108 | -5% $1,441 | +0% $1,774 | +5% $2,107 | +10% $2,440 |
| Rate | -1.0pp $2,189 | -0.5pp $1,983 | base $1,774 | +0.5pp $1,560 | +1.0pp $1,342 |
8-unit breakdown (identical units grouped — click to expand)
| Units | Beds | Baths | Est. rent |
|---|---|---|---|
| 8× units | 1 | 1 | $8,432 |
| #1 | 1 | 1 | $1,054 |
| #2 | 1 | 1 | $1,054 |
| #3 | 1 | 1 | $1,054 |
| #4 | 1 | 1 | $1,054 |
| #5 | 1 | 1 | $1,054 |
| #6 | 1 | 1 | $1,054 |
| #7 | 1 | 1 | $1,054 |
| #8 | 1 | 1 | $1,054 |
| Total (8 units) | $8,432 | ||
UW: 25.0% down · 7.5% · 30yr · 1.5% tax · 5.0% vac · 8.0% maint · 8.0% mgmt
Financing live
Cash to close
- Down payment
- $206,250
- Closing costs
- $24,750
- Reserves months
- —
- Total cash needed
- —
Loan-product check · same deal, 3 products live
Conventional
25% down · 7.5% · 30yr
- Down + closing
- —
- Monthly P&I
- —
- Monthly cashflow
- —
- DSCR
- —
- Eligible?
- —
Personal DTI + credit; lowest rate.
DSCR
20% down · 8.5% · 30yr
- Down + closing
- —
- Monthly P&I
- —
- Monthly cashflow
- —
- DSCR
- —
- Eligible?
- —
No personal income docs; deal must DSCR.
Hard money
10% down · 12.0% · 12mo
- Down + closing
- —
- Monthly P&I
- —
- Monthly cashflow
- —
- DSCR
- —
- Eligible?
- —
Short-term bridge; refi at stabilization.
Listing history 7 events
-
2026-06-21days on market $825,000 Active 8 DOM
-
2026-06-18days on market $825,000 Active 5 DOM
-
2026-06-17days on market $825,000 Active 4 DOM
-
2026-06-16days on market $825,000 Active 3 DOM
-
2026-06-15days on market $825,000 Active 2 DOM
-
2026-06-13remarks 699-char remark
-
2026-06-13$825,000 Active 1 DOM
ⓘ Source: listings_history table (triggers on properties + properties_extension) + one-shot
backfill from property_details.listing_events for pre-trigger history.
Tax reassessment forecast MO · Resets to sale price
- Current annual tax
- $1,813 · $151/mo
- Projected year-2 tax
- $8,002 · $667/mo
- Expected delta
- +$6,190/yr (+$516/mo · 341.5%)
ⓘ Screening estimate from a state-policy table — verify with the county assessor before closing.
Climate risk First Street
- Flood 8/10 Severe FEMA zone X (unshaded) · 99% chance over 30 yrs
- Wildfire 1/10 Low
- Heat 4/10 Moderate 7 d/yr ≥106°F today · 17 d/yr by 30 yrs out
- Wind 2/10 Low
- Air quality 3/10 Moderate 2 unhealthy d/yr today · 3 by 30 yrs out
Nearby sold comps map
Loading sold comps map…
Walkable amenities ~0.75 mi
Loading nearby amenities…
Taxation est. · year 1
- Rental income
- $101,184
- − Mortgage interest
- −$46,213
- − Property taxes
- −$1,813
- − Insurance
- −$4,922
- − Repairs & maintenance
- −$8,095
- − Management
- −$8,095
- − Depreciation
- −$24,000
- Taxable income
- $8,047
- Est. tax owed @ 24.0%
- −$1,931
- After-tax cash flow
- $19,352/yr
For passive investors: Depreciation is non-cash, so a rental often shows a tax loss while cash-flowing — sheltering income. Rental losses are passive: they offset passive income freely, and up to $25,000/yr can offset ordinary (W-2) income if you actively participate and your MAGI is under $100k (phasing out to $0 by $150k); unused losses carry forward. On sale, claimed depreciation is recaptured at up to 25%, and gains may owe capital-gains tax (a 1031 exchange can defer both). Figures are a year-1 estimate at your 24.0% rate — not tax advice; consult a CPA.
Schools (NCES district)
- District
- Kansas City 33
- NCES district ID
- 2916400
- Math proficiency
- 12% ▼ -8.00%
- Reading proficiency
- 24% ▬ 0.00%
- Median HH income
- $35,227
- Composite
- 14.8/100
- National rank
- #9387
- State rank
- #308 of 324 in MO
Livability — Kansas City
- Score
- 78/100
- State rank
- #28
- US rank
- #2671
Category grades
Schools grade is shown separately in the Schools card above.
Census & demographics
- Census place
- Kansas City, MO
- County
- Jackson County · 687,798 people
- City population
- 439,467
- Metro
- Kansas City, MO-KS
- Population (ZIP)
- 11,912
- Household income
- $36,088
- Rent vs Own
- Severe rent burden
- 946.0
Population outlook (Jackson County) Hauer SSP2
- Today (2025)
- 719,589 people
- By 2030
- 731,456 · +1.6%
- By 2040
- 746,689 · +3.8%
- By 2050
- 749,289 · +4.1%
- By 2075
- 736,227 · +2.3%
- By 2100
- 668,210 · -7.1%
Race, ethnicity, and origin ACS 2023
- Neighborhood character
- Predominantly Black (79%)
- Race & ethnicity
- Black 79% Hispanic / Latino 9% White 8% Two or more races 7%
- Hispanic origin (detail)
- Mexican 6%
- Common ancestry
- Swedish 1% Hispanic 1%
- Foreign-born
- 7% · Canada
- Languages at home
- 88% English-only · Spanish 7% French/Haitian/Cajun 2%
Political lean MEDSL · Jackson
- 2024 margin
- D (+19.3) · D 58.9% · R 39.5% · Other 1.6%
- 2008→2024 swing
- -6.1pp toward R · 2008: 25.4pp · 2024: 19.3pp
- All cycles
- 2024: D+19.3 2020: D+22.0 2016: D+16.6 2012: D+19.0 2008: D+25.4
Not yet ingested
- Civics
- —
Market trends
- HPI YoY
- ▲ 73.41%
- Current HPI
- 412.6862
- Rent YoY
- ▲ 4.65%
- Metro
- Kansas City, MO-KS
- State GDP YoY
- ▲ 1.84%
- F500 in state
- 20
Industry mix (Fortune 500 HQ in MO)
| Industry | F500 HQs | Revenue |
|---|---|---|
| Healthcare | 1 | $163B |
|
||
| Insurance | 1 | $21B |
|
||
| Industrial Technology | 1 | $17B |
|
||
| Retail | 1 | $16B |
|
||
| Industrial Distribution | 1 | $10B |
|
||
| Utilities | 1 | $9B |
|
||
Price history
+175.0% since first listed19 events — show timeline
- 2026-06-13 Listed $825,000 Heartland MLS as Distributed by MLS Grid
- 2024-12-26 Listing Removed — Heartland MLS as Distributed by MLS Grid
- 2024-09-25 Listed $999,999 Heartland MLS as Distributed by MLS Grid
- 2024-09-11 Listing Removed — Heartland MLS as Distributed by MLS Grid
- 2024-06-14 Listed $1,000,000 Heartland MLS as Distributed by MLS Grid
- 2020-05-11 Listing Removed — Heartland MLS as Distributed by MLS Grid
- 2020-01-24 Relisted — Heartland MLS as Distributed by MLS Grid
- 2019-10-24 Pending — Heartland MLS as Distributed by MLS Grid
- 2019-08-06 Price Changed $680,000 Heartland MLS as Distributed by MLS Grid
- 2019-06-19 Listed $690,000 Heartland MLS as Distributed by MLS Grid
- 2018-08-06 Sold (MLS) — Heartland MLS as Distributed by MLS Grid
- 2018-05-11 Pending — Heartland MLS as Distributed by MLS Grid
- 2018-04-30 Listed $620,000 Heartland MLS as Distributed by MLS Grid
- 2017-10-10 Sold (MLS) — Heartland MLS as Distributed by MLS Grid
- 2017-07-26 Sold (Public Records) — Public Records
- 2017-05-16 Contingent — Heartland MLS as Distributed by MLS Grid
- 2017-05-11 Listed $299,999 Heartland MLS as Distributed by MLS Grid
- 2014-04-11 Sold (Public Records) — Public Records
- 1989-03-14 Sold (Public Records) — Public Records
Property tax history
+7.9%/yrLatest (2025): $1,813 · +4.1% YoY. Source: county tax records.
Cash-flow waterfall
monthlySold comps — $/sqft
last 12 mo · ≤1 miLoading sold comps…