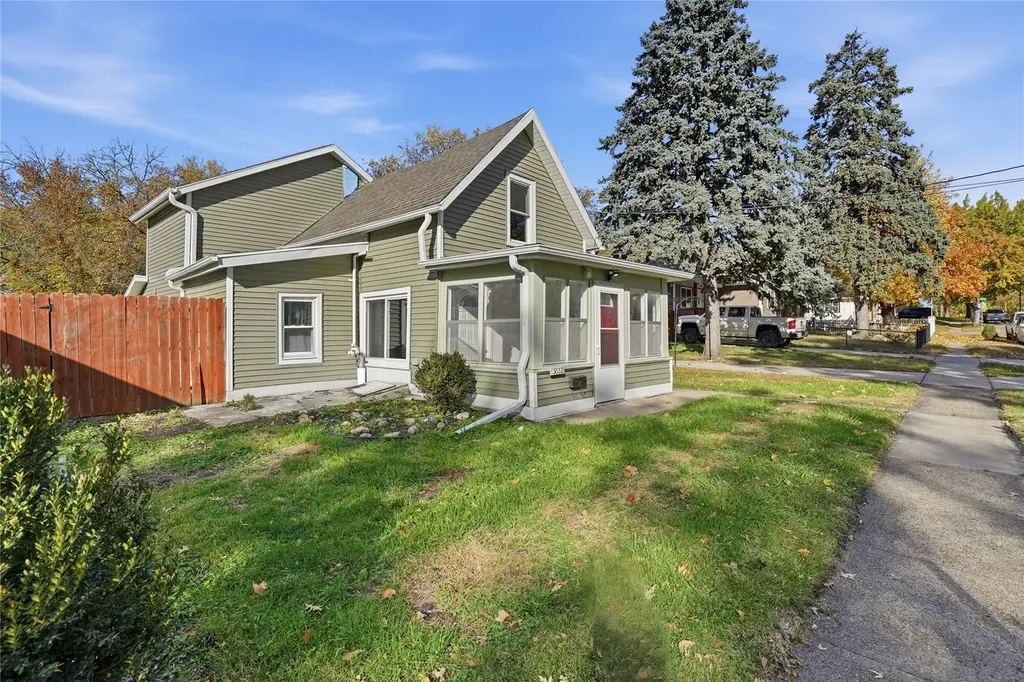
3832 13th St · Des Moines, IA
Flood risk 1/10 · Minimal
- FEMA flood zone
- X (unshaded)
- Chance of flooding over 30 yrs
- 0.0%
- Est. flood insurance / yr
- $473 – $860
Fire risk 1/10 · Minimal
- Est. fire insurance / yr
- $902 – $1,676
Heat risk 3/10 · Minor
- Hot days now (above 103°F)
- 7 days/yr
- Hot days in 30 yrs
- 15 days/yr
Wind risk 2/10 · Minimal
- Chance of severe wind over 30 yrs
- —
Air-quality risk 2/10 · Minimal
- Unhealthy air days now
- 1 days/yr
- Unhealthy air days in 30 yrs
- 2 days/yr
Risk factors via First Street. Map © Google.
Why this score? — see what drove the D grade
The composite is a weighted blend of 9 inputs, each scored 0–100. Each bar is that input's sub-score; the figure is the points it added to the 100-point composite (weight × sub-score).
- ARV discount +15.0/15.0
- Cash flow +7.9/30.0
- Rent growth +5.0/5.0
- Livability +4.0/5.0
- Schools +3.8/10.0
- 1% rule +2.5/10.0
- Condition / age +2.5/5.0
- DSCR +2.0/10.0
- Appreciation +0.0/10.0
$160,000
🖨 Deal sheet 📄 Offer letter ✓ Due diligence
Listing remarks MLS
Move in now, add equity later. This highly livable 3 bedroom 2 bathroom home has fresh paint and flooring throughout, newer vinyl windows, plus new vinyl siding and gutters (2024), roof (2022), driveway and fence (2017). Located just blocks from the shops and restaurants of Highland Park, this quiet neighborhood is the perfect opportunity to be close to a vibrant and growing historic Des Moines district. Selling As-Is. Ask your agent about financing requirements.
Key facts
- Driveway
- Front porch
- New gutters
Tags
Neighborhood map
What this means for you Summary
Snapshot
- This is a 3-bed/2.0-bath single-family listed at $160k.
Deal economics
- At list price, monthly cash flow is $-169 ($-2k/yr) — negative.
- To cash-flow at today's rent, offer at most $130k (18.6% below list).
- To meet the 1% rule (rent ≥ 1% of price), the offer needs to be $119k (25.4% below list).
- Recommended offer: $119k (25.4% below list) — sets the bar for 1% rule.
- Cap rate 5.0% vs local median 3.1% in Des Moines — top-decile yield for the area; either an underpriced asset or a hidden risk that comps aren't pricing in. Stress-test before assuming the spread holds.
Location & tenants
- Location reads 81/100 on livability (#63 in IA, #1,432 nationally) — a professional / high-income tenant draw. Strengths: commute A+, cost of living A+, housing A+; Watch: employment C-, schools D+, crime F.
- Des Moines Independent Community School District (urban): math 43% / reading 46% proficiency, ranked #289 of 289 in IA (top 100%) — families likely to look elsewhere, expect single-tenant / working-renter base with shorter leases; 63% free/reduced lunch — lower-income household profile, screen leases tightly.
- Market conditions: Rents rising fast (+13.1%/yr); 154 active listings in the ZIP; 22 comparable units currently listed for rent nearby; rentals lingering (median 44d on market — plan ~5-8 weeks vacancy on turnover, expect pricing pressure); 50% of comp listings sitting > 30 days — soft ceiling on asking rent; 2,953 units permitted in Polk County in 2024 (540 in 5+ unit buildings).
Forward outlook
- Local home prices are declining (-3.0%/yr); year-one equity from $1k of loan paydown is wiped out by about $5k of value loss. Plan a longer hold.
- Polk County population projected at +37% by 2050 — long-run rental-demand tailwind backs the buy-and-hold thesis.
Negotiation context
- It's been on market 223 days — a 12% lower offer ($141k) is reasonable based on typical stale-listing flexibility.
- 5 sale attempts since 20y ago; this cycle's ask has dropped $29k (15%) from the opening price — seller is motivated, your offer sets the floor, not the list.
Risks & watch-outs
- Watch-outs: built in 1894 — expect roof / HVAC / electrical / plumbing capex.
Questions for the listing agent
- What do current leases actually rent for vs. the listed asking? Can we see a recent rent roll and the last 12 months of T-12 income?
- It's been on market 223 days. Have you received any prior offers? Is the seller open to a 25% concession, seller financing, or rate buy-down credit?
- Built in 1894 — when were the roof, HVAC, electrical panel, plumbing, and water heater last replaced?
- Why hasn't it sold? Are there any deal-killer items the seller is aware of (foundation, flood, title, zoning, code violations)?
- Is there a deadline driving the sale (1031 exchange, divorce, estate, relocation)? That informs how much negotiation room exists.
- Schools are D-rated, which usually means shorter tenancies and higher turnover. Who's the typical renter profile here, and what's been the actual vacancy rate?
- Crime grade is F in this area — have there been break-ins, vandalism, or insurance claims at this property in the last 3 years? What carrier currently insures it and at what premium?
- The area grade is low — what's the realistic commute time and amenity access for the typical tenant pool here? Any planned neighborhood developments (good or bad) we should know about?
- What's the average days-on-market for RENTAL listings here right now (not sales)? A rising rental-DOM trend means longer vacancies and softer asking-rent achievability than the comps imply.
- What's the recent tenant-quality profile in this submarket — average credit score on applications, eviction rate, late-payment / NSF rate, and stable-employment percentage? A property-management company in the area should have these aggregated.
- How much new for-sale + rental construction is in the pipeline within 1–3 miles? Heavy new supply typically softens prices + rents 12–24 months out; constrained supply supports both.
Investment metrics
- 1% rule
- 0.75% ✗
- Cap rate
- 5.03%
- Cash-on-cash
- -4.52%
- DSCR
- 0.80
- GRM
- 11.2
CMA / ARV
- ARV (median comp)
- $194,444
- List price
- $160,000
- Delta
- -17.71%
- Verdict
- UNDERPRICED
- Comps
- 20 within 1.0 mi
Show comp detail 12 sales within ~0.75 mi
| Address | Dist | Beds/Ba | Sqft | Sold | Price | $/sf | Match |
|---|---|---|---|---|---|---|---|
| 3842 12th St | 0.06mi | 3/1.0 | 1,166 (-1%) | 6mo | $175,000 | $150 | 86 |
| 1015 Euclid Ave | 0.30mi | 2/1.5 (-1) | 1,168 (-1%) | 2mo | $60,000 | $51 | 76 |
| 913 Clinton Ave | 0.32mi | 3/2.0 | 1,254 (+6%) | 2mo | $222,500 | $177 | 73 |
| 4118 11th St | 0.38mi | 3/1.0 | 1,210 (+3%) | 9mo | $158,000 | $131 | 66 |
| 3819 10th St | 0.28mi | 4/2.0 (+1) | 1,291 (+10%) | 8mo | $117,000 | $91 | 60 |
| 914 Douglas Ave | 0.30mi | 3/2.0 | 1,338 (+14%) | 4mo | $312,000 | $233 | 60 |
| 4034 6th Ave | 0.61mi | 3/2.0 | 1,122 (-5%) | 10mo | $257,500 | $230 | 56 |
| 945 NW Aurora Ave | 0.52mi | 3/1.5 | 1,080 (-8%) | 9mo | $225,000 | $208 | 52 |
| 4104 14th St | 0.31mi | 2/1.5 (-1) | 1,008 (-14%) | 3mo | $220,000 | $218 | 52 |
| 3812 E 8th St | 0.44mi | 3/1.0 | 1,281 (+9%) | 12mo | $209,000 | $163 | 51 |
| 3301 8th St | 0.60mi | 3/1.0 | 1,053 (-11%) | 11mo | $140,000 | $133 | 41 |
| 4129 5th Ave | 0.75mi | 2/1.0 (-1) | 1,032 (-12%) | 5mo | $177,500 | $172 | 31 |
Match score weights: distance 35% · size 25% · config 20% · recency 20%. Top-matched comps best support the ARV.
Projected returns pro-forma
-3.0% appreciation · 8.0% rent growth · sell at horizon
- IRR
- -18.5%
- Equity multiple
- 0.32×
- Total profit
- $-30,336
- Equity at exit
- $23,857
- IRR
- -3.1%
- Equity multiple
- 0.74×
- Total profit
- $-11,435
- Equity at exit
- $13,834
Cash invested: $44,800 (down + closing). Projections, not guarantees.
Landlord ↔ Tenant lean methodology
- Overall (STATE)
- 83 Strongly Landlord-Friendly
- State Iowa
- 83 Strongly Landlord-Friendly · R+6
- County
- — inherits STATE
- City
- — inherits STATE
ZIP-level market 50313
- Rents YoY
- 13.1%
- Active inventory
- 154
- Price-to-rent
- 11.2×
Monthly cashflow live
- Estimated rent
- $1,194 high interval (Pro) →
- Mortgage (P&I)
- −$839
- Tax from tax record
- −$206 /mo · $2,476/yr
- Insurance
- −$67
- HOA
- −$0
- Vacancy / Maint / Mgmt
- −$251
- Net cashflow
- $-169
Break-even live
UW: 25.0% down · 7.5% · 30yr · 1.5% tax · 5.0% vac · 8.0% maint · 8.0% mgmt
Financing live
Cash to close
- Down payment
- $40,000
- Closing costs
- $4,800
- Reserves months
- —
- Total cash needed
- —
Loan-product check · same deal, 3 products live
Conventional
25% down · 7.5% · 30yr
- Down + closing
- —
- Monthly P&I
- —
- Monthly cashflow
- —
- DSCR
- —
- Eligible?
- —
Personal DTI + credit; lowest rate.
DSCR
20% down · 8.5% · 30yr
- Down + closing
- —
- Monthly P&I
- —
- Monthly cashflow
- —
- DSCR
- —
- Eligible?
- —
No personal income docs; deal must DSCR.
Hard money
10% down · 12.0% · 12mo
- Down + closing
- —
- Monthly P&I
- —
- Monthly cashflow
- —
- DSCR
- —
- Eligible?
- —
Short-term bridge; refi at stabilization.
Rent comps 22 comps
| Address | Beds | Baths | Sqft | Rent | $/sqft | DOM | Units | Dist |
|---|---|---|---|---|---|---|---|---|
| 3410 5th Ave Des Moines, IA | 4.0 | 2.0 | 1474 | $1,550 | $1.05 | 43d | 1 | 0.71mi |
| 4124 3rd St Des Moines, IA | 3.0 | 1.0 | 996 | $1,595 | $1.60 | 14d | 1 | 0.83mi |
| 3700 Martin Luther King Junior Pkwy Unit 18 Des Moines, IA | 2.0 | 1.0 | 730 | $750 | $1.03 | 43d | 1 | 0.83mi |
| 2533 Lynner Dr Des Moines, IA | 2.0 | 1.0 | 800 | $900 | $1.12 | 43d | 1 | 0.88mi |
| 2411 Welbeck Rd #11 Des Moines, IA | 2.0 | 1.0 | 750 | $745 | $0.99 | 43d | 1 | 0.88mi |
| 2411 Welbeck Rd #7 Des Moines, IA | 2.0 | 1.0 | 750 | $845 | $1.13 | 43d | 1 | 0.88mi |
| 2525 Clarkson Ave Unit 04 Des Moines, IA | 2.0 | 1.0 | 775 | $895 | $1.15 | 43d | 1 | 0.90mi |
| 2715 Douglas Ave Des Moines, IA | 3.0 | 2.0 | 1109 | $1,408 | $1.27 | 14d | 1 | 0.97mi |
| 3623 Cambridge St Des Moines, IA | 2.0 | 1.0 | 732 | $1,145 | $1.56 | 19d | 1 | 1.05mi |
| 2501 24th St Unit 101 Des Moines, IA | 2.0 | 1.0 | 750 | $725 | $0.97 | 23d | 1 | 1.22mi |
| 2501 24th St Apt 107 Des Moines, IA | 3.0 | 2.0 | 950 | $1,045 | $1.10 | 14d | 1 | 1.22mi |
| 2501 24th St Unit 113 Des Moines, IA | 2.0 | 1.0 | 750 | $945 | $1.26 | 43d | 1 | 1.22mi |
| 2501 24th St Des Moines, IA | 2.0 | 1.0 | 910 | $795 | $0.87 | 23d | 1 | 1.22mi |
| 2501 24th St Apt 106 Des Moines, IA | 4.0 | 2.0 | 1175 | $1,245 | $1.06 | 43d | 1 | 1.22mi |
| 2501 24th St Unit 111 Des Moines, IA | 2.0 | 1.0 | 750 | $760 | $1.01 | 23d | 1 | 1.22mi |
| 2501 24th St Unit 121 Des Moines, IA | 3.0 | 2.0 | 950 | $995 | $1.05 | 23d | 1 | 1.23mi |
| 2901 Boston Ave Des Moines, IA | 1.0–2.0 | 1.0–1.5 | 707 | $1,300 | $1.84 | 14d | 7 | 1.24mi |
| 3120 Douglas Ave Des Moines, IA | 2.0 | 1.0 | 850 | $970 | $1.14 | 14d | 3 | 1.28mi |
| 3915 Lawnwoods Dr Des Moines, IA | 3.0 | 1.5 | 1192 | $1,850 | $1.55 | 43d | 1 | 1.32mi |
| 1914 10th St Des Moines, IA | 2.0 | 1.0 | 740 | $1,050 | $1.42 | 43d | 1 | 1.35mi |
| 1914 10th St Des Moines, IA | 2.0 | 1.0 | 740 | $1,050 | $1.42 | 23d | 1 | 1.35mi |
| 3103 E 7th St Des Moines, IA | 2.0 | 1.0 | 960 | $1,200 | $1.25 | 43d | 1 | 1.47mi |
Listing history 35 events
-
2026-06-18days on market $160,000 Active 223 DOM
-
2026-06-17days on market $160,000 Active 222 DOM
-
2026-06-16days on market $160,000 Active 221 DOM
-
2026-06-15days on market $160,000 Active 220 DOM
-
2026-06-14days on market $160,000 Active 218 DOM
-
2026-06-13days on market $160,000 Active 217 DOM
-
2026-06-10days on market $160,000 Active 215 DOM
-
2026-06-09days on market $160,000 Active 214 DOM
-
2026-06-08days on market $160,000 Active 213 DOM
-
2026-06-07days on market $160,000 Active 212 DOM
-
2026-06-05days on market $160,000 Active 209 DOM
-
2026-06-03days on market $160,000 Active 208 DOM
-
2026-06-02days on market $160,000 Active 207 DOM
-
2026-06-01days on market $160,000 Active 206 DOM
-
2026-05-31days on market $160,000 Active 205 DOM
-
2026-05-31days on market $160,000 Active 204 DOM
-
2026-04-07price $160,000 467-char remark
Show marketing remark (467 chars)
Move in now, add equity later. This highly livable 3 bedroom 2 bathroom home has fresh paint and flooring throughout, newer vinyl windows, plus new vinyl siding and gutters (2024), roof (2022), driveway and fence (2017). Located just blocks from the shops and restaurants of Highland Park, this quiet neighborhood is the perfect opportunity to be close to a vibrant and growing historic Des Moines district. Selling As-Is. Ask your agent about financing requirements.
-
2026-01-05price $184,900 467-char remark
Show marketing remark (467 chars)
Move in now, add equity later. This highly livable 3 bedroom 2 bathroom home has fresh paint and flooring throughout, newer vinyl windows, plus new vinyl siding and gutters (2024), roof (2022), driveway and fence (2017). Located just blocks from the shops and restaurants of Highland Park, this quiet neighborhood is the perfect opportunity to be close to a vibrant and growing historic Des Moines district. Selling As-Is. Ask your agent about financing requirements.
-
2025-11-07$189,000 Active 467-char remark
Show marketing remark (467 chars)
Move in now, add equity later. This highly livable 3 bedroom 2 bathroom home has fresh paint and flooring throughout, newer vinyl windows, plus new vinyl siding and gutters (2024), roof (2022), driveway and fence (2017). Located just blocks from the shops and restaurants of Highland Park, this quiet neighborhood is the perfect opportunity to be close to a vibrant and growing historic Des Moines district. Selling As-Is. Ask your agent about financing requirements.
-
2022-12-02soldstatus $148,000
-
2022-12-01soldstatus $148,000 Closed 336-char remark
Show marketing remark (336 chars)
Check out this three bedroom, two bathroom one and a half story home! Relax out on your front porch or out in the very large fully fenced in backyard! Located near Highland Park with tons of shops and restaurants! Schedule an appointment‌‌‌‌‌‌‌‌‌‌‌‌ today!
-
2022-10-24status Pending 336-char remark
Show marketing remark (336 chars)
Check out this three bedroom, two bathroom one and a half story home! Relax out on your front porch or out in the very large fully fenced in backyard! Located near Highland Park with tons of shops and restaurants! Schedule an appointment‌‌‌‌‌‌‌‌‌‌‌‌ today!
-
2022-10-13price $150,000 336-char remark
Show marketing remark (336 chars)
Check out this three bedroom, two bathroom one and a half story home! Relax out on your front porch or out in the very large fully fenced in backyard! Located near Highland Park with tons of shops and restaurants! Schedule an appointment‌‌‌‌‌‌‌‌‌‌‌‌ today!
-
2022-10-10price $160,000 336-char remark
Show marketing remark (336 chars)
Check out this three bedroom, two bathroom one and a half story home! Relax out on your front porch or out in the very large fully fenced in backyard! Located near Highland Park with tons of shops and restaurants! Schedule an appointment‌‌‌‌‌‌‌‌‌‌‌‌ today!
-
2022-09-22$170,000 Active 336-char remark
Show marketing remark (336 chars)
Check out this three bedroom, two bathroom one and a half story home! Relax out on your front porch or out in the very large fully fenced in backyard! Located near Highland Park with tons of shops and restaurants! Schedule an appointment‌‌‌‌‌‌‌‌‌‌‌‌ today!
-
2017-05-03soldstatus $87,000
-
2017-05-01soldstatus $86,900
-
2017-02-01$86,900
-
2017-01-10historical
-
2016-07-20$95,500
-
2006-12-14soldstatus $40,000
-
2006-12-08soldstatus $39,900
-
2006-10-08$39,900
-
2006-05-23soldstatus $59,000
-
2006-04-21soldstatus $56,000
ⓘ Source: listings_history table (triggers on properties + properties_extension) + one-shot
backfill from property_details.listing_events for pre-trigger history.
Tax reassessment forecast IA · Partial reset (capped growth)
- Current annual tax
- $2,476 · $206/mo
- Projected year-2 tax
- $2,494 · $208/mo
- Expected delta
- +$18/yr (+$2/mo · 0.7%)
ⓘ Screening estimate from a state-policy table — verify with the county assessor before closing.
Climate risk First Street
- Flood 1/10 Low FEMA zone X (unshaded) · 0% chance over 30 yrs
- Wildfire 1/10 Low
- Heat 3/10 Moderate 7 d/yr ≥103°F today · 15 d/yr by 30 yrs out
- Wind 2/10 Low
- Air quality 2/10 Low 1 unhealthy d/yr today · 2 by 30 yrs out
Nearby sold comps map
Loading sold comps map…
Walkable amenities ~0.75 mi
Loading nearby amenities…
Taxation est. · year 1
- Rental income
- $14,330
- − Mortgage interest
- −$8,962
- − Property taxes
- −$2,476
- − Insurance
- −$800
- − Repairs & maintenance
- −$1,146
- − Management
- −$1,146
- − Depreciation
- −$4,655
- Taxable loss
- −$4,856
- Est. tax savings @ 24.0%
- +$1,165
- After-tax cash flow
- $-858/yr
For passive investors: Depreciation is non-cash, so a rental often shows a tax loss while cash-flowing — sheltering income. Rental losses are passive: they offset passive income freely, and up to $25,000/yr can offset ordinary (W-2) income if you actively participate and your MAGI is under $100k (phasing out to $0 by $150k); unused losses carry forward. On sale, claimed depreciation is recaptured at up to 25%, and gains may owe capital-gains tax (a 1031 exchange can defer both). Figures are a year-1 estimate at your 24.0% rate — not tax advice; consult a CPA.
Schools (NCES district)
- District
- Des Moines Independent Community School District
- NCES district ID
- 1908970
- Math proficiency
- 43% ▼ -6.00%
- Reading proficiency
- 46% ▼ -1.00%
- Median HH income
- $45,905
- Composite
- 37.83/100
- National rank
- #4331
- State rank
- #289 of 289 in IA
Livability — Des Moines
- Score
- 81/100
- State rank
- #63
- US rank
- #1432
Category grades
Schools grade is shown separately in the Schools card above.
Census & demographics
- Census place
- Des Moines, IA
- County
- Polk County · 453,298 people
- City population
- 203,612
- Metro
- Des Moines-West Des Moines, IA
- Population (ZIP)
- 17,440
- Household income
- $68,361
- Rent vs Own
- Severe rent burden
- 454.0
Population outlook (Polk County) Hauer SSP2
- Today (2025)
- 548,042 people
- By 2030
- 588,557 · +7.4%
- By 2040
- 670,629 · +22.4%
- By 2050
- 752,830 · +37.4%
- By 2075
- 955,069 · +74.3%
- By 2100
- 1,115,436 · +103.5%
Race, ethnicity, and origin ACS 2023
- Neighborhood character
- Diverse neighborhood (Simpson 0.58)
- Race & ethnicity
- White 61% Hispanic / Latino 17% Black 11% Two or more races 8% Asian 6%
- Hispanic origin (detail)
- Mexican 11%
- Common ancestry
- Iranian 3% Portuguese 2% Scotch-Irish 2%
- Foreign-born
- 16% · Canada, Philippines, Vietnam
- Languages at home
- 75% English-only · Spanish 14% Other Asian/Pacific 4% Russian/Polish/Slavic 1%
Political lean MEDSL · Polk
- 2024 margin
- D (+10.9) · D 54.8% · R 43.9% · Other 1.3%
- 2008→2024 swing
- -3.7pp toward R · 2008: 14.6pp · 2024: 10.9pp
- All cycles
- 2024: D+10.9 2020: D+15.2 2016: D+11.5 2012: D+14.2 2008: D+14.6
Not yet ingested
- Civics
- —
Market trends
- HPI YoY
- ▼ -162.17%
- Current HPI
- 285.5708
- Rent YoY
- ▲ 13.11%
- Metro
- Des Moines-West Des Moines, IA
- State GDP YoY
- ▲ 2.48%
- F500 in state
- 4
Industry mix (Fortune 500 HQ in IA)
| Industry | F500 HQs | Revenue |
|---|---|---|
| Financial Services | 1 | $16B |
|
||
| Retail / Convenience | 1 | $15B |
|
||
Price history
+185.7% since first listed19 events — show timeline
- 2026-04-07 Price Changed $160,000 DMMLS
- 2026-01-05 Price Changed $184,900 DMMLS
- 2025-11-07 Listed $189,000 DMMLS
- 2022-12-02 Sold (Public Records) $148,000 Public Records
- 2022-12-01 Sold (MLS) $148,000 DMMLS
- 2022-10-24 Pending — DMMLS
- 2022-10-13 Price Changed $150,000 DMMLS
- 2022-10-10 Price Changed $160,000 DMMLS
- 2022-09-22 Listed $170,000 DMMLS
- 2017-05-03 Sold (Public Records) $87,000 Public Records
- 2017-05-01 Sold (MLS) $86,900 DMMLS
- 2017-02-01 Listed $86,900 DMMLS
- 2017-01-10 Listing Removed — DMMLS
- 2016-07-20 Listed $95,500 DMMLS
- 2006-12-14 Sold (Public Records) $40,000 Public Records
- 2006-12-08 Sold (MLS) $39,900 DMMLS
- 2006-10-08 Listed $39,900 DMMLS
- 2006-05-23 Sold (Public Records) $59,000 Public Records
- 2006-04-21 Sold (Public Records) $56,000 Public Records
Property tax history
+4.2%/yrLatest (2025): $2,476 · +2.2% YoY. Source: county tax records.
Cash-flow waterfall
monthlySold comps — $/sqft
last 12 mo · ≤1 miLoading sold comps…